| Param | Original file | Final file |
|---|---|---|
| Filename | modeM0/AS1A14_041T01_9000006510_54026cztM0_level2.fits | modeM0/AS1A14_041T01_9000006510_54026cztM0_level2_quad_clean.evt |
| Size (bytes) | 737,150,400 | 101,024,640 |
| Size | 703.0 MB | 96.3 MB |
| Events in quadrant A | 3,919,433 | 714,096 |
| Events in quadrant B | 4,070,548 | 782,149 |
| Events in quadrant C | 4,427,097 | 696,143 |
| Events in quadrant D | 14,264,317 | 324,079 |
| Mode SS | |||
|---|---|---|---|
| Quadrant | BADHDUFLAG | Total packets | Discarded packets |
| A | 0 | 156 | 0 |
| B | 0 | 156 | 0 |
| C | 0 | 156 | 0 |
| D | 0 | 156 | 0 |
| Mode M0 | |||
|---|---|---|---|
| Quadrant | BADHDUFLAG | Total packets | Discarded packets |
| A | 0 | 17710 | 2 |
| B | 0 | 17867 | 2 |
| C | 0 | 19087 | 2 |
| D | 0 | 47730 | 2 |
| Quadrant | Total seconds | Saturated seconds | Saturation percentage |
|---|---|---|---|
| A | 7796 | 245 | 3.142637% |
| B | 7797 | 287 | 3.680903% |
| C | 7797 | 223 | 2.860074% |
| D | 7797 | 4183 | 53.648839% |
Noise dominated data is calculated using 1-second bins in cleaned event files. If a bin has >2000 counts, and if more than 50% of those come from <1% of pixels, then it is considered to be noise-dominated and hence unusable.
| Quadrant | # 1 sec bins | Bins with >0 counts | Bins with >2000 counts | High rate bins dominated by noise | Noise dominated (total time) | Noise dominated (detector-on time) | Marked lightcurve |
|---|---|---|---|---|---|---|---|
| A | 7821 | 7797 | 105 | 105 | 1.34% | 1.35% | 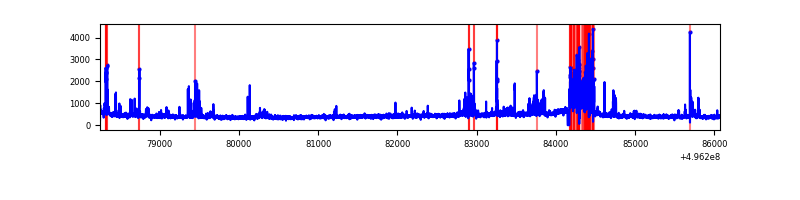 |
| B | 7822 | 7798 | 92 | 92 | 1.18% | 1.18% | 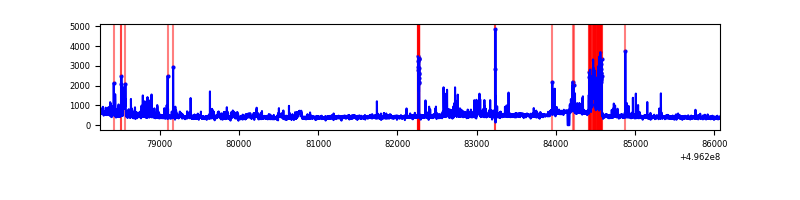 |
| C | 7822 | 7798 | 138 | 138 | 1.76% | 1.77% | 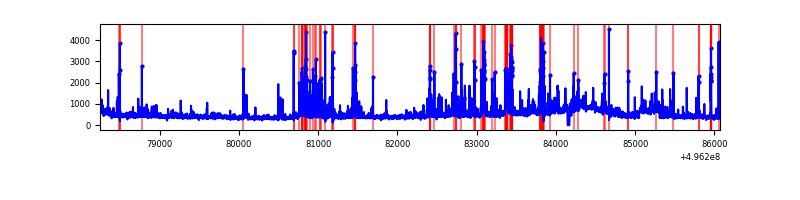 |
| D | 7822 | 7798 | 3544 | 3544 | 45.31% | 45.45% | 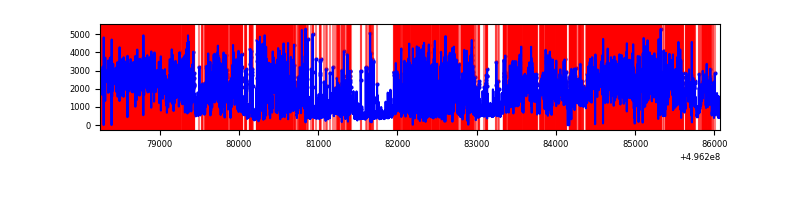 |
Top three noisy pixels from each quadrant. If the there are fewer than three noisy pixels in the level2.evt file, extra rows are filled as -1
| Pixel properties | Quadrant properties | ||||||
|---|---|---|---|---|---|---|---|
| Quadrant | DetID | PixID | Counts | Sigma | Mean | Median | Sigma |
| A | 15 | 174 | 575929 | 2878.58 | 808 | 787 | 199.8 |
| A | 0 | 8 | 72899 | 360.92 | 808 | 787 | 199.8 |
| A | 2 | 143 | 32887 | 160.66 | 808 | 787 | 199.8 |
| B | 0 | 213 | 342443 | 1988.91 | 817 | 791 | 171.8 |
| B | 5 | 236 | 154252 | 893.37 | 817 | 791 | 171.8 |
| B | 7 | 252 | 92188 | 532.06 | 817 | 791 | 171.8 |
| C | 14 | 254 | 245496 | 1121.11 | 805 | 797 | 218.3 |
| C | 1 | 241 | 200735 | 916.04 | 805 | 797 | 218.3 |
| C | 13 | 3 | 170343 | 776.79 | 805 | 797 | 218.3 |
| D | 8 | 176 | 10491534 | 64996.02 | 571 | 547 | 161.4 |
| D | 3 | 12 | 1048076 | 6489.88 | 571 | 547 | 161.4 |
| D | 7 | 70 | 103027 | 634.91 | 571 | 547 | 161.4 |
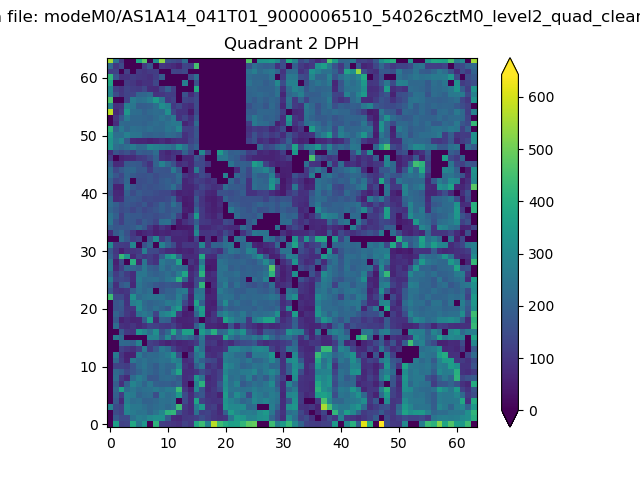
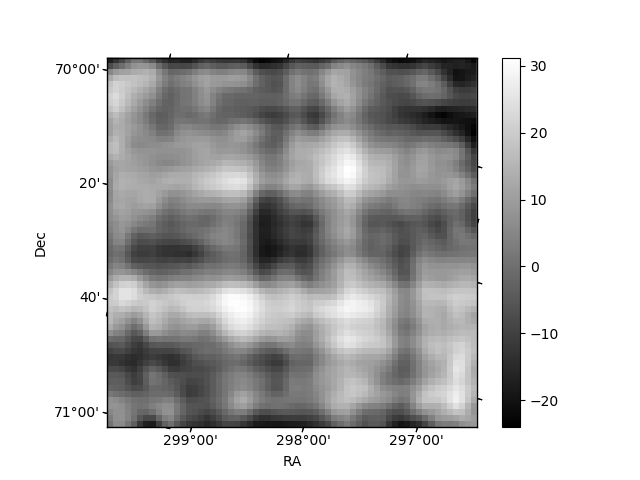
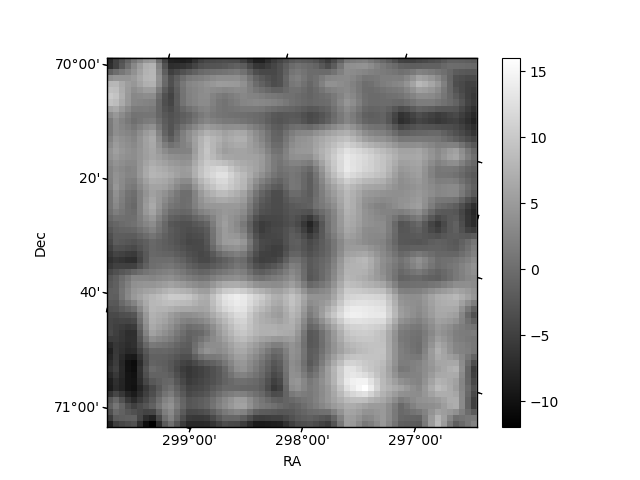
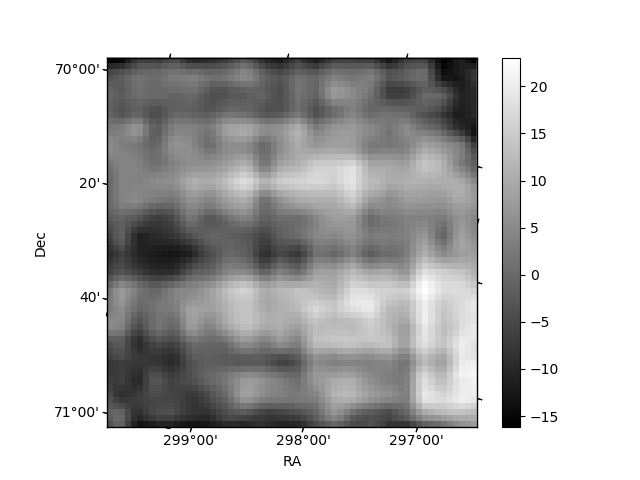
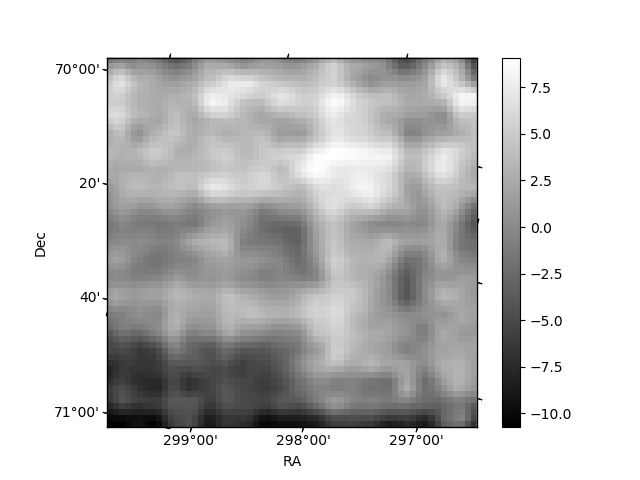
Histogram calculated using DETX and DETY for each event in the final _common_clean file
| Quadrant A | 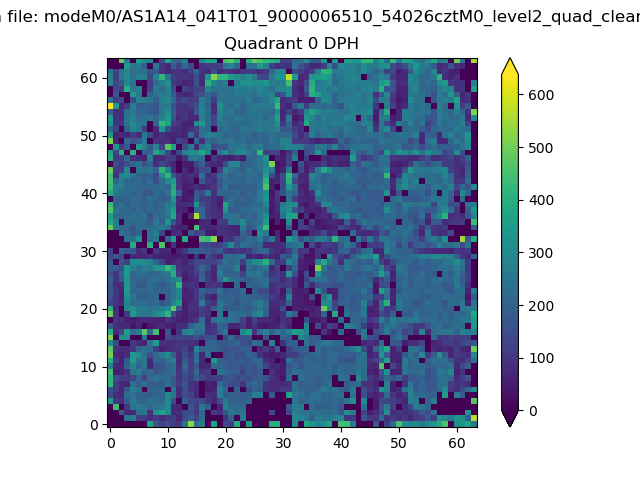 |
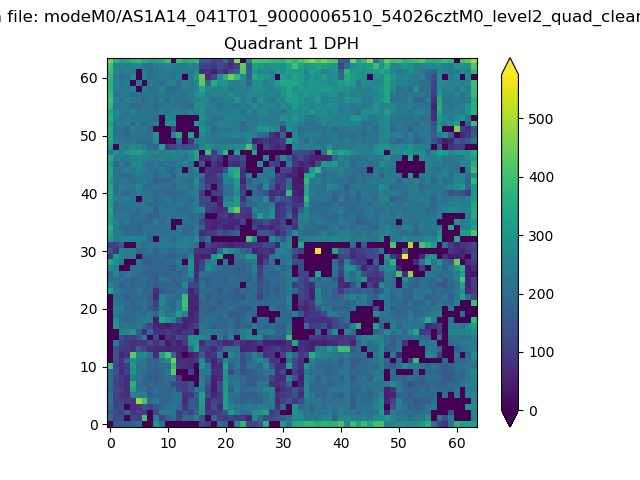 |
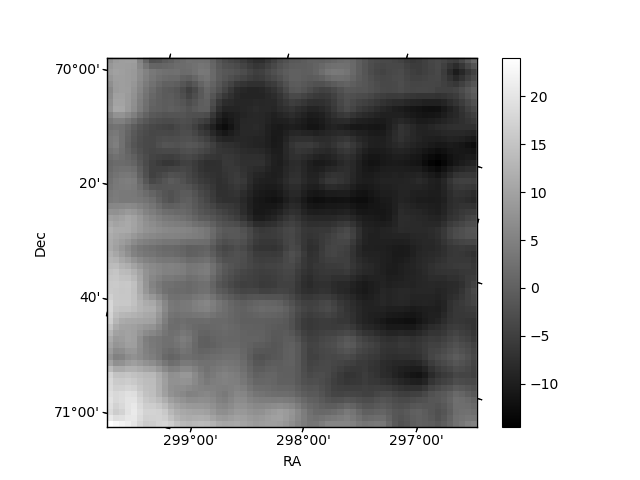
Quadrant B |
|---|---|---|---|
| Quadrant D | 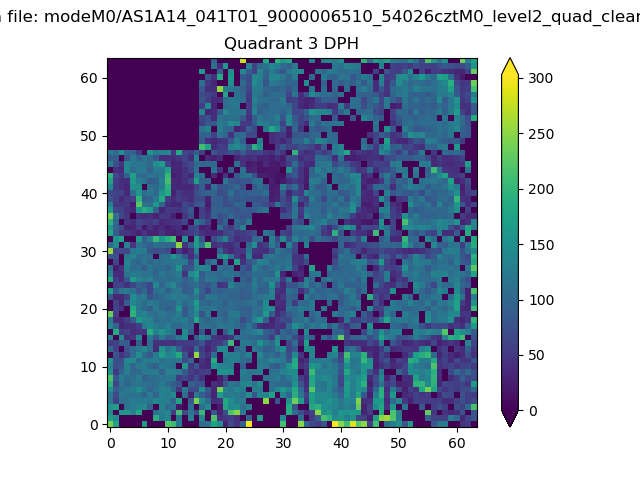 |
 |
Quadrant C |
| Plot type | Count rate plots | Images |
|---|---|---|
| Comparison with Poisson distribution Blue bars denote a histogram of data divided into 1 sec bins. Red curve is a Poisson curve with rate = median count rate of data. |
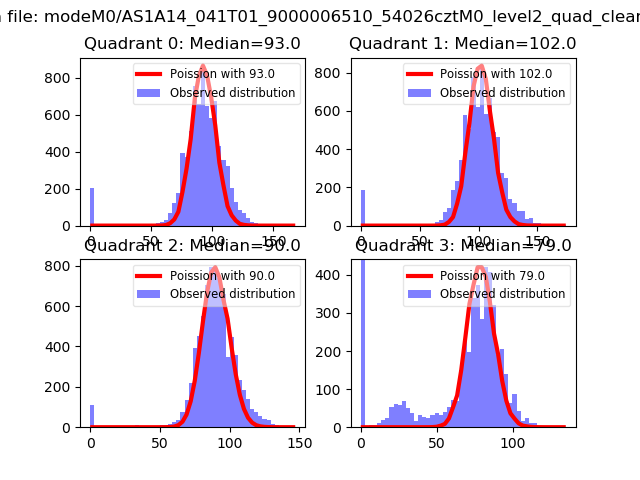 |
 |
| Quadrant-wise count rates Data is divided into 100 sec bins |
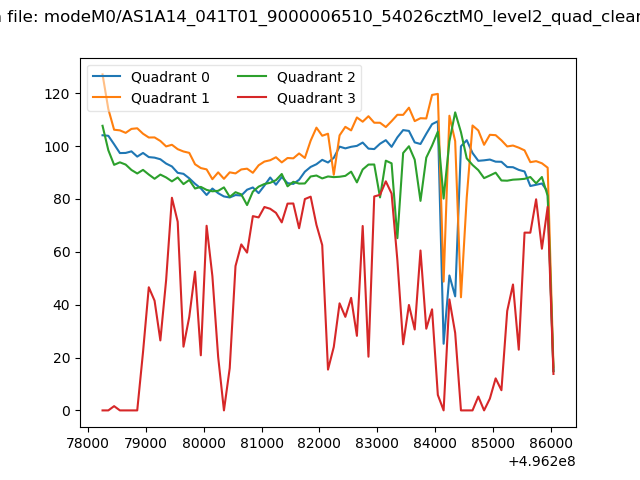 |
|
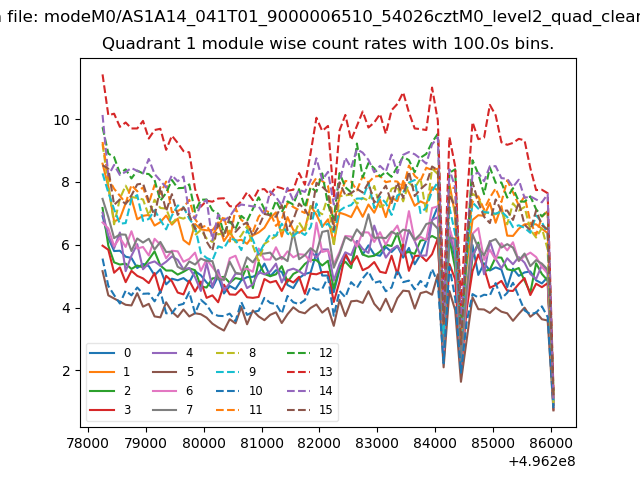
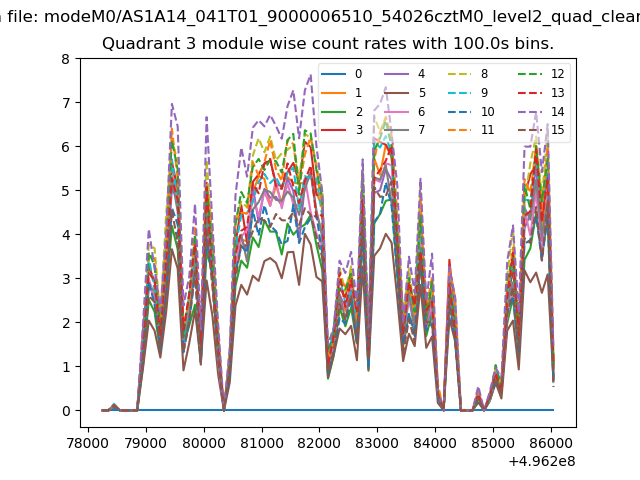
| Module-wise count rates for Quadrant A Data is divided into 100 sec bins |
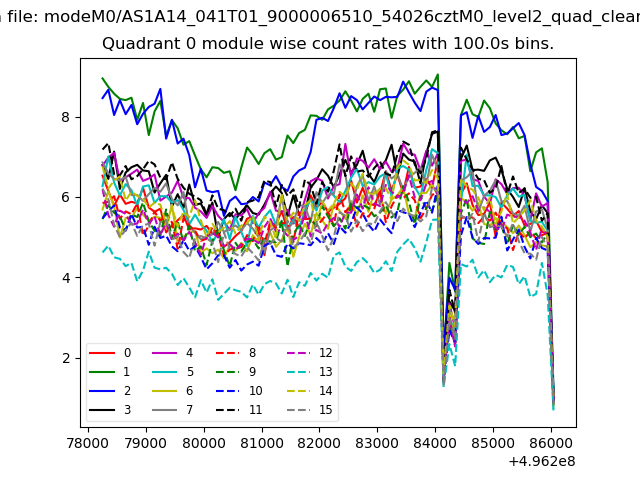 |
 |
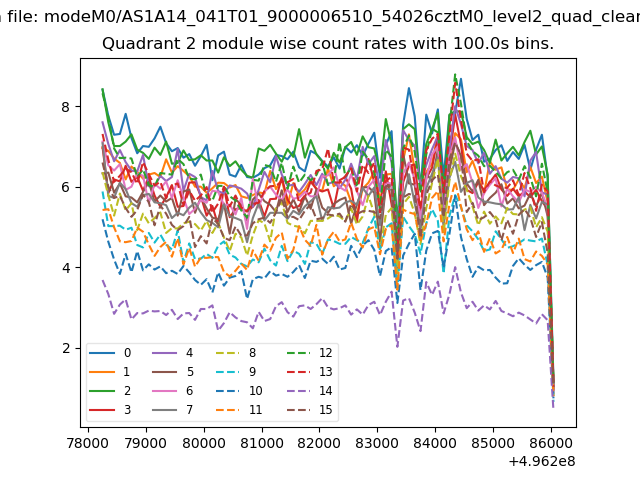
| Module-wise count rates for Quadrant B Data is divided into 100 sec bins |
 |
 |
| Module-wise count rates for Quadrant C Data is divided into 100 sec bins |
 |
 |
| Module-wise count rates for Quadrant D Data is divided into 100 sec bins |
 |
 |
| Parameter | Plot |
|---|---|
| CZT HV Monitor | 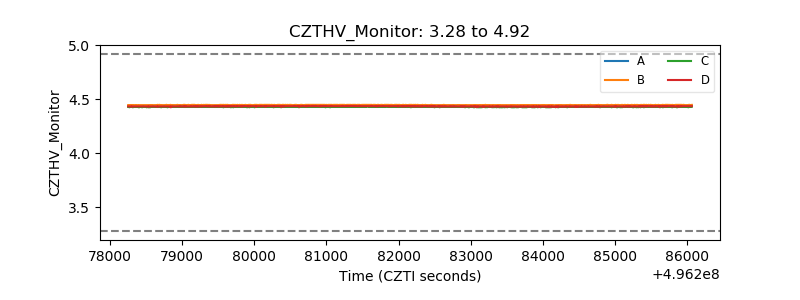 |
| D_VDD | 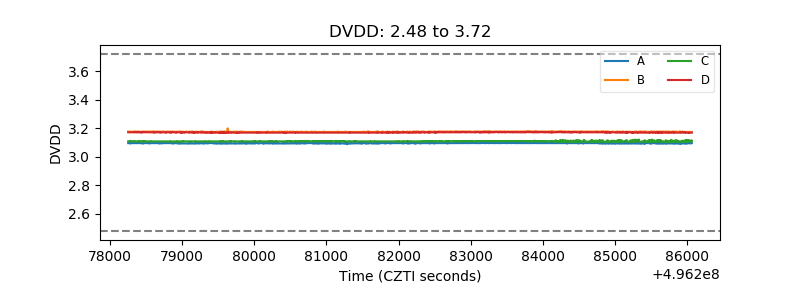 |
| Temperature 1 | 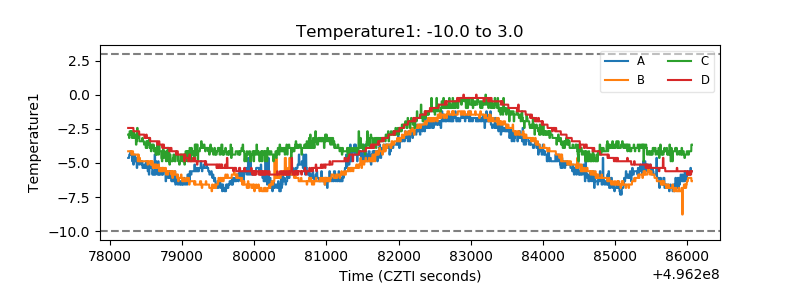 |
| Veto HV Monitor | 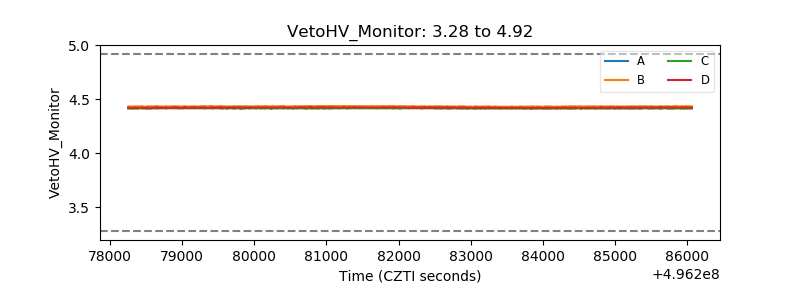 |
| Veto LLD | 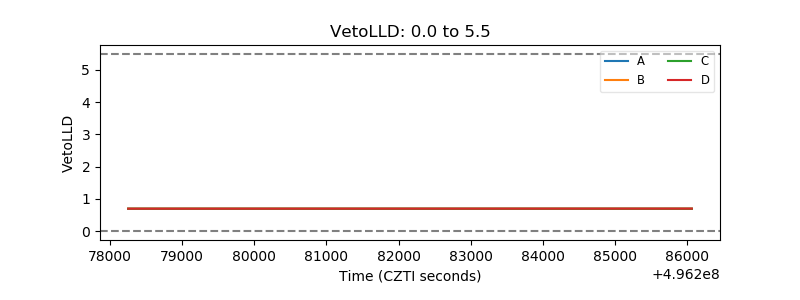 |
| Alpha Counter | 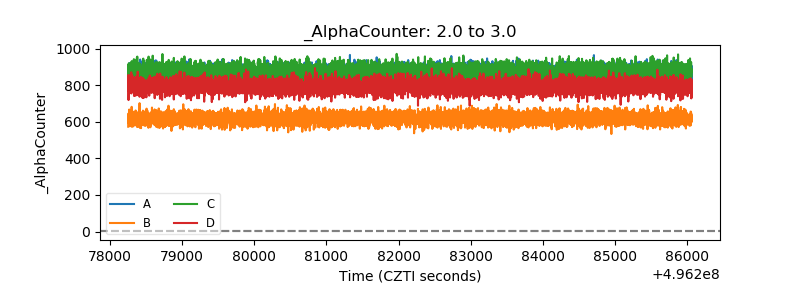 |
| _CPM_Rate | 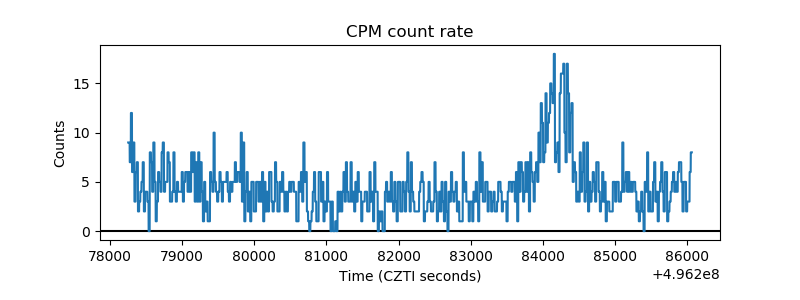 |
| CZT Counter | 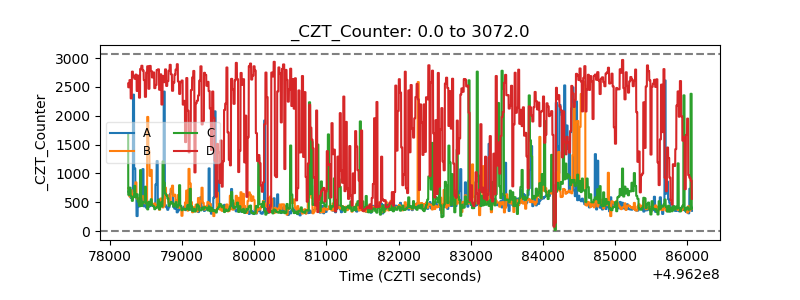 |
| +2.5 Volts monitor |  |
| +5 Volts monitor |  |
| _ROLL_ROT | 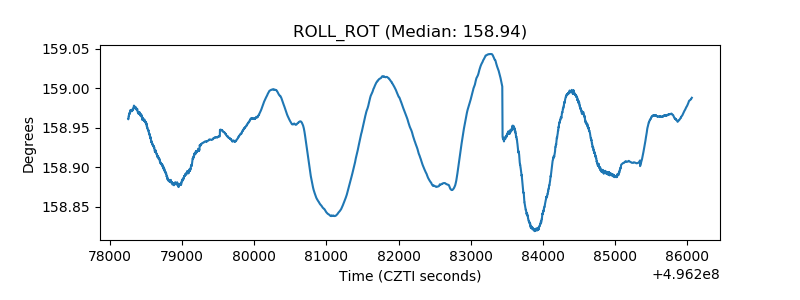 |
| _Roll_DEC | 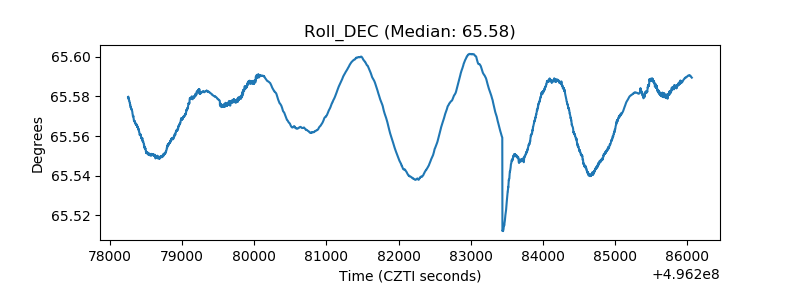 |
| _Roll_RA | 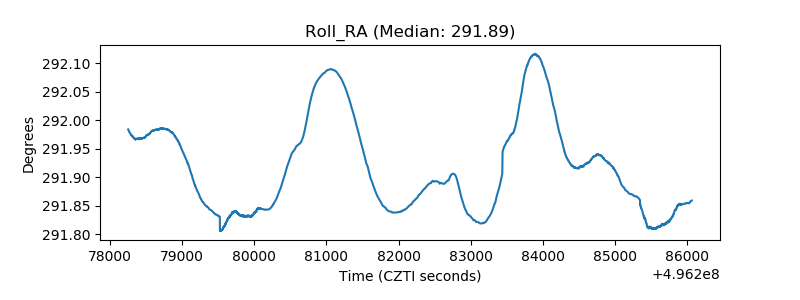 |
| Veto Counter | 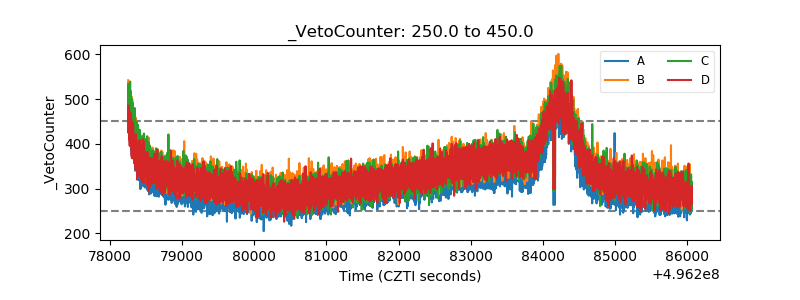 |