| Param | Original file | Final file |
|---|---|---|
| Filename | modeM0/AS1A14_041T01_9000006510_54028cztM0_level2.fits | modeM0/AS1A14_041T01_9000006510_54028cztM0_level2_quad_clean.evt |
| Size (bytes) | 722,347,200 | 115,680,960 |
| Size | 688.9 MB | 110.3 MB |
| Events in quadrant A | 4,145,003 | 793,613 |
| Events in quadrant B | 4,711,753 | 860,179 |
| Events in quadrant C | 5,280,144 | 740,578 |
| Events in quadrant D | 11,935,104 | 511,039 |
| Mode SS | |||
|---|---|---|---|
| Quadrant | BADHDUFLAG | Total packets | Discarded packets |
| A | 0 | 172 | 0 |
| B | 0 | 172 | 0 |
| C | 0 | 172 | 0 |
| D | 0 | 172 | 0 |
| Mode M0 | |||
|---|---|---|---|
| Quadrant | BADHDUFLAG | Total packets | Discarded packets |
| A | 0 | 18808 | 0 |
| B | 0 | 20254 | 0 |
| C | 0 | 21898 | 0 |
| D | 0 | 41564 | 0 |
| Quadrant | Total seconds | Saturated seconds | Saturation percentage |
|---|---|---|---|
| A | 8598 | 128 | 1.488718% |
| B | 8599 | 232 | 2.697988% |
| C | 8599 | 362 | 4.209792% |
| D | 8599 | 2621 | 30.480288% |
Noise dominated data is calculated using 1-second bins in cleaned event files. If a bin has >2000 counts, and if more than 50% of those come from <1% of pixels, then it is considered to be noise-dominated and hence unusable.
| Quadrant | # 1 sec bins | Bins with >0 counts | Bins with >2000 counts | High rate bins dominated by noise | Noise dominated (total time) | Noise dominated (detector-on time) | Marked lightcurve |
|---|---|---|---|---|---|---|---|
| A | 8598 | 8598 | 96 | 96 | 1.12% | 1.12% | 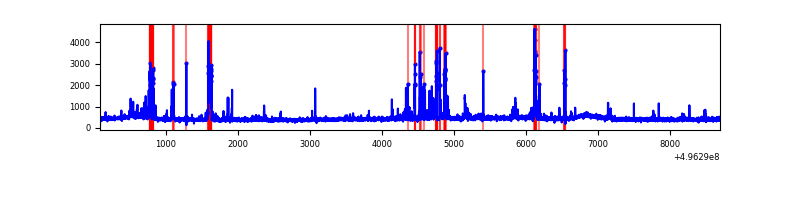 |
| B | 8599 | 8599 | 123 | 123 | 1.43% | 1.43% | 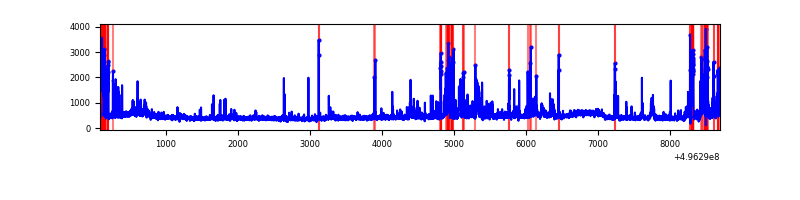 |
| C | 8599 | 8599 | 281 | 281 | 3.27% | 3.27% | 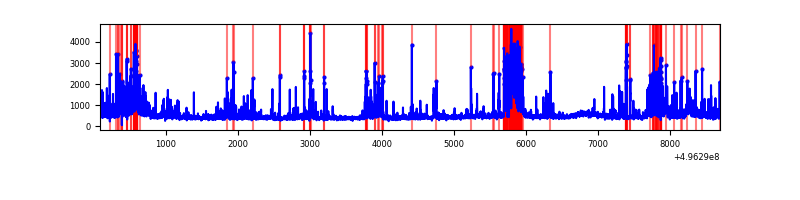 |
| D | 8599 | 8599 | 2450 | 2450 | 28.49% | 28.49% | 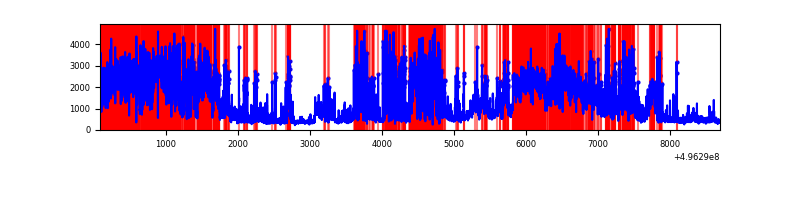 |
Top three noisy pixels from each quadrant. If the there are fewer than three noisy pixels in the level2.evt file, extra rows are filled as -1
| Pixel properties | Quadrant properties | ||||||
|---|---|---|---|---|---|---|---|
| Quadrant | DetID | PixID | Counts | Sigma | Mean | Median | Sigma |
| A | 15 | 174 | 370024 | 1668.47 | 897 | 874 | 221.3 |
| A | 4 | 249 | 140086 | 629.21 | 897 | 874 | 221.3 |
| A | 7 | 14 | 46241 | 205.05 | 897 | 874 | 221.3 |
| B | 5 | 236 | 579741 | 3049.94 | 899 | 866 | 189.8 |
| B | 0 | 213 | 229073 | 1202.36 | 899 | 866 | 189.8 |
| B | 0 | 155 | 127419 | 666.77 | 899 | 866 | 189.8 |
| C | 1 | 241 | 529342 | 2234.58 | 869 | 861 | 236.5 |
| C | 13 | 3 | 383768 | 1619.05 | 869 | 861 | 236.5 |
| C | 12 | 249 | 314093 | 1324.44 | 869 | 861 | 236.5 |
| D | 8 | 176 | 6596142 | 30598.6 | 756 | 721 | 215.5 |
| D | 10 | 172 | 984973 | 4566.31 | 756 | 721 | 215.5 |
| D | 3 | 12 | 512885 | 2376.12 | 756 | 721 | 215.5 |
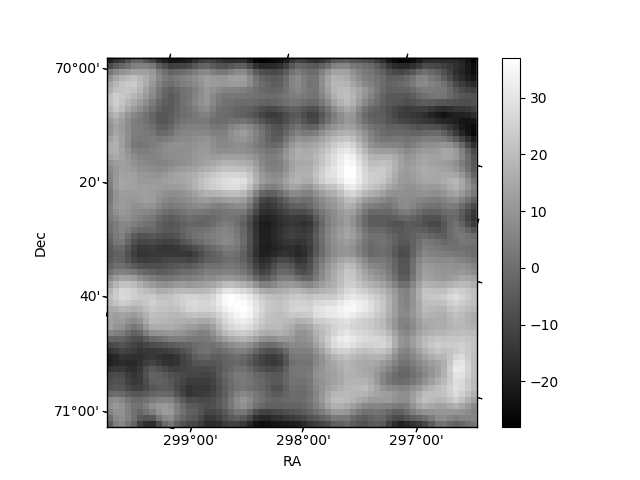
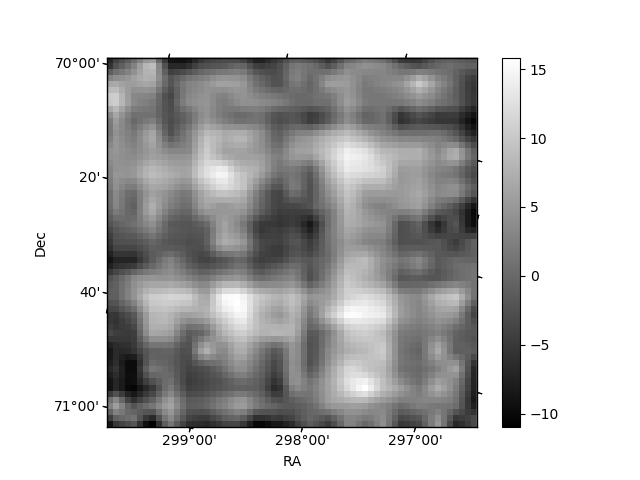
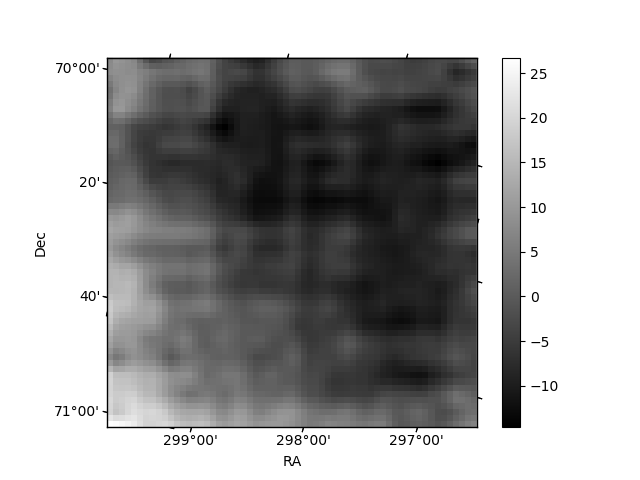
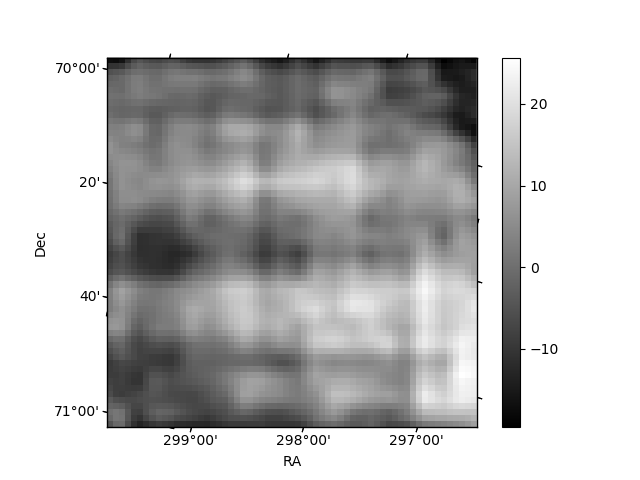
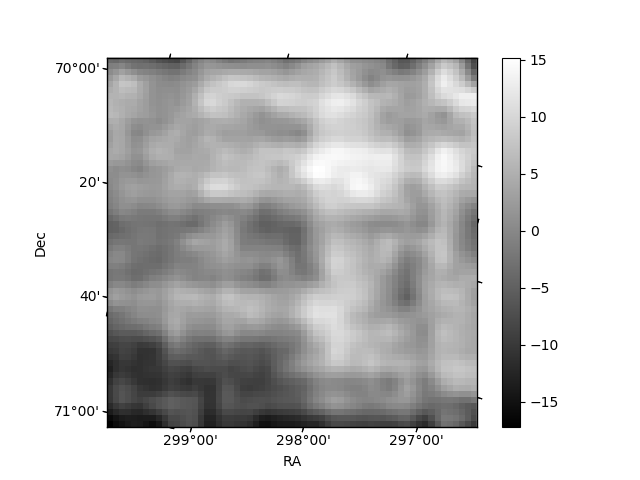
Histogram calculated using DETX and DETY for each event in the final _common_clean file
| Quadrant A | 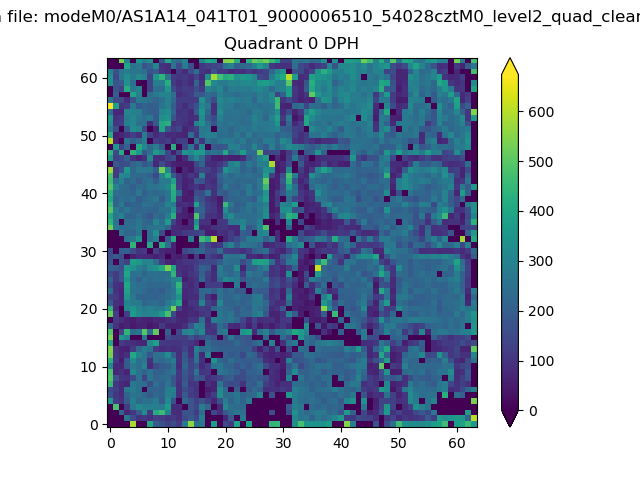 |
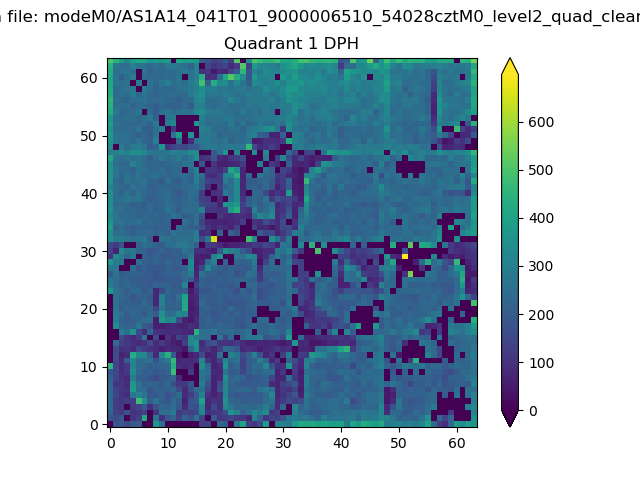 |
Quadrant B |
|---|---|---|---|
| Quadrant D | 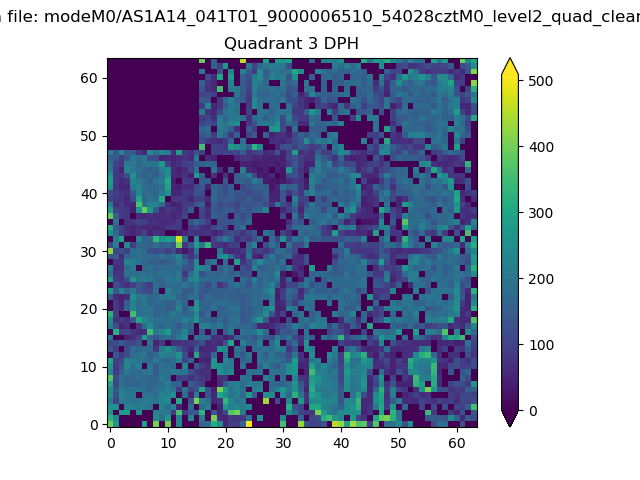 |
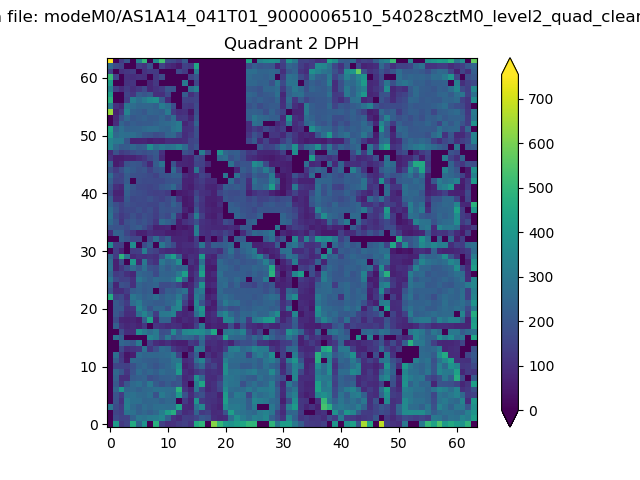 |
Quadrant C |
| Plot type | Count rate plots | Images |
|---|---|---|
| Comparison with Poisson distribution Blue bars denote a histogram of data divided into 1 sec bins. Red curve is a Poisson curve with rate = median count rate of data. |
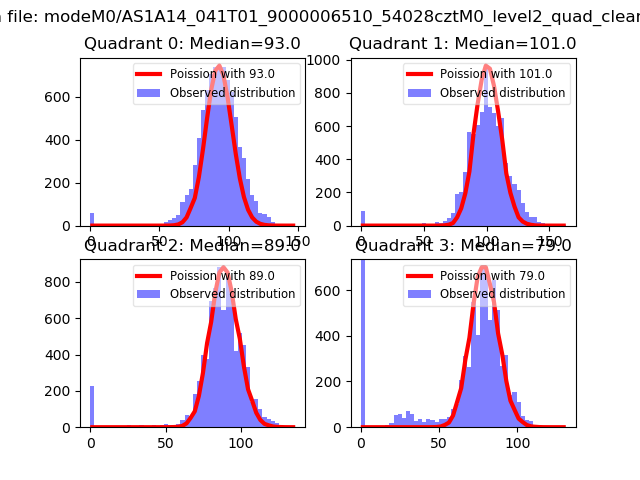 |
 |
| Quadrant-wise count rates Data is divided into 100 sec bins |
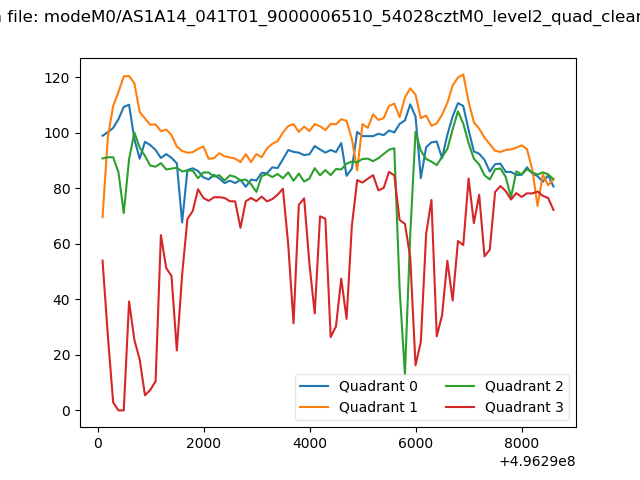 |
|
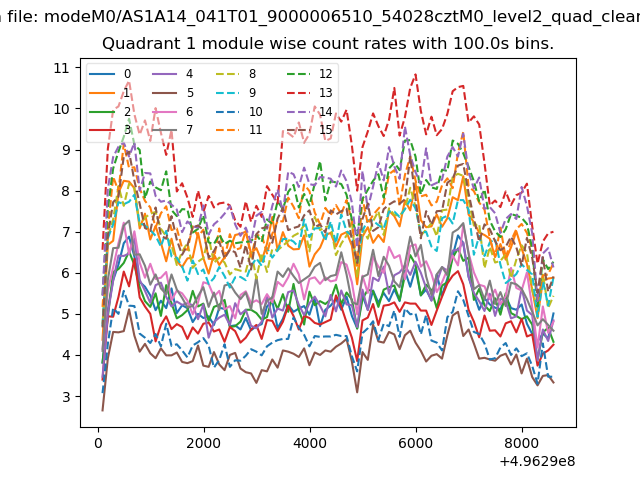
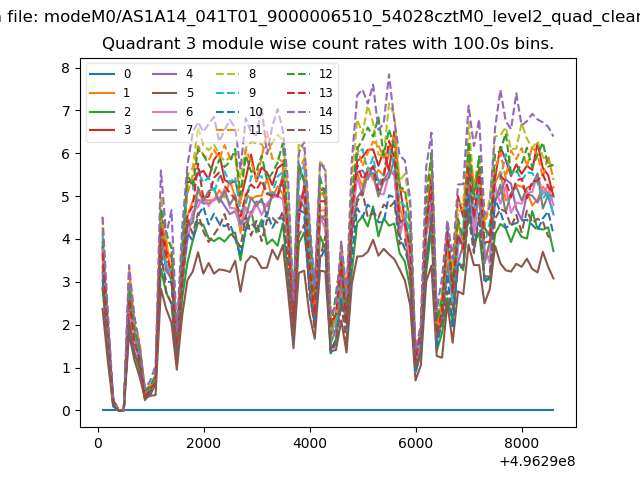
| Module-wise count rates for Quadrant A Data is divided into 100 sec bins |
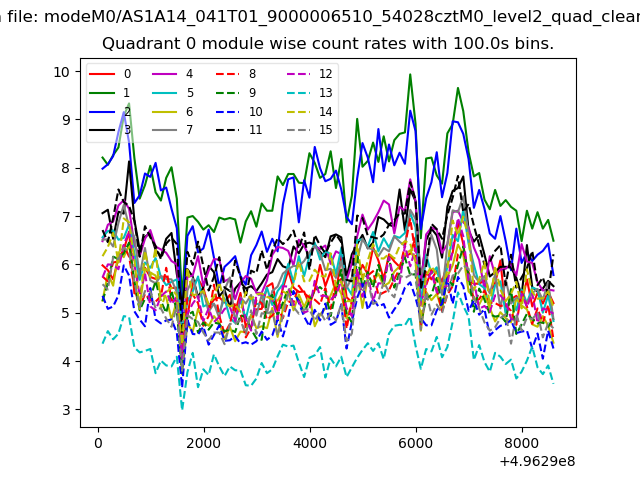 |
 |
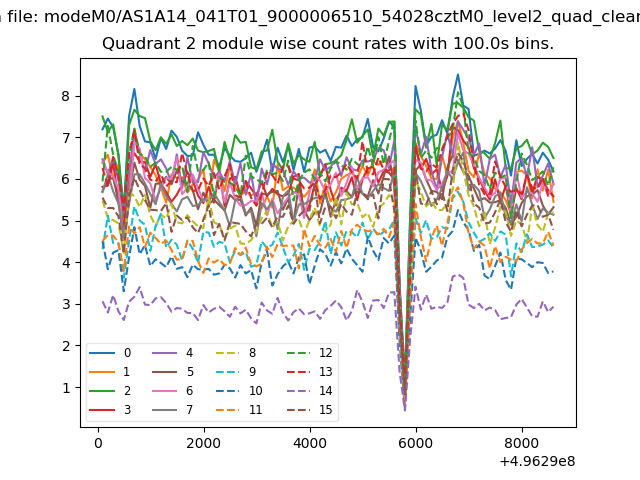
| Module-wise count rates for Quadrant B Data is divided into 100 sec bins |
 |
 |
| Module-wise count rates for Quadrant C Data is divided into 100 sec bins |
 |
 |
| Module-wise count rates for Quadrant D Data is divided into 100 sec bins |
 |
 |
| Parameter | Plot |
|---|---|
| CZT HV Monitor | 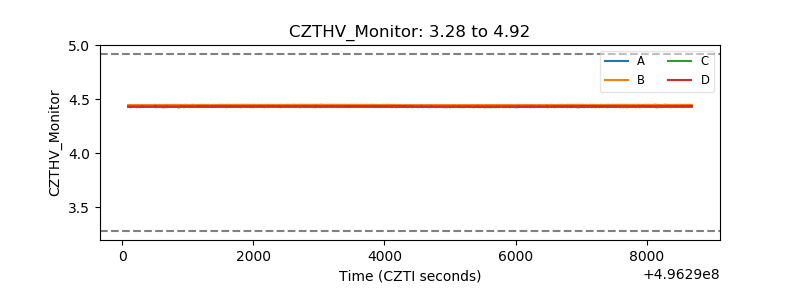 |
| D_VDD | 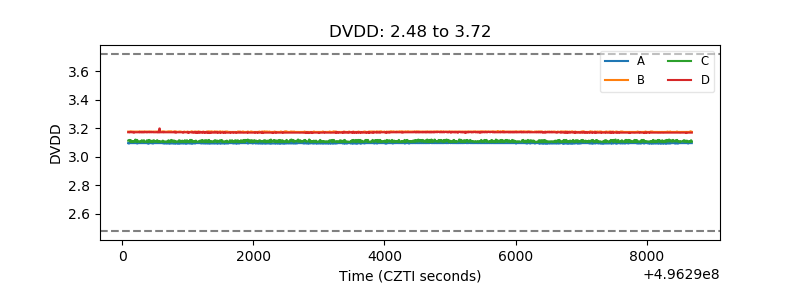 |
| Temperature 1 | 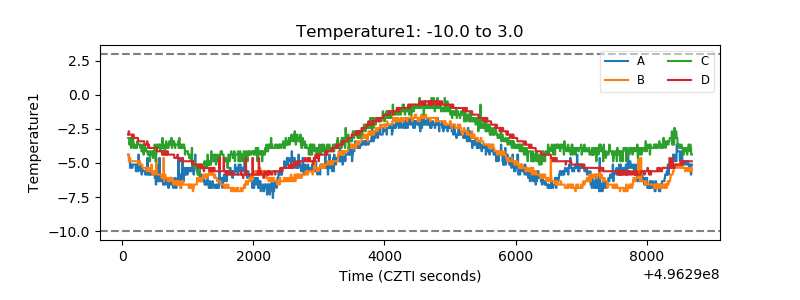 |
| Veto HV Monitor | 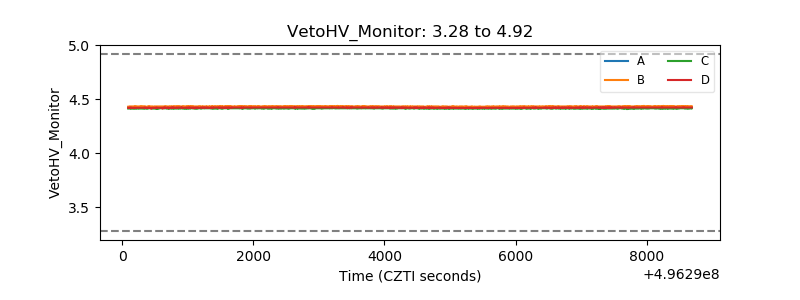 |
| Veto LLD | 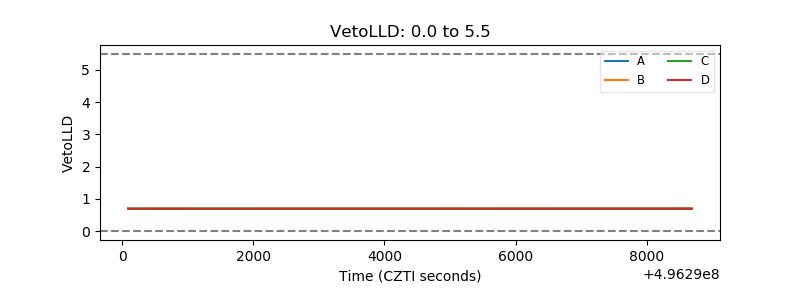 |
| Alpha Counter | 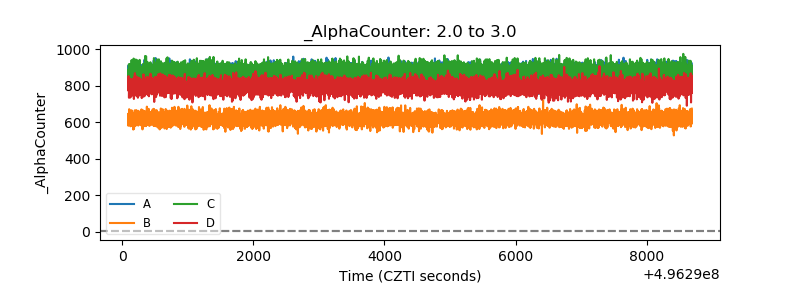 |
| _CPM_Rate | 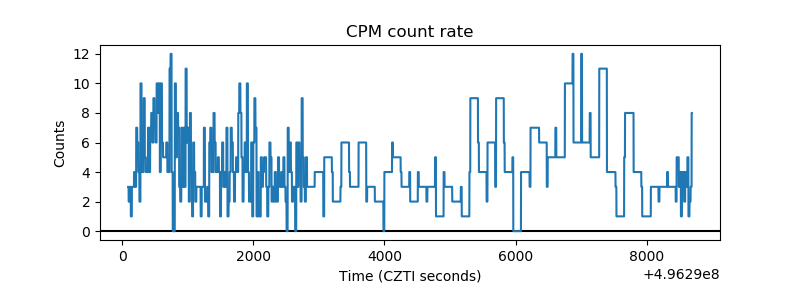 |
| CZT Counter | 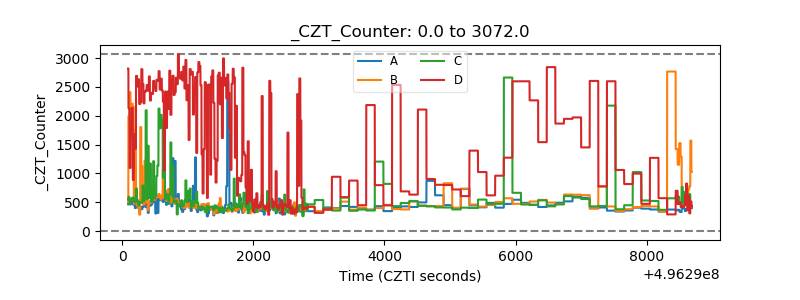 |
| +2.5 Volts monitor |  |
| +5 Volts monitor |  |
| _ROLL_ROT | 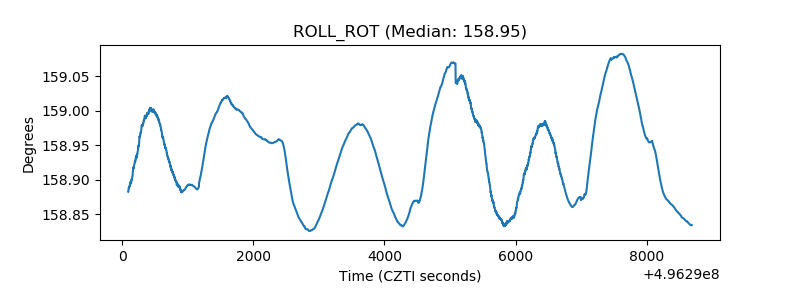 |
| _Roll_DEC | 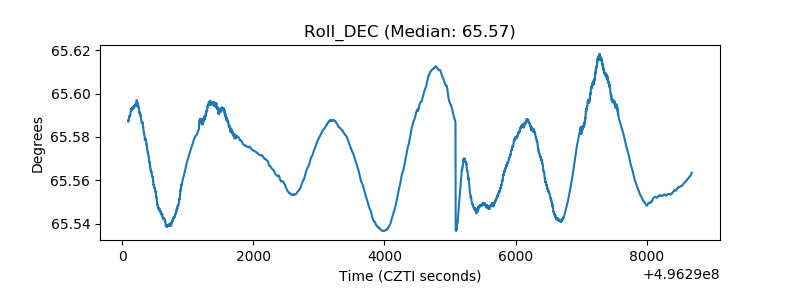 |
| _Roll_RA | 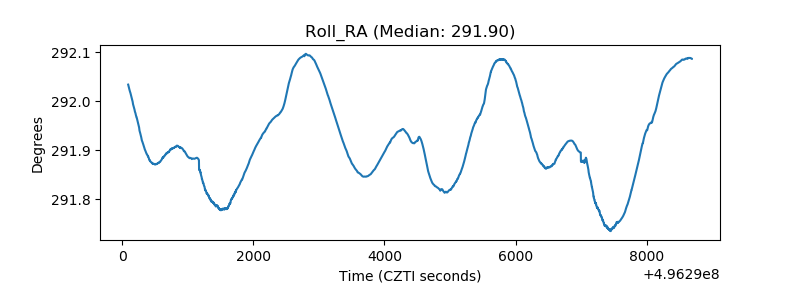 |
| Veto Counter | 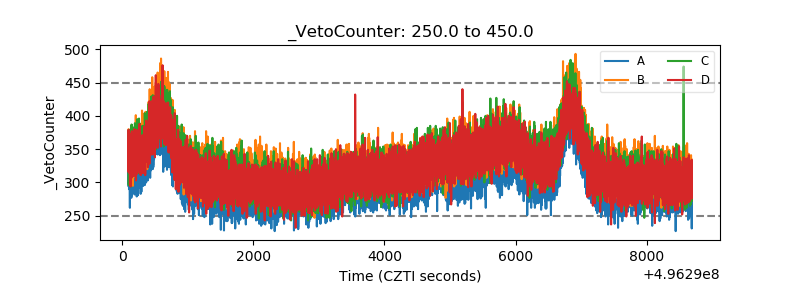 |