| Param | Original file | Final file |
|---|---|---|
| Filename | modeM0/AS1A14_041T01_9000006510_54037cztM0_level2.fits | modeM0/AS1A14_041T01_9000006510_54037cztM0_level2_quad_clean.evt |
| Size (bytes) | 580,132,800 | 83,986,560 |
| Size | 553.3 MB | 80.1 MB |
| Events in quadrant A | 2,962,781 | 619,170 |
| Events in quadrant B | 3,322,743 | 667,573 |
| Events in quadrant C | 3,322,983 | 584,534 |
| Events in quadrant D | 11,389,593 | 244,355 |
| Mode M9 | |||
|---|---|---|---|
| Quadrant | BADHDUFLAG | Total packets | Discarded packets |
| A | 0 | 12 | 0 |
| B | 0 | 12 | 0 |
| C | 0 | 12 | 0 |
| D | 0 | 12 | 0 |
| Mode SS | |||
|---|---|---|---|
| Quadrant | BADHDUFLAG | Total packets | Discarded packets |
| A | 0 | 124 | 0 |
| B | 0 | 124 | 0 |
| C | 0 | 124 | 0 |
| D | 0 | 124 | 0 |
| Mode M0 | |||
|---|---|---|---|
| Quadrant | BADHDUFLAG | Total packets | Discarded packets |
| A | 0 | 13317 | 1 |
| B | 0 | 14009 | 1 |
| C | 0 | 14264 | 1 |
| D | 0 | 38067 | 2 |
| Quadrant | Total seconds | Saturated seconds | Saturation percentage |
|---|---|---|---|
| A | 6123 | 52 | 0.849257% |
| B | 6124 | 100 | 1.632920% |
| C | 6124 | 140 | 2.286088% |
| D | 6123 | 3590 | 58.631390% |
Noise dominated data is calculated using 1-second bins in cleaned event files. If a bin has >2000 counts, and if more than 50% of those come from <1% of pixels, then it is considered to be noise-dominated and hence unusable.
| Quadrant | # 1 sec bins | Bins with >0 counts | Bins with >2000 counts | High rate bins dominated by noise | Noise dominated (total time) | Noise dominated (detector-on time) | Marked lightcurve |
|---|---|---|---|---|---|---|---|
| A | 7353 | 6124 | 42 | 42 | 0.57% | 0.69% | 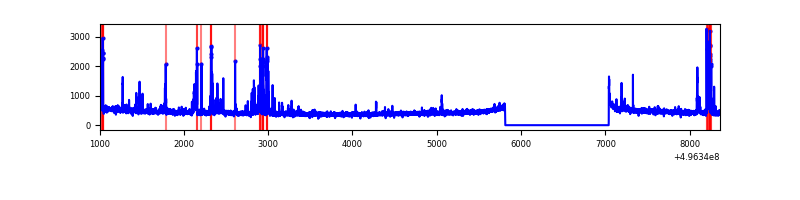 |
| B | 7354 | 6125 | 50 | 50 | 0.68% | 0.82% | 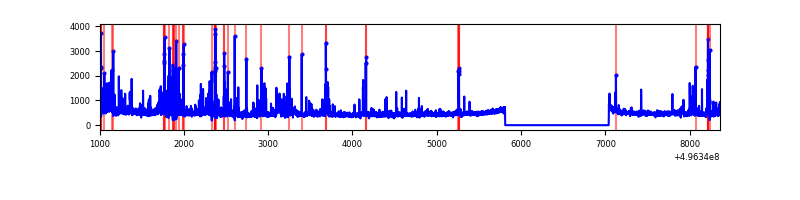 |
| C | 7354 | 6125 | 98 | 98 | 1.33% | 1.60% | 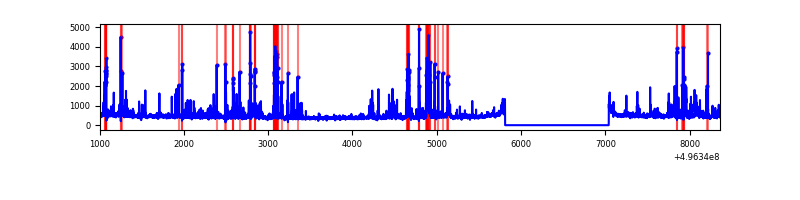 |
| D | 7352 | 6123 | 3278 | 3278 | 44.59% | 53.54% | 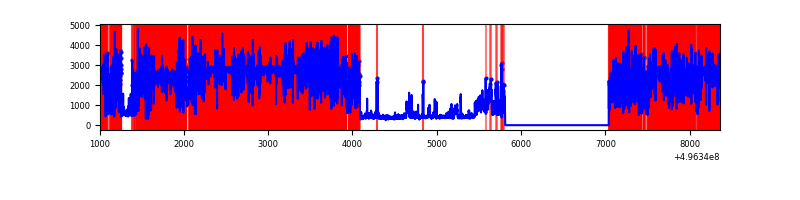 |
Top three noisy pixels from each quadrant. If the there are fewer than three noisy pixels in the level2.evt file, extra rows are filled as -1
| Pixel properties | Quadrant properties | ||||||
|---|---|---|---|---|---|---|---|
| Quadrant | DetID | PixID | Counts | Sigma | Mean | Median | Sigma |
| A | 15 | 174 | 215444 | 1320.53 | 654 | 637 | 162.7 |
| A | 0 | 8 | 97718 | 596.81 | 654 | 637 | 162.7 |
| A | 3 | 45 | 26117 | 156.64 | 654 | 637 | 162.7 |
| B | 5 | 236 | 203773 | 1470.64 | 650 | 630 | 138.1 |
| B | 4 | 171 | 144003 | 1037.94 | 650 | 630 | 138.1 |
| B | 0 | 213 | 89488 | 643.28 | 650 | 630 | 138.1 |
| C | 13 | 3 | 393279 | 2223.13 | 644 | 636 | 176.6 |
| C | 4 | 5 | 136390 | 768.63 | 644 | 636 | 176.6 |
| C | 3 | 233 | 77083 | 432.84 | 644 | 636 | 176.6 |
| D | 8 | 176 | 9110640 | 77069.97 | 412 | 392 | 118.2 |
| D | 2 | 165 | 351973 | 2974.27 | 412 | 392 | 118.2 |
| D | 3 | 12 | 78745 | 662.84 | 412 | 392 | 118.2 |
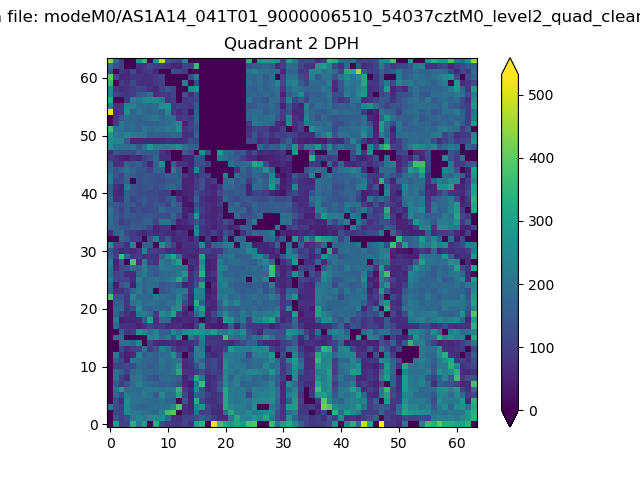
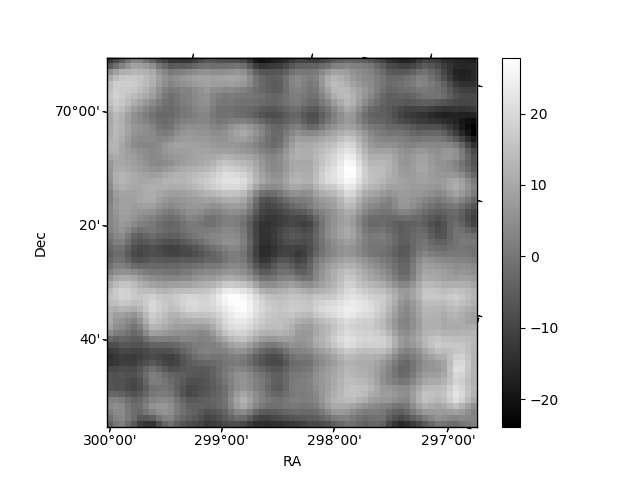
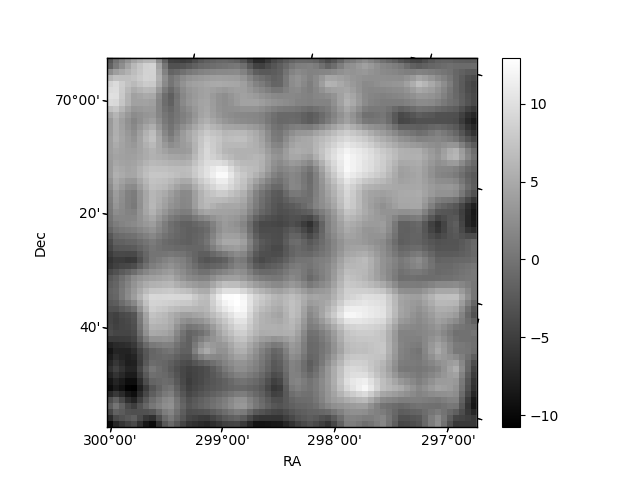
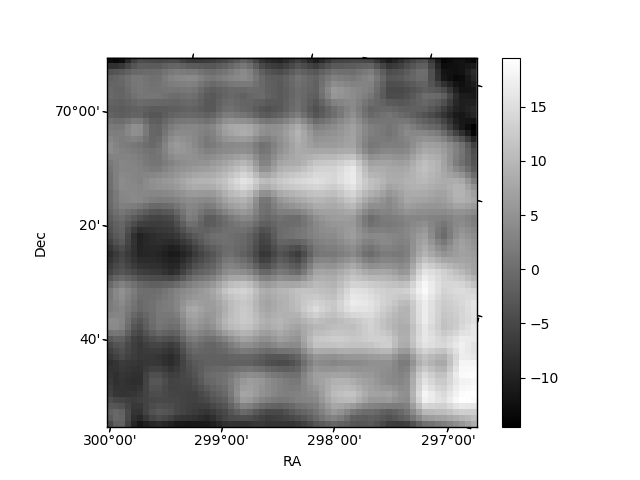
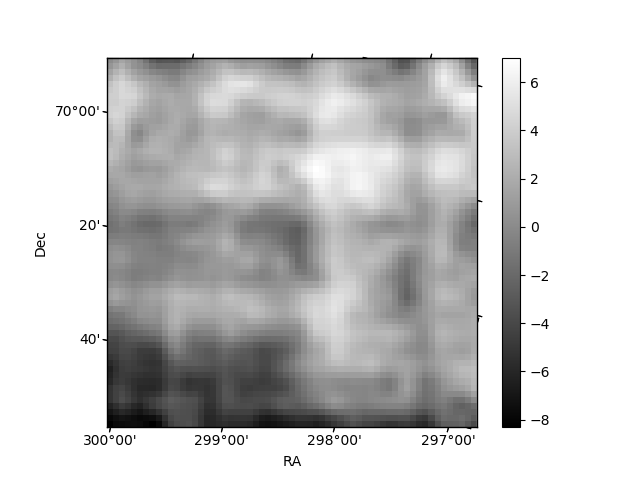
Histogram calculated using DETX and DETY for each event in the final _common_clean file
| Quadrant A | 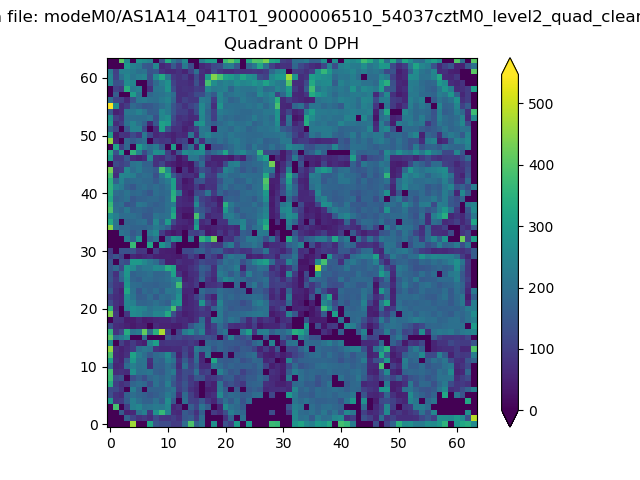 |
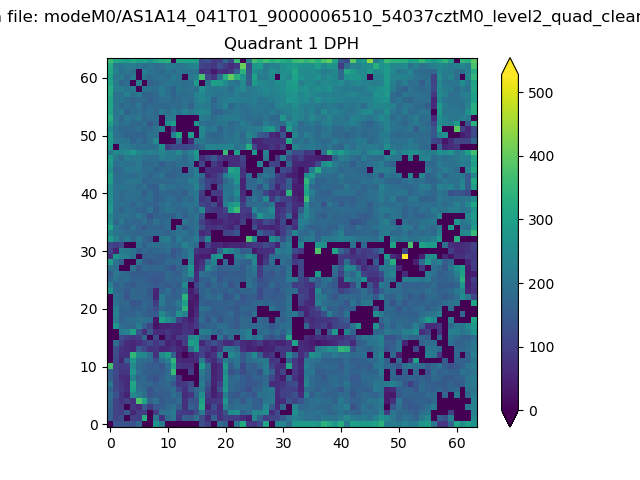 |
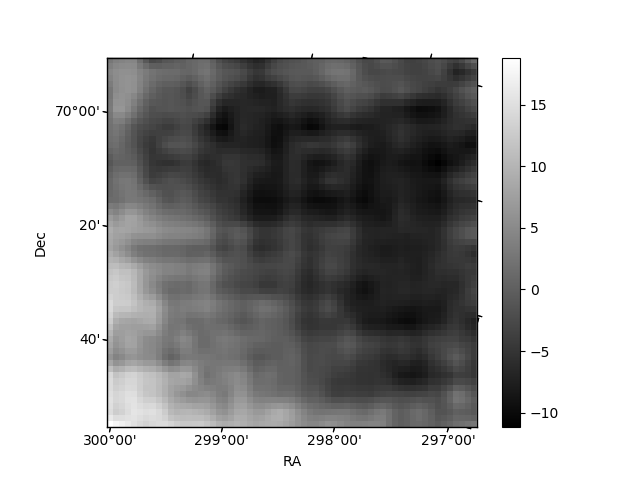
Quadrant B |
|---|---|---|---|
| Quadrant D | 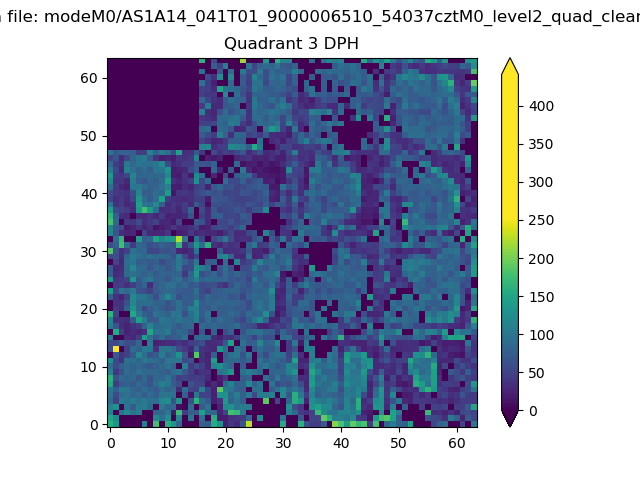 |
 |
Quadrant C |
| Plot type | Count rate plots | Images |
|---|---|---|
| Comparison with Poisson distribution Blue bars denote a histogram of data divided into 1 sec bins. Red curve is a Poisson curve with rate = median count rate of data. |
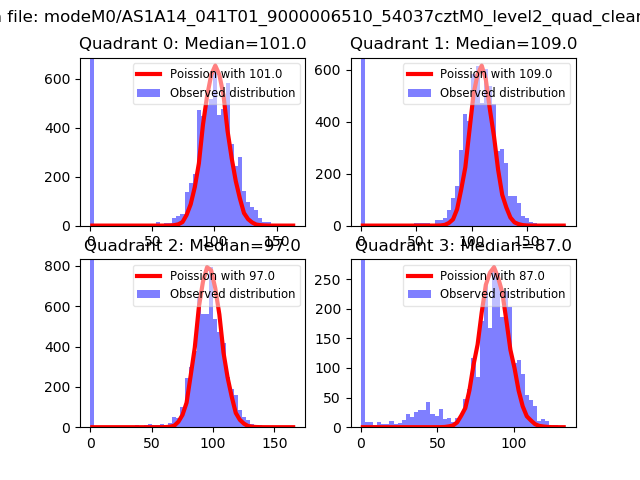 |
 |
| Quadrant-wise count rates Data is divided into 100 sec bins |
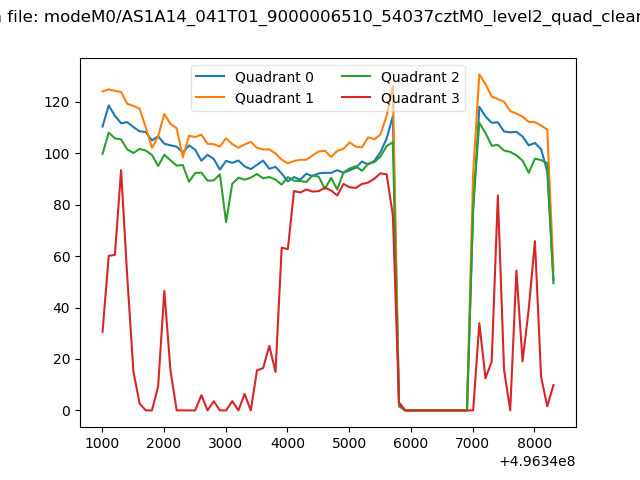 |
|
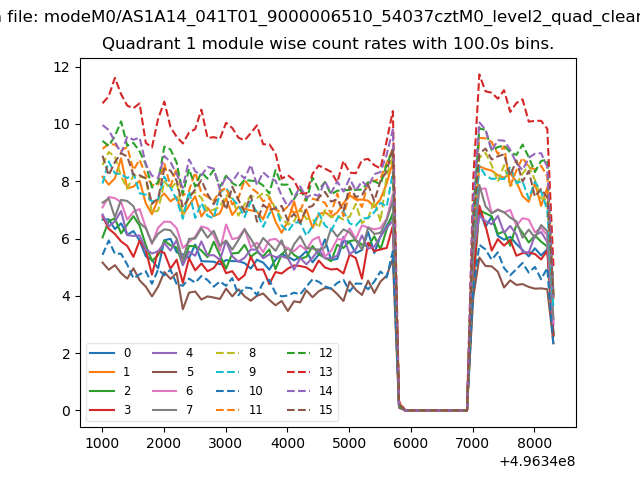
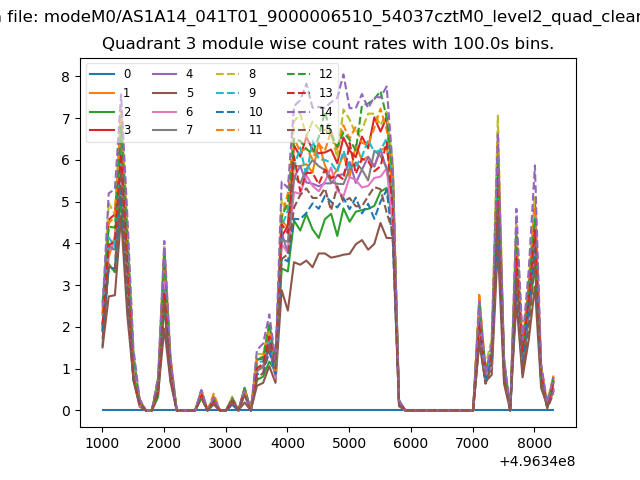
| Module-wise count rates for Quadrant A Data is divided into 100 sec bins |
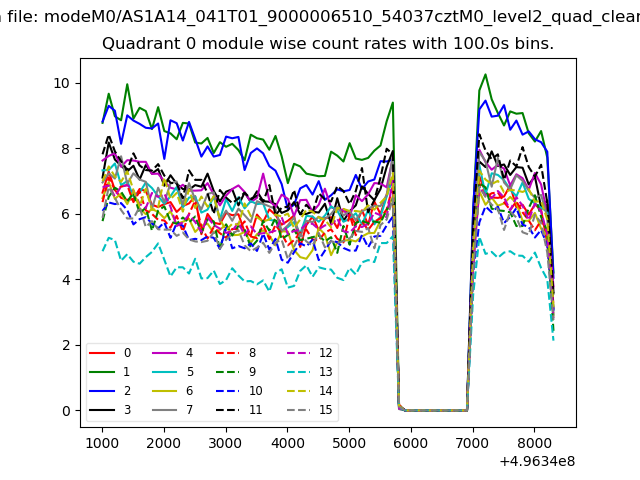 |
 |
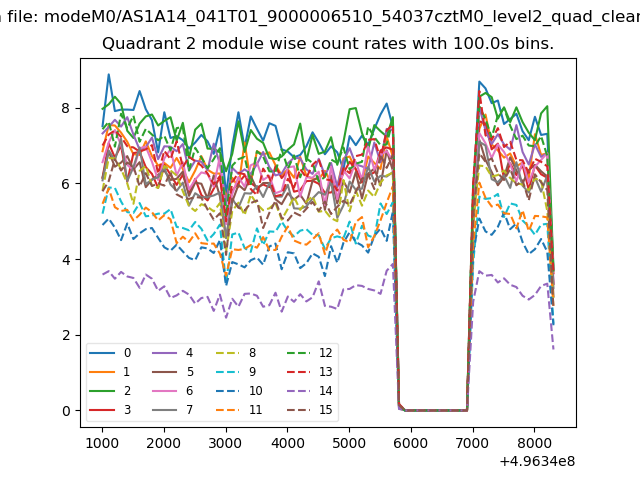
| Module-wise count rates for Quadrant B Data is divided into 100 sec bins |
 |
 |
| Module-wise count rates for Quadrant C Data is divided into 100 sec bins |
 |
 |
| Module-wise count rates for Quadrant D Data is divided into 100 sec bins |
 |
 |
| Parameter | Plot |
|---|---|
| CZT HV Monitor | 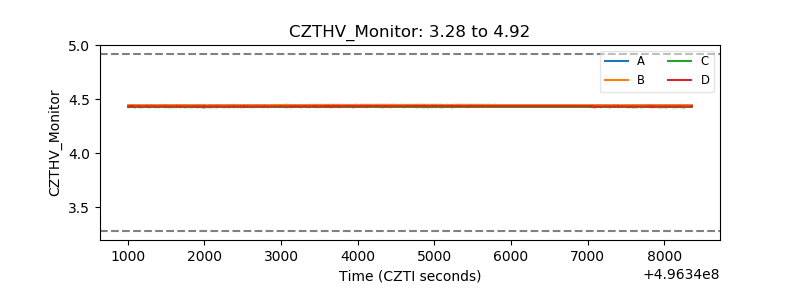 |
| D_VDD | 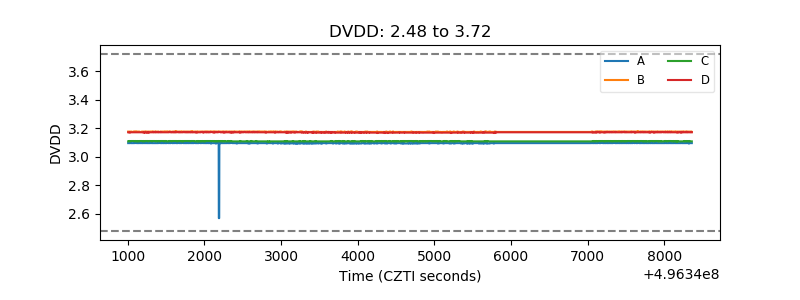 |
| Temperature 1 | 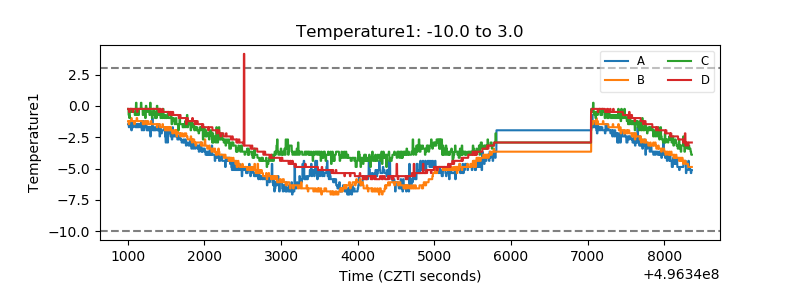 |
| Veto HV Monitor | 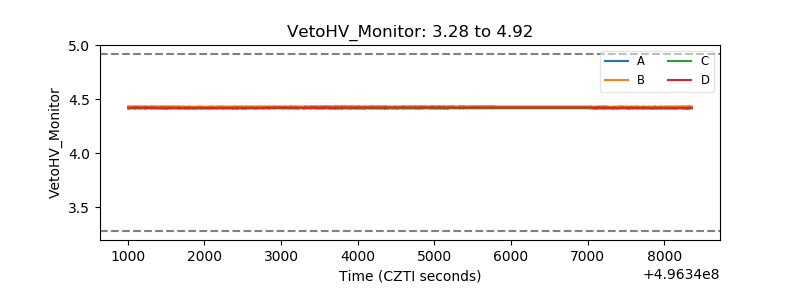 |
| Veto LLD | 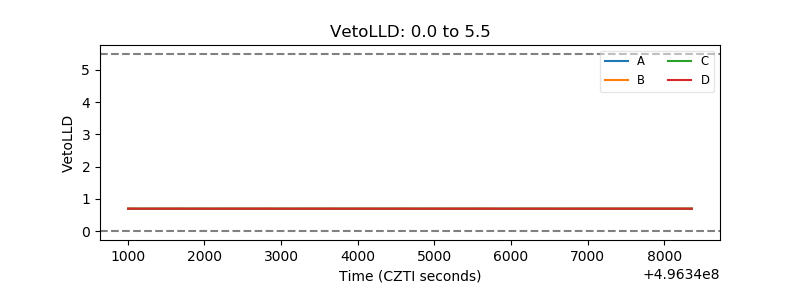 |
| Alpha Counter | 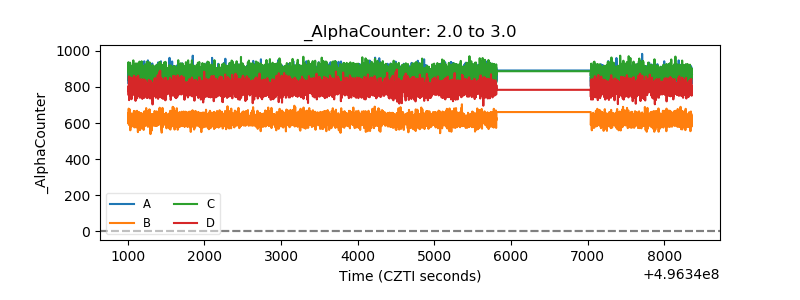 |
| _CPM_Rate | 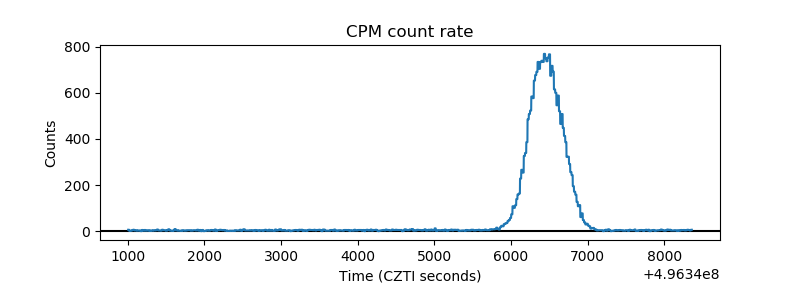 |
| CZT Counter | 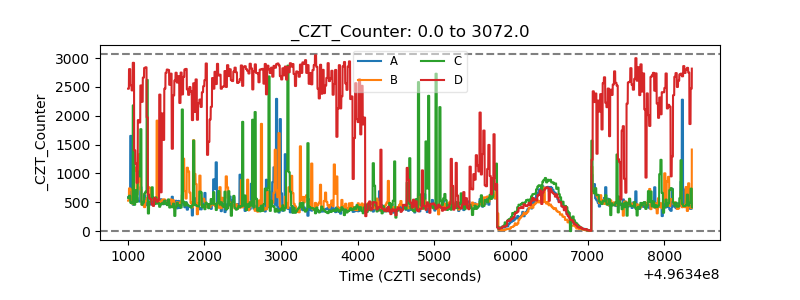 |
| +2.5 Volts monitor |  |
| +5 Volts monitor |  |
| _ROLL_ROT | 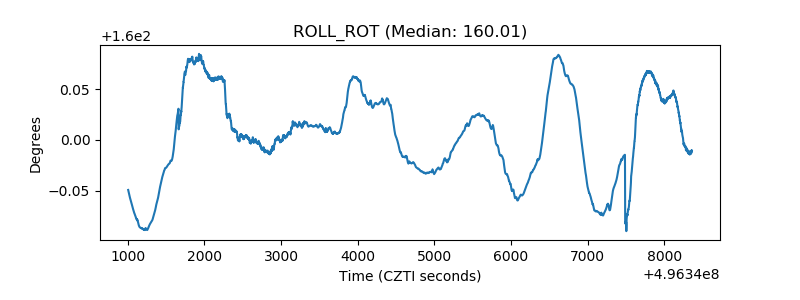 |
| _Roll_DEC | 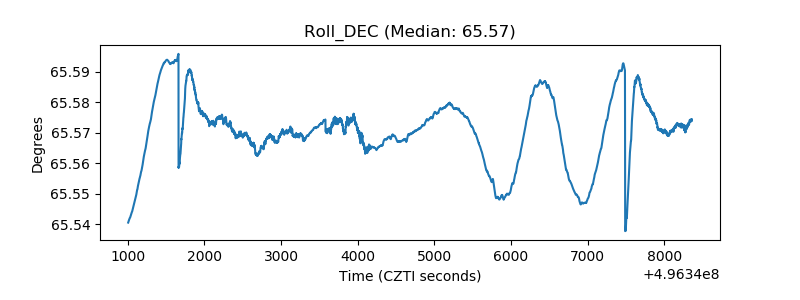 |
| _Roll_RA | 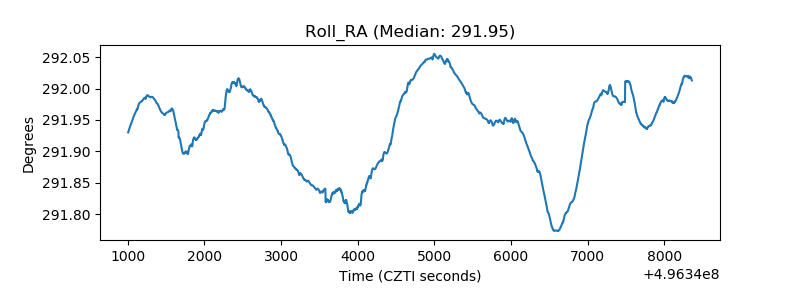 |
| Veto Counter | 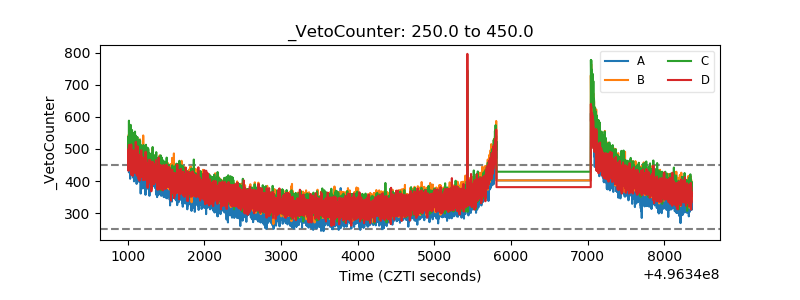 |