| Param | Original file | Final file |
|---|---|---|
| Filename | modeM0/AS1A14_041T01_9000006510_54038cztM0_level2.fits | modeM0/AS1A14_041T01_9000006510_54038cztM0_level2_quad_clean.evt |
| Size (bytes) | 605,543,040 | 88,868,160 |
| Size | 577.5 MB | 84.8 MB |
| Events in quadrant A | 3,324,775 | 629,586 |
| Events in quadrant B | 3,516,209 | 690,811 |
| Events in quadrant C | 4,004,413 | 597,393 |
| Events in quadrant D | 11,066,508 | 321,137 |
| Mode M9 | |||
|---|---|---|---|
| Quadrant | BADHDUFLAG | Total packets | Discarded packets |
| A | 0 | 12 | 0 |
| B | 0 | 13 | 0 |
| C | 0 | 13 | 0 |
| D | 0 | 13 | 0 |
| Mode SS | |||
|---|---|---|---|
| Quadrant | BADHDUFLAG | Total packets | Discarded packets |
| A | 0 | 132 | 0 |
| B | 0 | 132 | 0 |
| C | 0 | 132 | 0 |
| D | 0 | 132 | 0 |
| Mode M0 | |||
|---|---|---|---|
| Quadrant | BADHDUFLAG | Total packets | Discarded packets |
| A | 0 | 14838 | 2 |
| B | 0 | 15171 | 2 |
| C | 0 | 16500 | 2 |
| D | 0 | 37466 | 5 |
| Quadrant | Total seconds | Saturated seconds | Saturation percentage |
|---|---|---|---|
| A | 6476 | 189 | 2.918468% |
| B | 6476 | 178 | 2.748610% |
| C | 6476 | 306 | 4.725139% |
| D | 6475 | 3044 | 47.011583% |
Noise dominated data is calculated using 1-second bins in cleaned event files. If a bin has >2000 counts, and if more than 50% of those come from <1% of pixels, then it is considered to be noise-dominated and hence unusable.
| Quadrant | # 1 sec bins | Bins with >0 counts | Bins with >2000 counts | High rate bins dominated by noise | Noise dominated (total time) | Noise dominated (detector-on time) | Marked lightcurve |
|---|---|---|---|---|---|---|---|
| A | 7621 | 6477 | 150 | 150 | 1.97% | 2.32% | 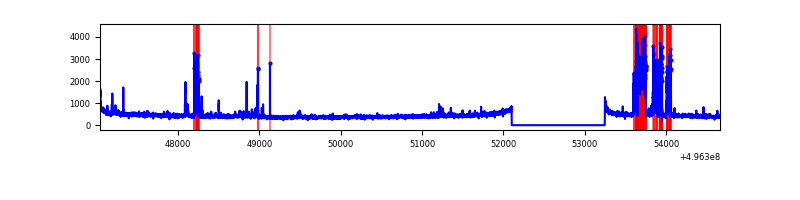 |
| B | 7621 | 6477 | 95 | 95 | 1.25% | 1.47% | 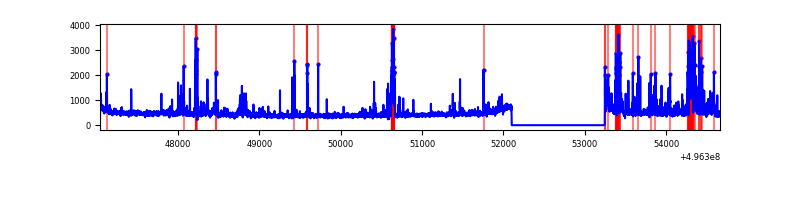 |
| C | 7621 | 6477 | 250 | 250 | 3.28% | 3.86% | 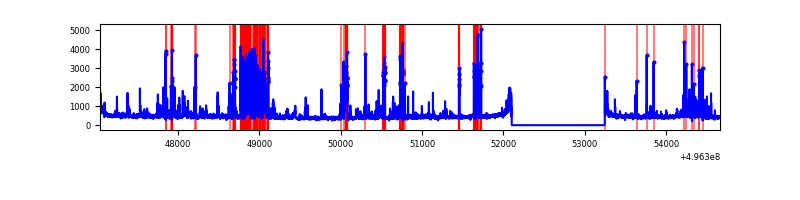 |
| D | 7620 | 6476 | 2806 | 2806 | 36.82% | 43.33% | 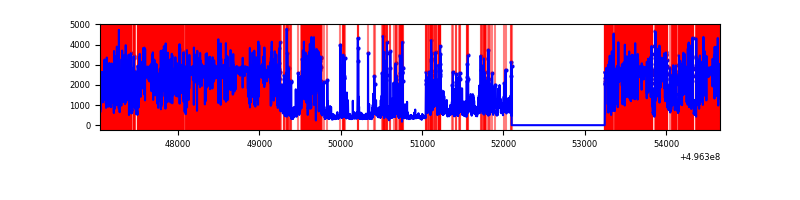 |
Top three noisy pixels from each quadrant. If the there are fewer than three noisy pixels in the level2.evt file, extra rows are filled as -1
| Pixel properties | Quadrant properties | ||||||
|---|---|---|---|---|---|---|---|
| Quadrant | DetID | PixID | Counts | Sigma | Mean | Median | Sigma |
| A | 15 | 174 | 491320 | 2878.22 | 680 | 661 | 170.5 |
| A | 0 | 8 | 81612 | 474.86 | 680 | 661 | 170.5 |
| A | 4 | 3 | 24787 | 141.52 | 680 | 661 | 170.5 |
| B | 5 | 185 | 235058 | 1596.01 | 686 | 663 | 146.9 |
| B | 5 | 236 | 177989 | 1207.42 | 686 | 663 | 146.9 |
| B | 0 | 213 | 154803 | 1049.55 | 686 | 663 | 146.9 |
| C | 4 | 5 | 957234 | 5251.55 | 670 | 665 | 182.1 |
| C | 13 | 3 | 148059 | 809.19 | 670 | 665 | 182.1 |
| C | 1 | 16 | 79349 | 431.97 | 670 | 665 | 182.1 |
| D | 8 | 176 | 7850884 | 55591.53 | 491 | 468 | 141.2 |
| D | 2 | 165 | 504560 | 3569.65 | 491 | 468 | 141.2 |
| D | 14 | 20 | 162510 | 1147.48 | 491 | 468 | 141.2 |
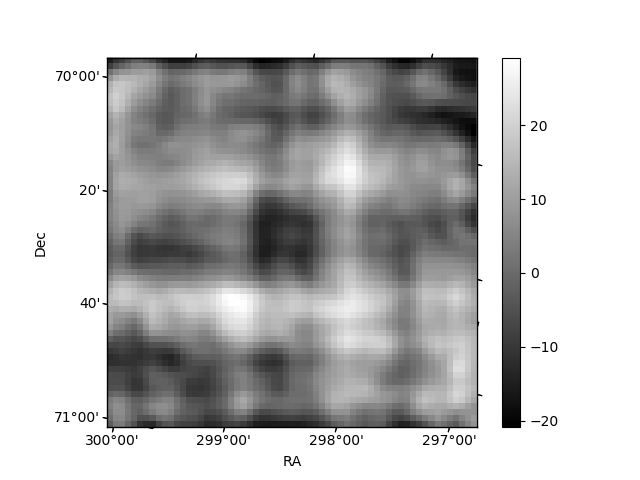
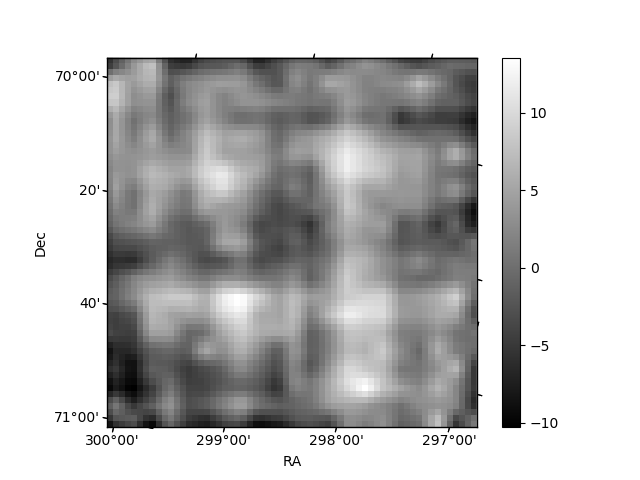
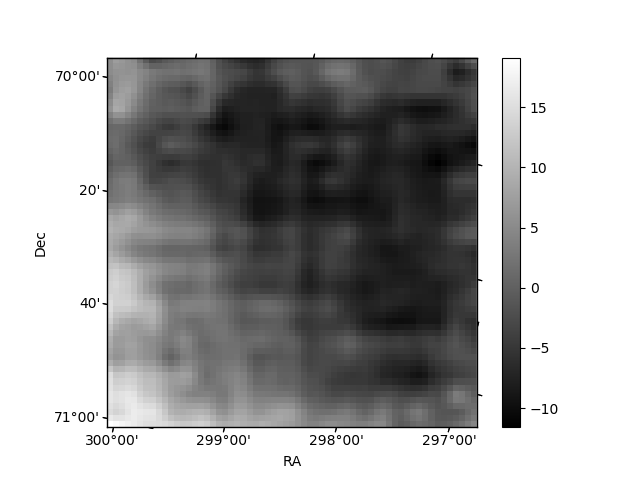
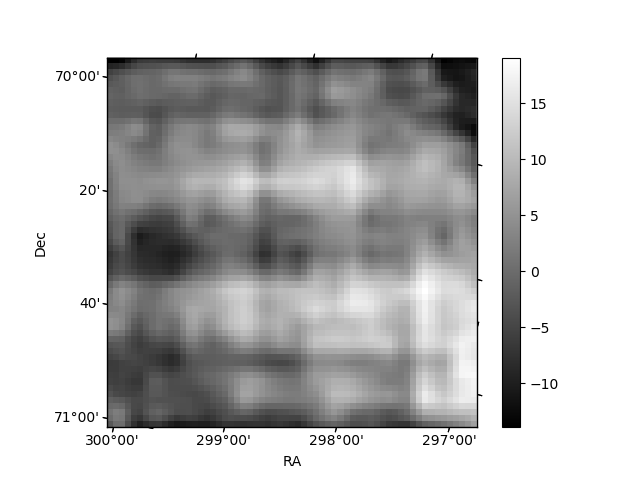
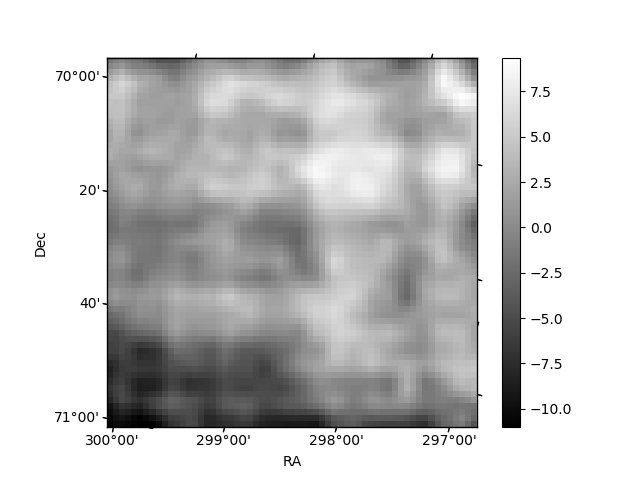
Histogram calculated using DETX and DETY for each event in the final _common_clean file
| Quadrant A | 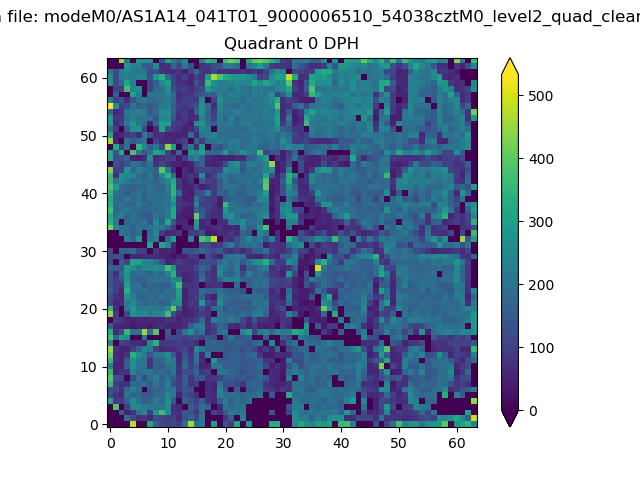 |
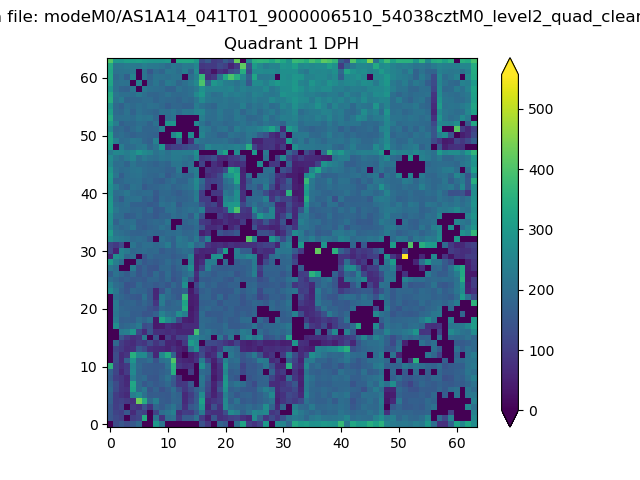 |
Quadrant B |
|---|---|---|---|
| Quadrant D | 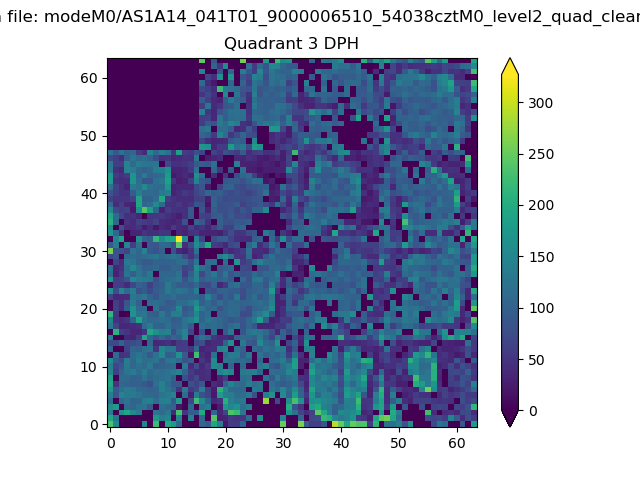 |
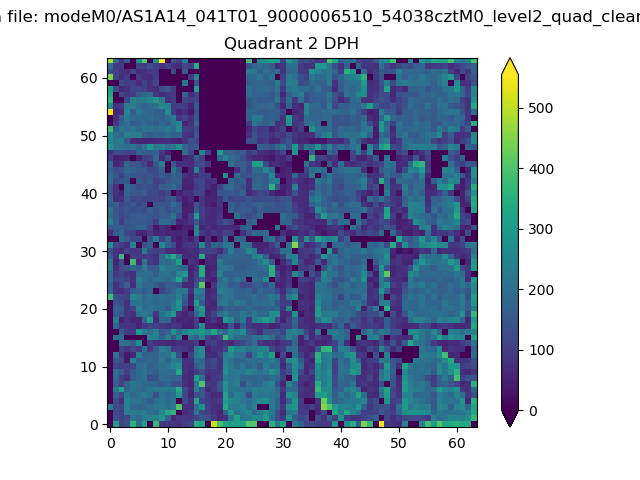 |
Quadrant C |
| Plot type | Count rate plots | Images |
|---|---|---|
| Comparison with Poisson distribution Blue bars denote a histogram of data divided into 1 sec bins. Red curve is a Poisson curve with rate = median count rate of data. |
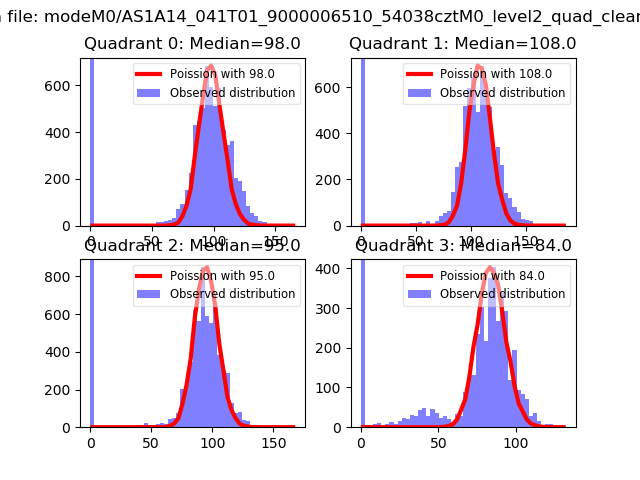 |
 |
| Quadrant-wise count rates Data is divided into 100 sec bins |
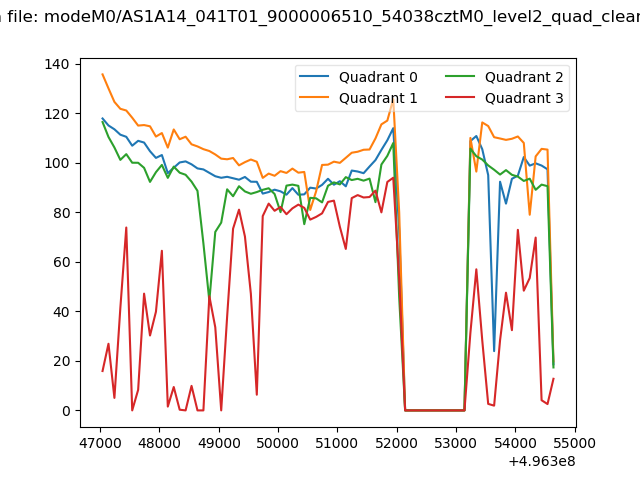 |
|
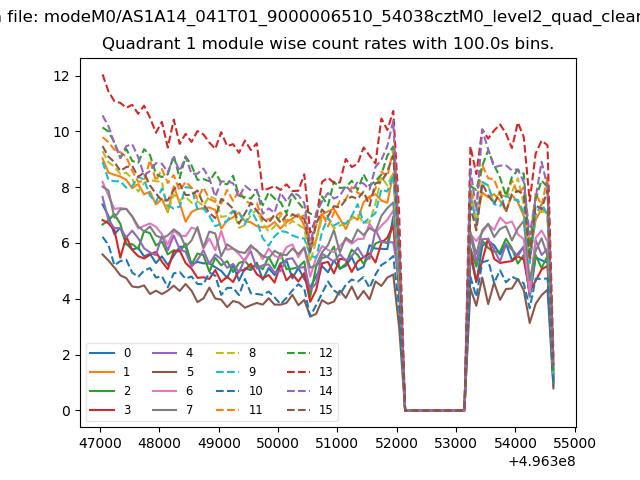
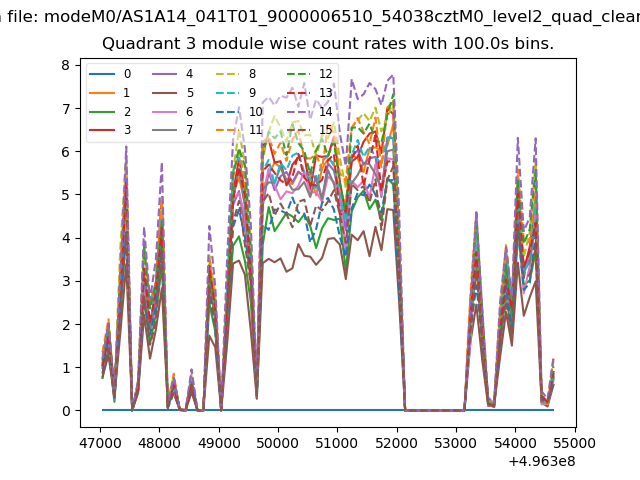
| Module-wise count rates for Quadrant A Data is divided into 100 sec bins |
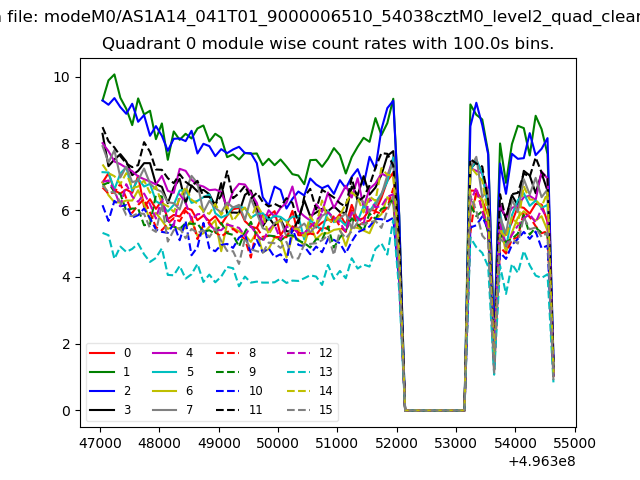 |
 |
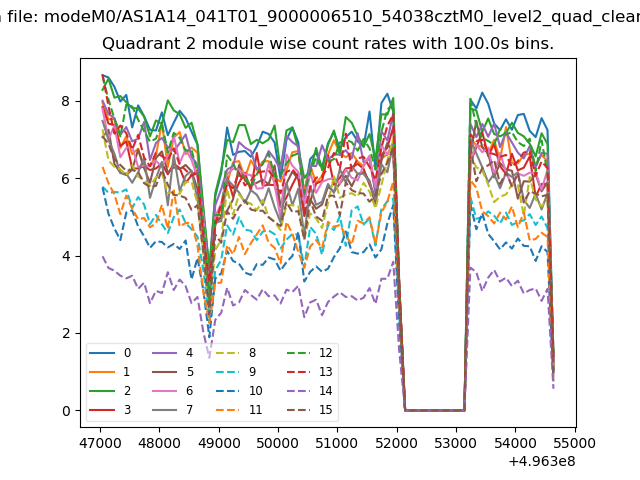
| Module-wise count rates for Quadrant B Data is divided into 100 sec bins |
 |
 |
| Module-wise count rates for Quadrant C Data is divided into 100 sec bins |
 |
 |
| Module-wise count rates for Quadrant D Data is divided into 100 sec bins |
 |
 |
| Parameter | Plot |
|---|---|
| CZT HV Monitor | 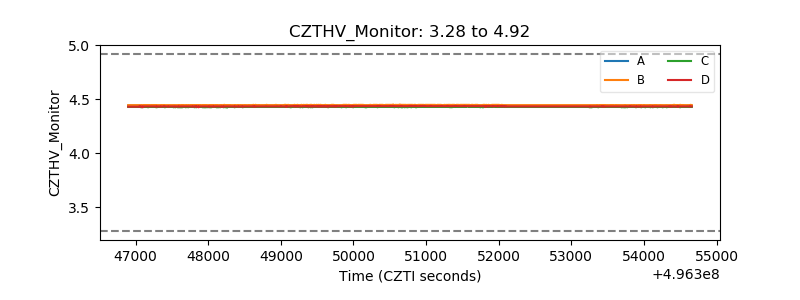 |
| D_VDD | 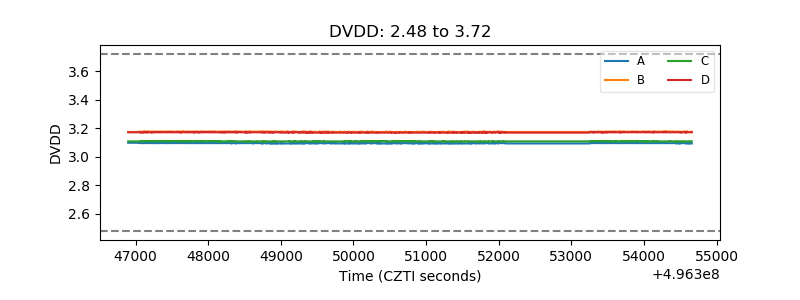 |
| Temperature 1 | 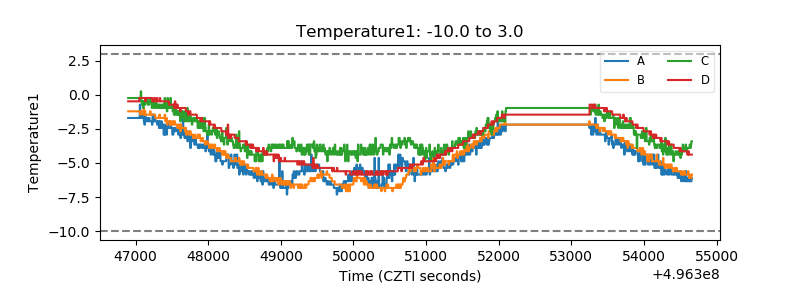 |
| Veto HV Monitor | 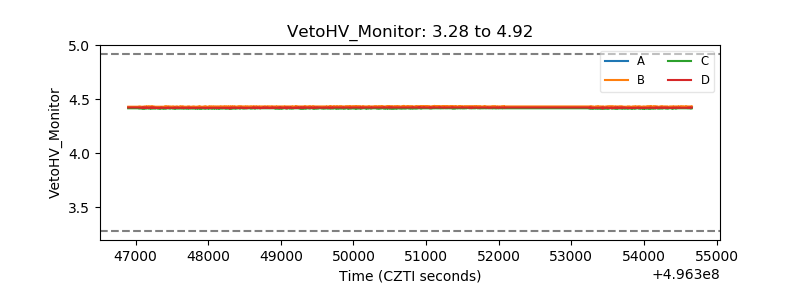 |
| Veto LLD | 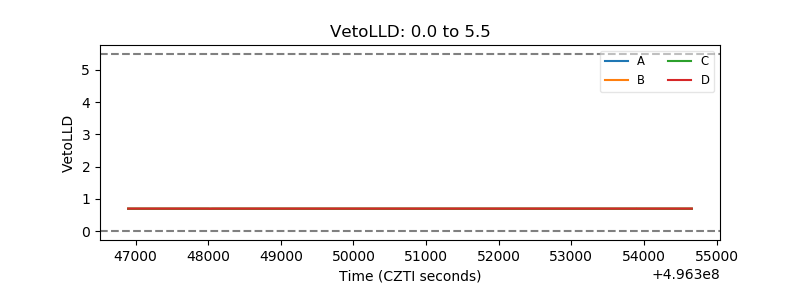 |
| Alpha Counter | 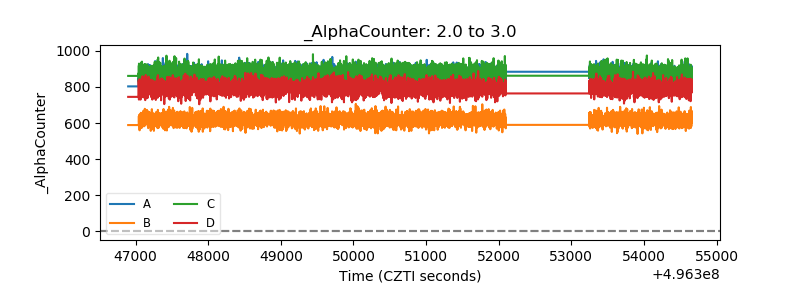 |
| _CPM_Rate | 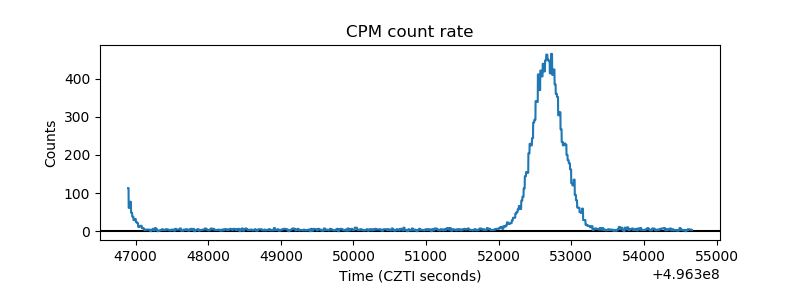 |
| CZT Counter | 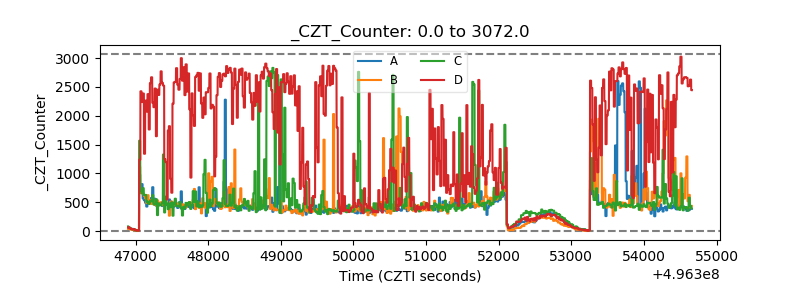 |
| +2.5 Volts monitor |  |
| +5 Volts monitor |  |
| _ROLL_ROT |  |
| _Roll_DEC | 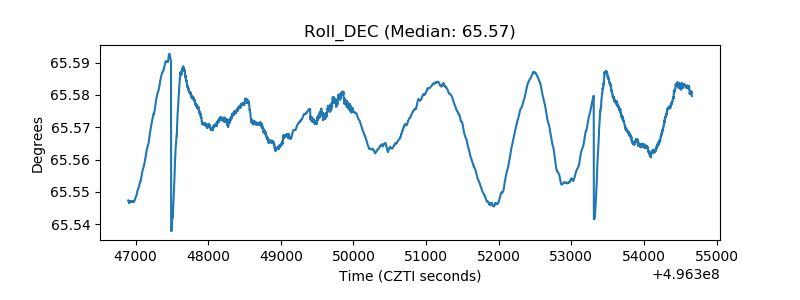 |
| _Roll_RA | 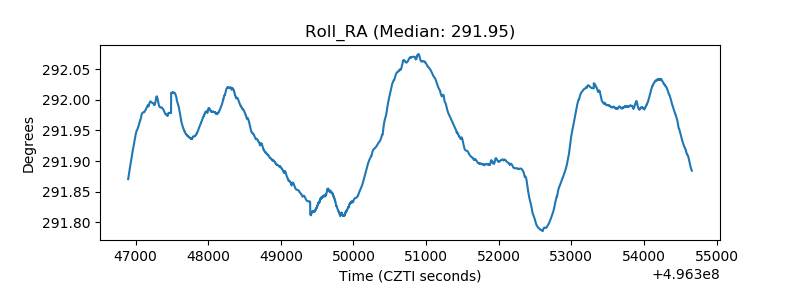 |
| Veto Counter | 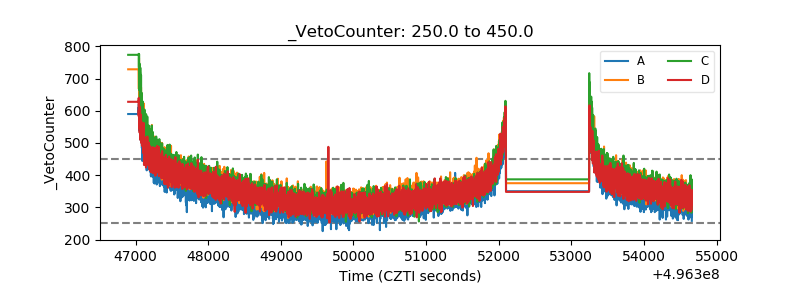 |