| Param | Original file | Final file |
|---|---|---|
| Filename | modeM0/AS1A14_041T01_9000006510_54039cztM0_level2.fits | modeM0/AS1A14_041T01_9000006510_54039cztM0_level2_quad_clean.evt |
| Size (bytes) | 628,104,960 | 89,556,480 |
| Size | 599.0 MB | 85.4 MB |
| Events in quadrant A | 4,439,827 | 610,837 |
| Events in quadrant B | 3,540,918 | 701,363 |
| Events in quadrant C | 4,035,919 | 600,359 |
| Events in quadrant D | 10,708,851 | 328,141 |
| Mode M9 | |||
|---|---|---|---|
| Quadrant | BADHDUFLAG | Total packets | Discarded packets |
| A | 0 | 14 | 0 |
| B | 0 | 15 | 0 |
| C | 0 | 15 | 0 |
| D | 0 | 15 | 0 |
| Mode SS | |||
|---|---|---|---|
| Quadrant | BADHDUFLAG | Total packets | Discarded packets |
| A | 0 | 138 | 0 |
| B | 0 | 138 | 0 |
| C | 0 | 138 | 0 |
| D | 0 | 138 | 0 |
| Mode M0 | |||
|---|---|---|---|
| Quadrant | BADHDUFLAG | Total packets | Discarded packets |
| A | 0 | 18253 | 2 |
| B | 0 | 15649 | 2 |
| C | 0 | 17121 | 2 |
| D | 0 | 36512 | 6 |
| Quadrant | Total seconds | Saturated seconds | Saturation percentage |
|---|---|---|---|
| A | 6752 | 481 | 7.123815% |
| B | 6752 | 170 | 2.517773% |
| C | 6752 | 340 | 5.035545% |
| D | 6751 | 3030 | 44.882240% |
Noise dominated data is calculated using 1-second bins in cleaned event files. If a bin has >2000 counts, and if more than 50% of those come from <1% of pixels, then it is considered to be noise-dominated and hence unusable.
| Quadrant | # 1 sec bins | Bins with >0 counts | Bins with >2000 counts | High rate bins dominated by noise | Noise dominated (total time) | Noise dominated (detector-on time) | Marked lightcurve |
|---|---|---|---|---|---|---|---|
| A | 7707 | 6753 | 441 | 441 | 5.72% | 6.53% | 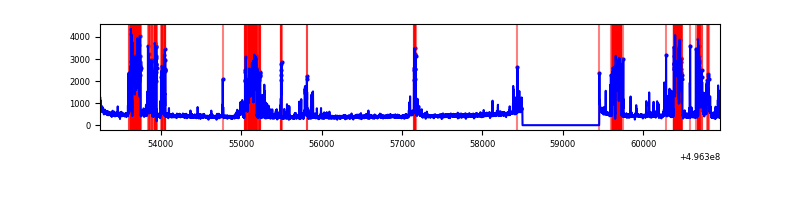 |
| B | 7707 | 6753 | 91 | 91 | 1.18% | 1.35% | 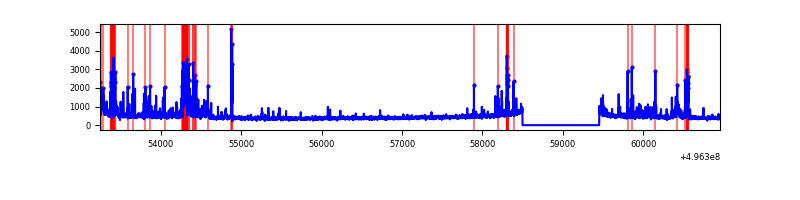 |
| C | 7707 | 6753 | 304 | 304 | 3.94% | 4.50% | 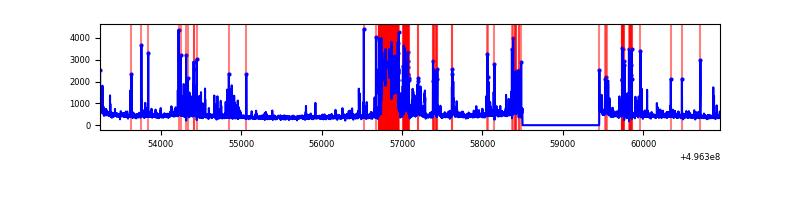 |
| D | 7705 | 6750 | 2821 | 2821 | 36.61% | 41.79% | 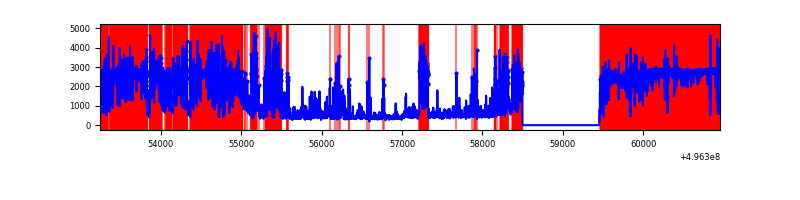 |
Top three noisy pixels from each quadrant. If the there are fewer than three noisy pixels in the level2.evt file, extra rows are filled as -1
| Pixel properties | Quadrant properties | ||||||
|---|---|---|---|---|---|---|---|
| Quadrant | DetID | PixID | Counts | Sigma | Mean | Median | Sigma |
| A | 12 | 115 | 986308 | 5839.36 | 684 | 666 | 168.8 |
| A | 15 | 174 | 581689 | 3442.23 | 684 | 666 | 168.8 |
| A | 0 | 8 | 90643 | 533.06 | 684 | 666 | 168.8 |
| B | 5 | 185 | 207621 | 1390.07 | 701 | 676 | 148.9 |
| B | 0 | 213 | 160447 | 1073.2 | 701 | 676 | 148.9 |
| B | 4 | 171 | 129332 | 864.2 | 701 | 676 | 148.9 |
| C | 15 | 147 | 902791 | 4840.3 | 677 | 671 | 186.4 |
| C | 13 | 3 | 128615 | 686.48 | 677 | 671 | 186.4 |
| C | 14 | 254 | 107548 | 573.44 | 677 | 671 | 186.4 |
| D | 8 | 176 | 6359149 | 45954.77 | 483 | 461 | 138.4 |
| D | 7 | 70 | 1810389 | 13080.5 | 483 | 461 | 138.4 |
| D | 3 | 12 | 278220 | 2007.39 | 483 | 461 | 138.4 |
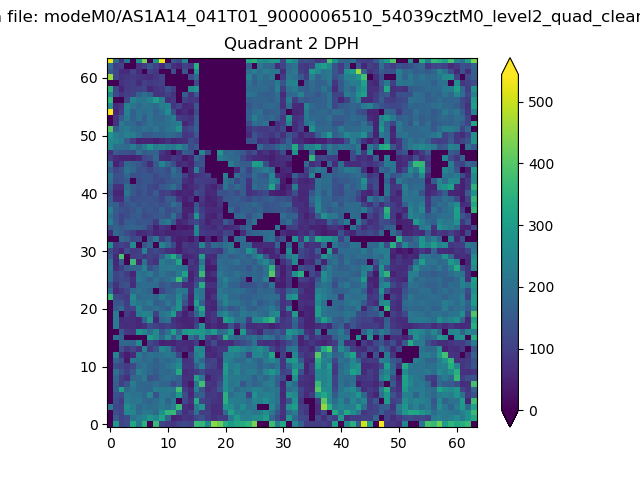
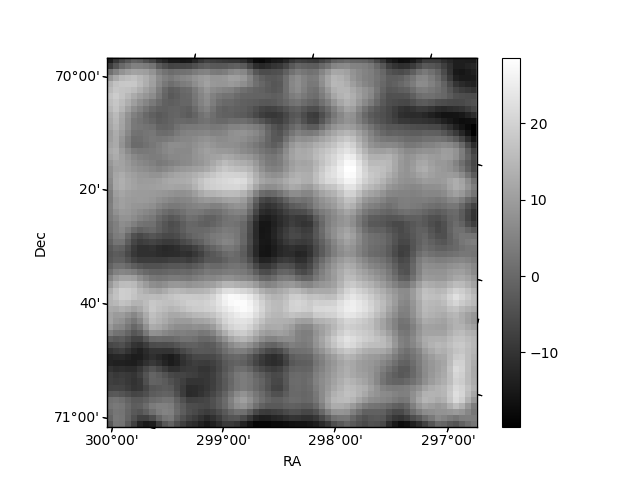
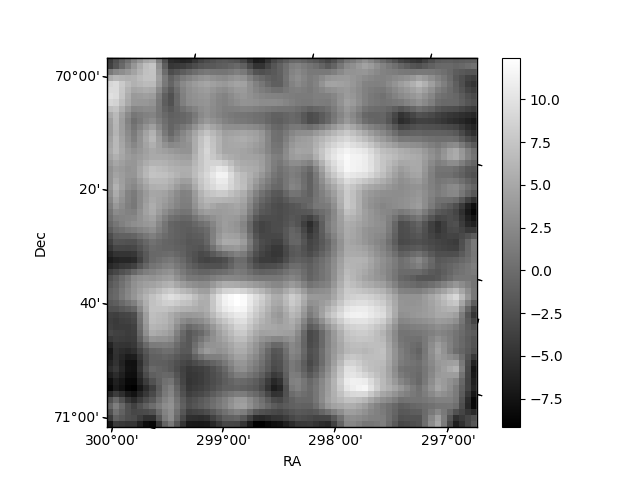
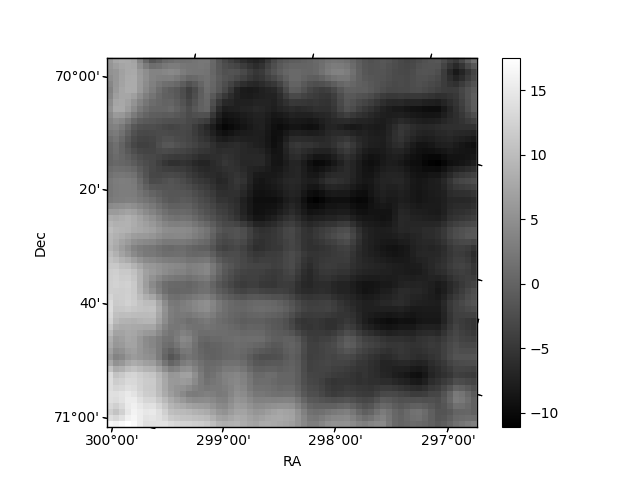
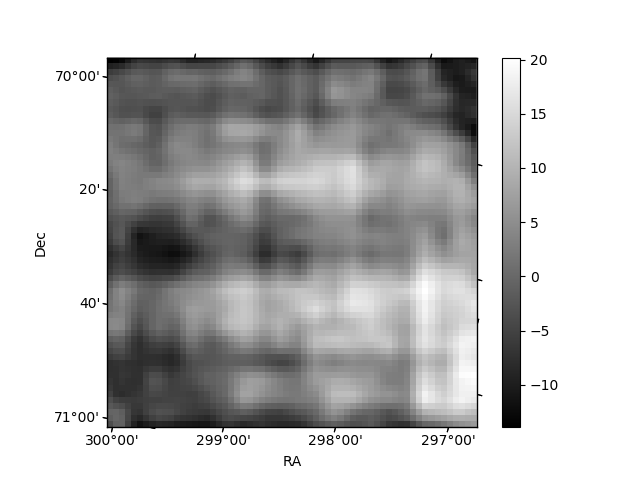
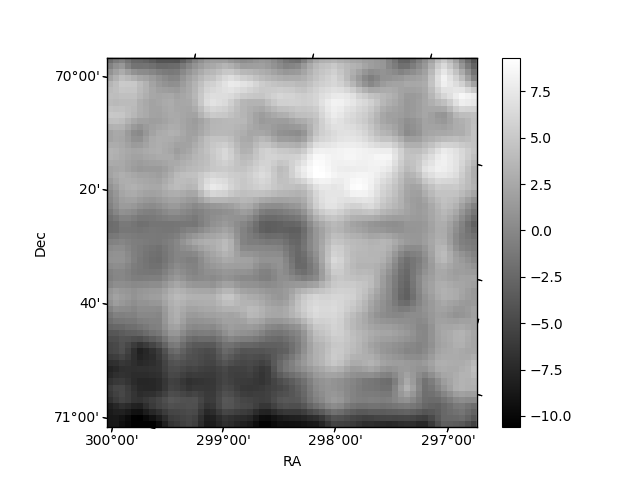
Histogram calculated using DETX and DETY for each event in the final _common_clean file
| Quadrant A | 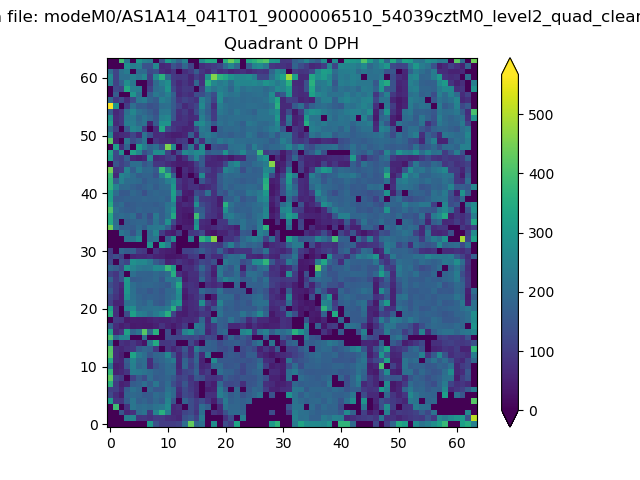 |
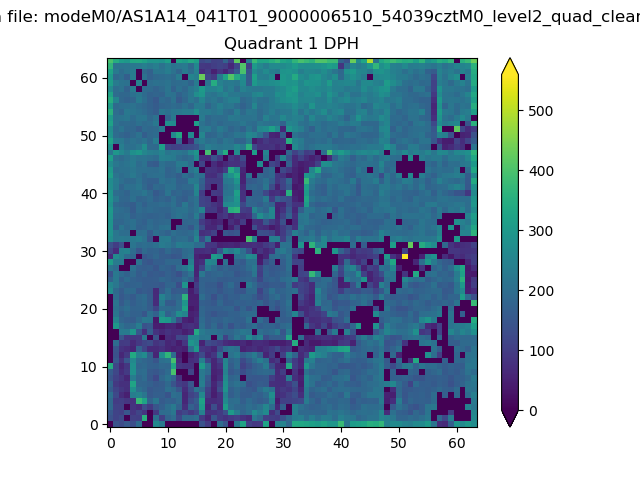 |
Quadrant B |
|---|---|---|---|
| Quadrant D | 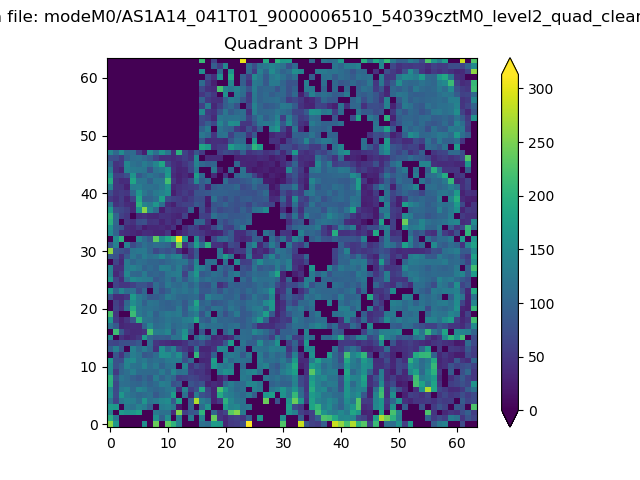 |
 |
Quadrant C |
| Plot type | Count rate plots | Images |
|---|---|---|
| Comparison with Poisson distribution Blue bars denote a histogram of data divided into 1 sec bins. Red curve is a Poisson curve with rate = median count rate of data. |
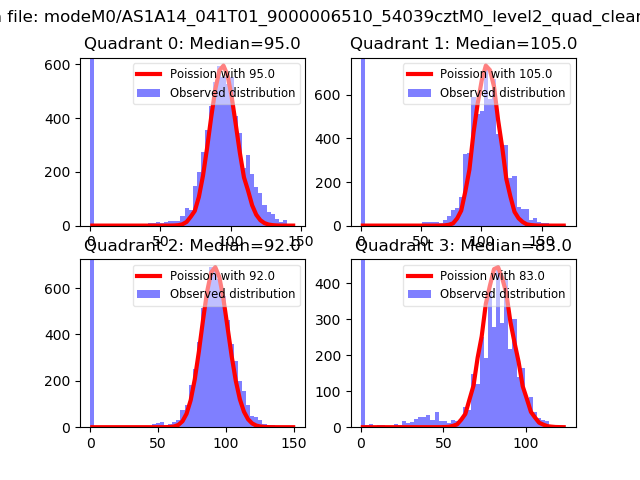 |
 |
| Quadrant-wise count rates Data is divided into 100 sec bins |
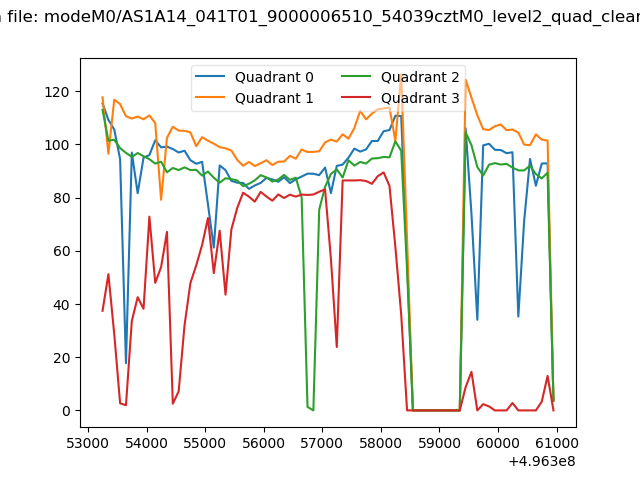 |
|
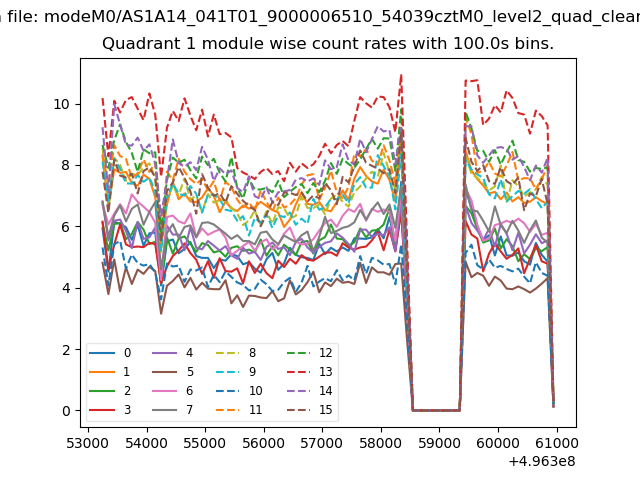
| Module-wise count rates for Quadrant A Data is divided into 100 sec bins |
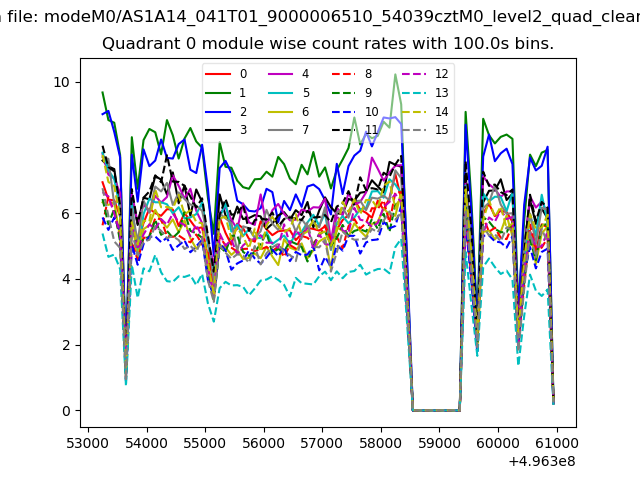 |
 |
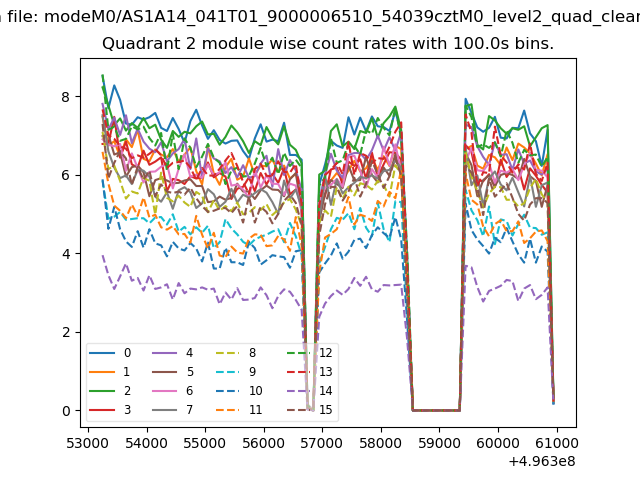
| Module-wise count rates for Quadrant B Data is divided into 100 sec bins |
 |
 |
| Module-wise count rates for Quadrant C Data is divided into 100 sec bins |
 |
 |
| Module-wise count rates for Quadrant D Data is divided into 100 sec bins |
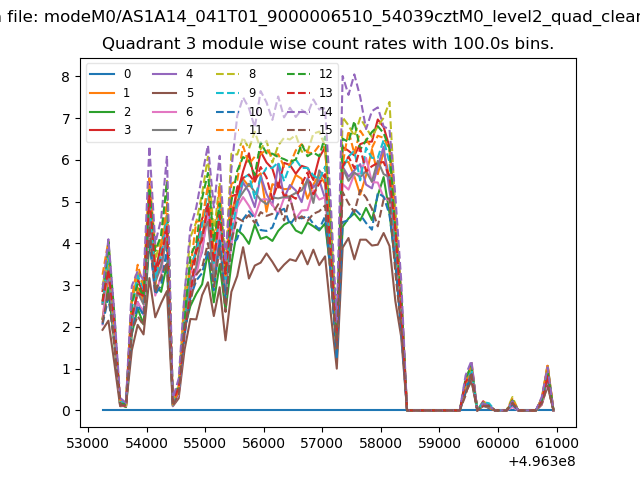 |
 |
| Parameter | Plot |
|---|---|
| CZT HV Monitor | 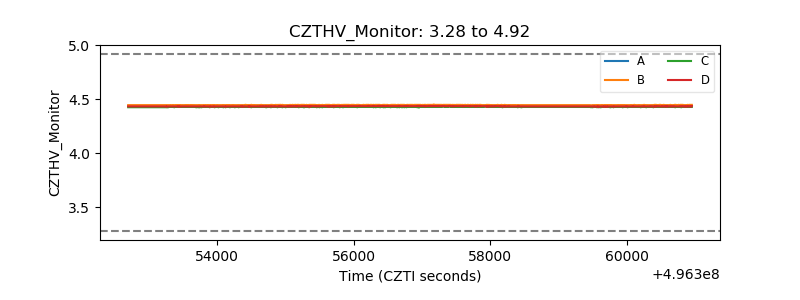 |
| D_VDD | 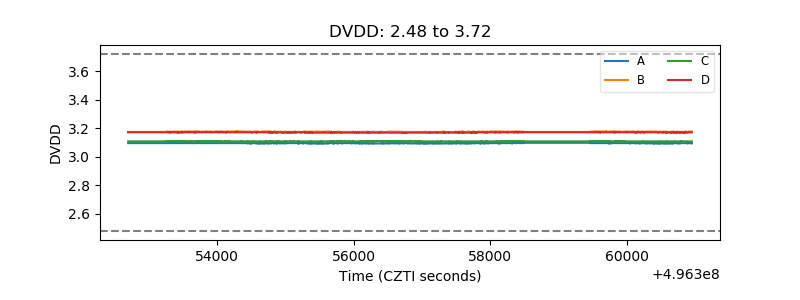 |
| Temperature 1 | 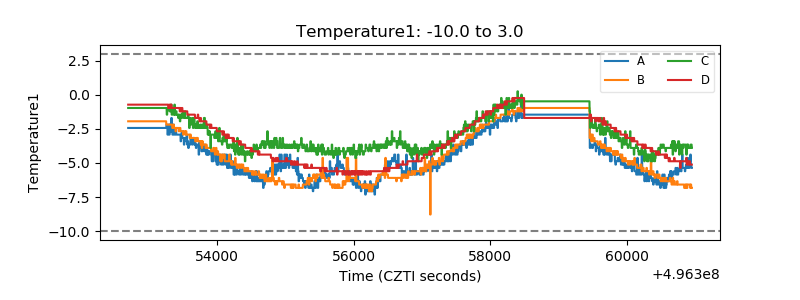 |
| Veto HV Monitor | 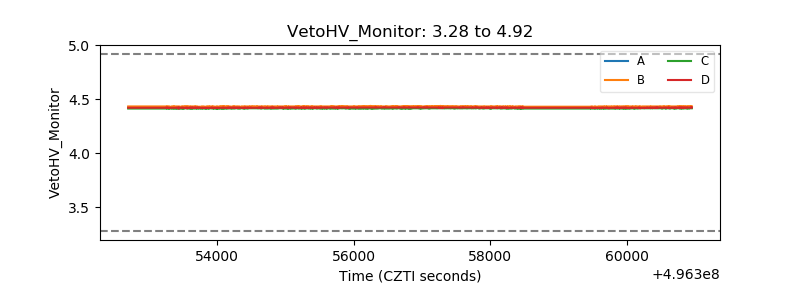 |
| Veto LLD | 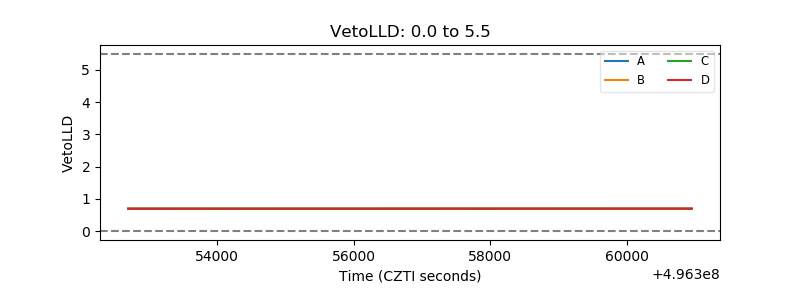 |
| Alpha Counter | 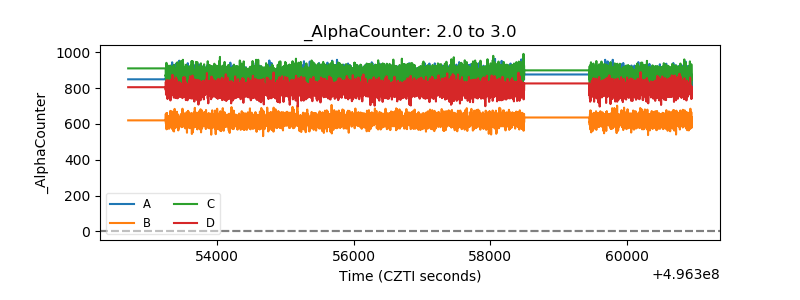 |
| _CPM_Rate | 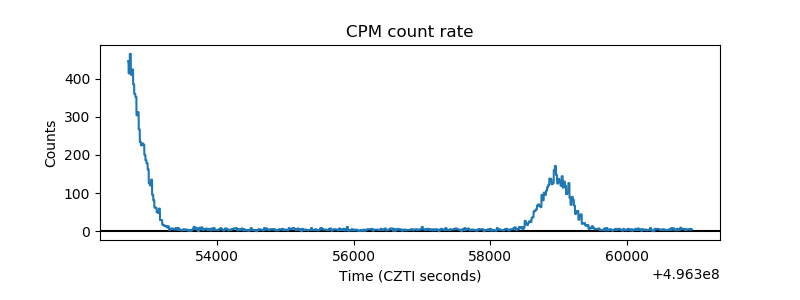 |
| CZT Counter | 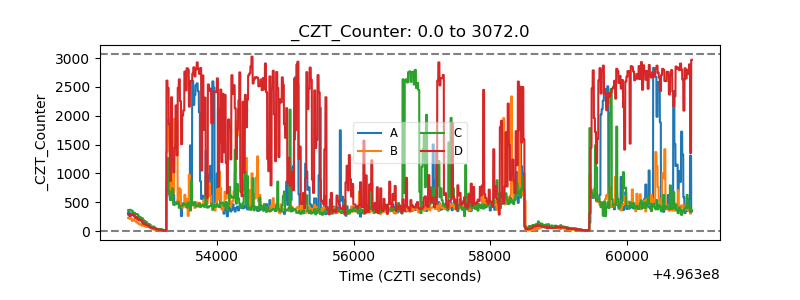 |
| +2.5 Volts monitor |  |
| +5 Volts monitor |  |
| _ROLL_ROT | 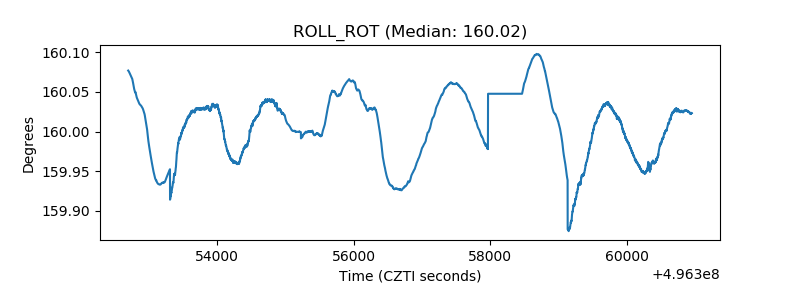 |
| _Roll_DEC | 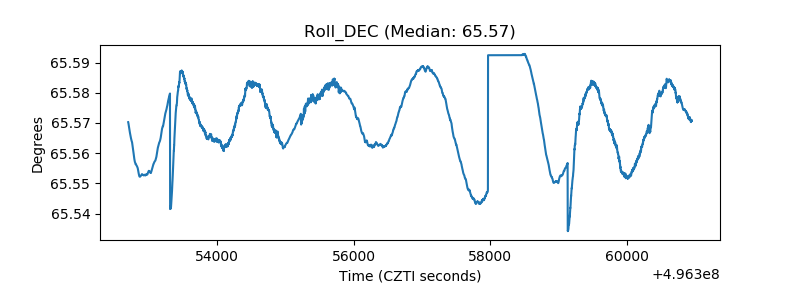 |
| _Roll_RA | 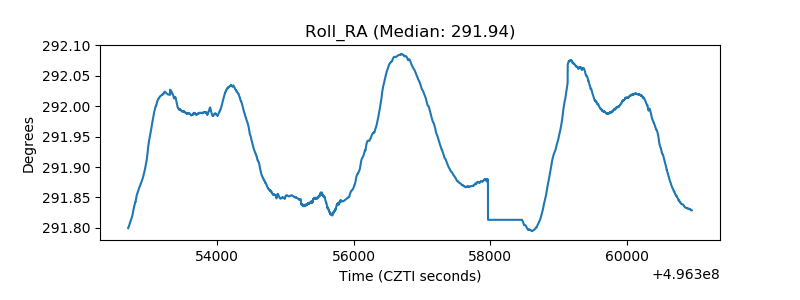 |
| Veto Counter | 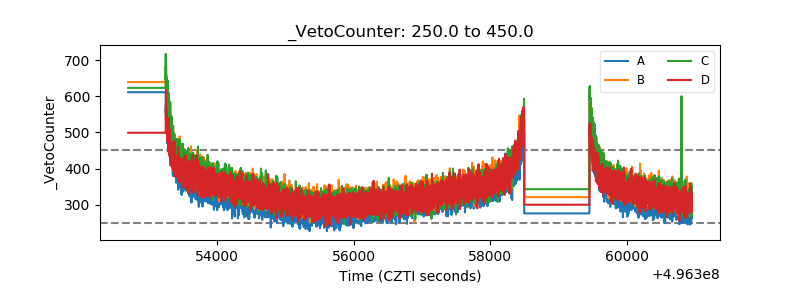 |