| Param | Original file | Final file |
|---|---|---|
| Filename | modeM0/AS1A14_041T01_9000006510_54041cztM0_level2.fits | modeM0/AS1A14_041T01_9000006510_54041cztM0_level2_quad_clean.evt |
| Size (bytes) | 825,491,520 | 104,088,960 |
| Size | 787.3 MB | 99.3 MB |
| Events in quadrant A | 4,818,477 | 749,858 |
| Events in quadrant B | 4,603,088 | 837,308 |
| Events in quadrant C | 5,064,798 | 725,884 |
| Events in quadrant D | 15,428,147 | 263,098 |
| Mode M9 | |||
|---|---|---|---|
| Quadrant | BADHDUFLAG | Total packets | Discarded packets |
| A | 0 | 5 | 0 |
| B | 0 | 5 | 0 |
| C | 0 | 5 | 0 |
| D | 0 | 5 | 0 |
| Mode SS | |||
|---|---|---|---|
| Quadrant | BADHDUFLAG | Total packets | Discarded packets |
| A | 0 | 168 | 0 |
| B | 0 | 168 | 0 |
| C | 0 | 168 | 0 |
| D | 0 | 168 | 0 |
| Mode M0 | |||
|---|---|---|---|
| Quadrant | BADHDUFLAG | Total packets | Discarded packets |
| A | 0 | 20599 | 1 |
| B | 0 | 19883 | 1 |
| C | 0 | 21281 | 1 |
| D | 0 | 51665 | 1 |
| Quadrant | Total seconds | Saturated seconds | Saturation percentage |
|---|---|---|---|
| A | 8277 | 433 | 5.231364% |
| B | 8278 | 273 | 3.297898% |
| C | 8278 | 357 | 4.312636% |
| D | 8278 | 5172 | 62.478860% |
Noise dominated data is calculated using 1-second bins in cleaned event files. If a bin has >2000 counts, and if more than 50% of those come from <1% of pixels, then it is considered to be noise-dominated and hence unusable.
| Quadrant | # 1 sec bins | Bins with >0 counts | Bins with >2000 counts | High rate bins dominated by noise | Noise dominated (total time) | Noise dominated (detector-on time) | Marked lightcurve |
|---|---|---|---|---|---|---|---|
| A | 8802 | 8278 | 292 | 292 | 3.32% | 3.53% | 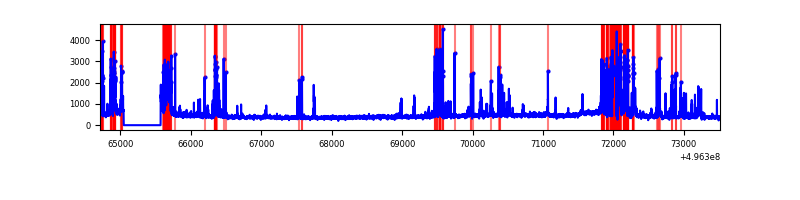 |
| B | 8803 | 8279 | 112 | 112 | 1.27% | 1.35% | 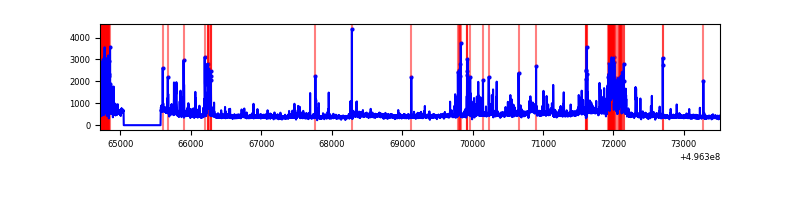 |
| C | 8803 | 8279 | 271 | 271 | 3.08% | 3.27% | 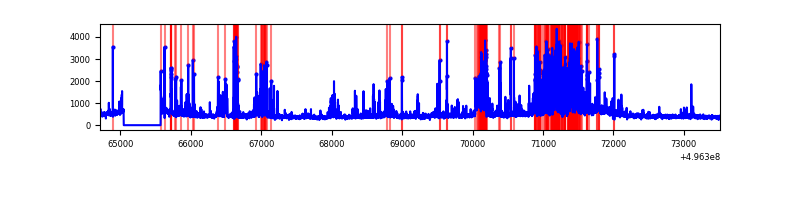 |
| D | 8803 | 8278 | 4679 | 4679 | 53.15% | 56.52% | 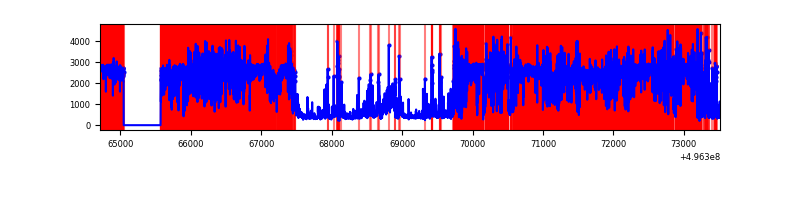 |
Top three noisy pixels from each quadrant. If the there are fewer than three noisy pixels in the level2.evt file, extra rows are filled as -1
| Pixel properties | Quadrant properties | ||||||
|---|---|---|---|---|---|---|---|
| Quadrant | DetID | PixID | Counts | Sigma | Mean | Median | Sigma |
| A | 15 | 174 | 843996 | 4014.89 | 853 | 832 | 210.0 |
| A | 0 | 8 | 447338 | 2126.13 | 853 | 832 | 210.0 |
| A | 13 | 248 | 93688 | 442.15 | 853 | 832 | 210.0 |
| B | 5 | 185 | 353768 | 1929.88 | 870 | 841 | 182.9 |
| B | 5 | 236 | 250811 | 1366.89 | 870 | 841 | 182.9 |
| B | 7 | 252 | 178801 | 973.13 | 870 | 841 | 182.9 |
| C | 15 | 147 | 846186 | 3632.13 | 853 | 844 | 232.7 |
| C | 13 | 3 | 454002 | 1947.06 | 853 | 844 | 232.7 |
| C | 12 | 252 | 97803 | 416.6 | 853 | 844 | 232.7 |
| D | 8 | 176 | 11146553 | 81995.91 | 475 | 453 | 135.9 |
| D | 7 | 70 | 1411944 | 10383.59 | 475 | 453 | 135.9 |
| D | 2 | 165 | 205455 | 1508.09 | 475 | 453 | 135.9 |
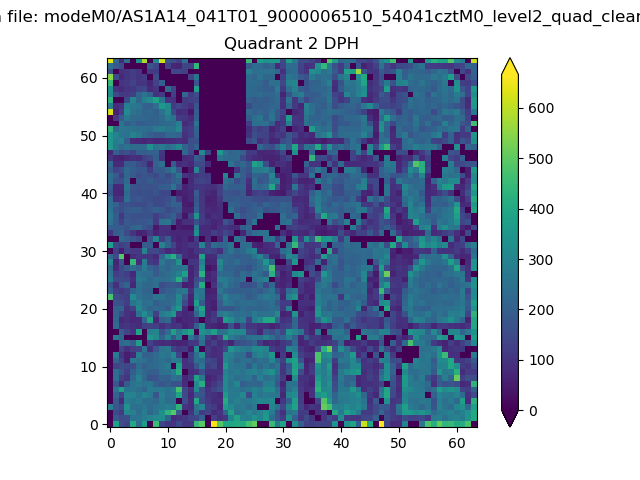
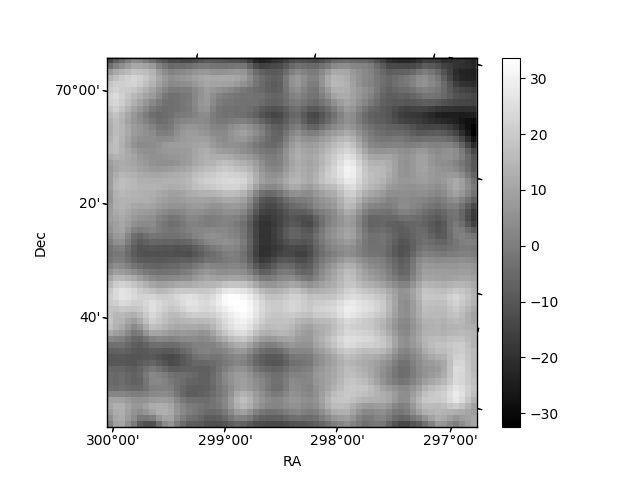
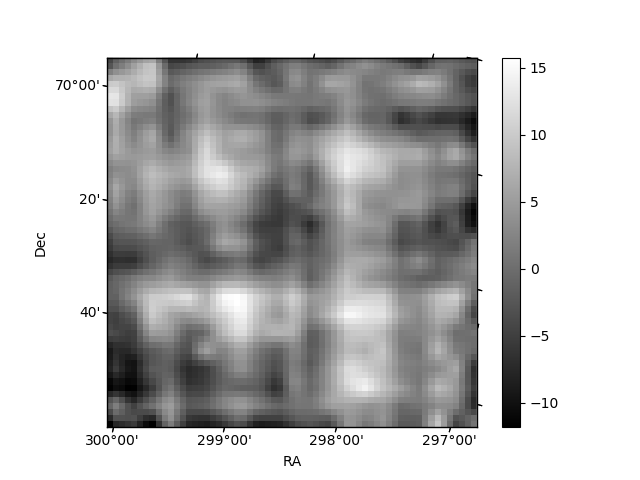
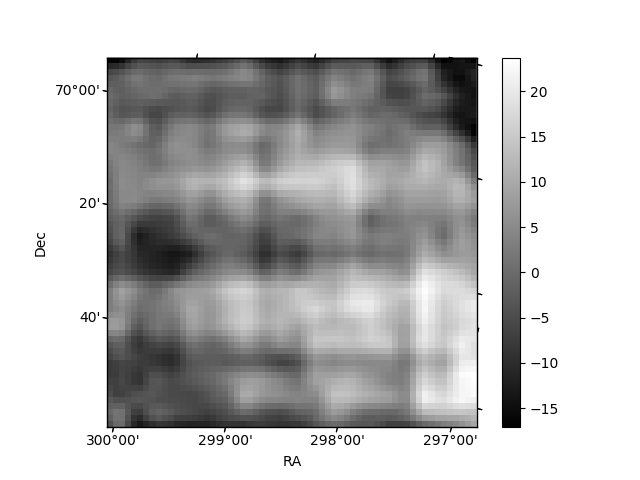
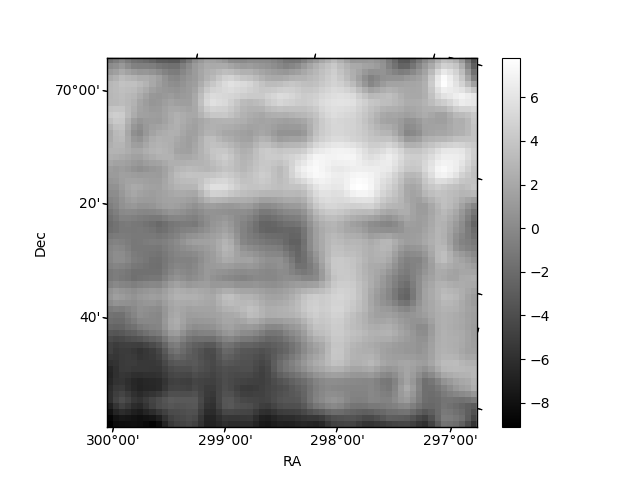
Histogram calculated using DETX and DETY for each event in the final _common_clean file
| Quadrant A | 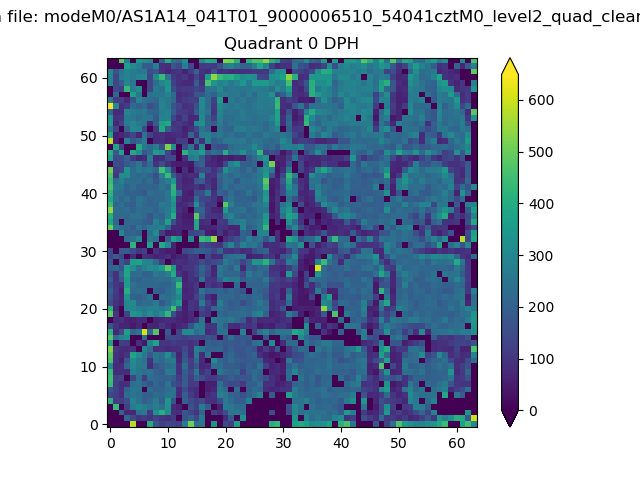 |
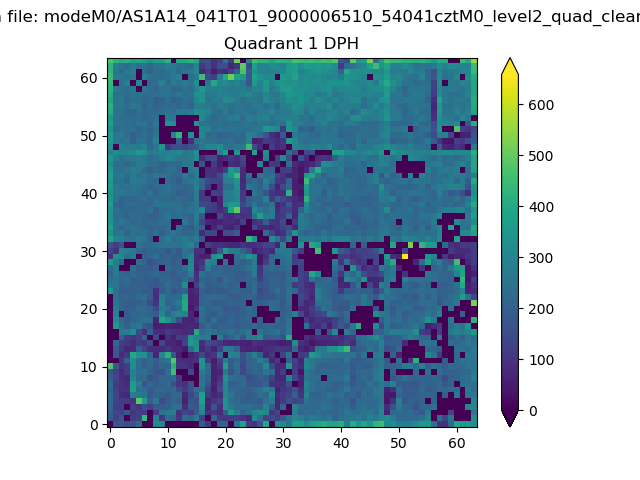 |
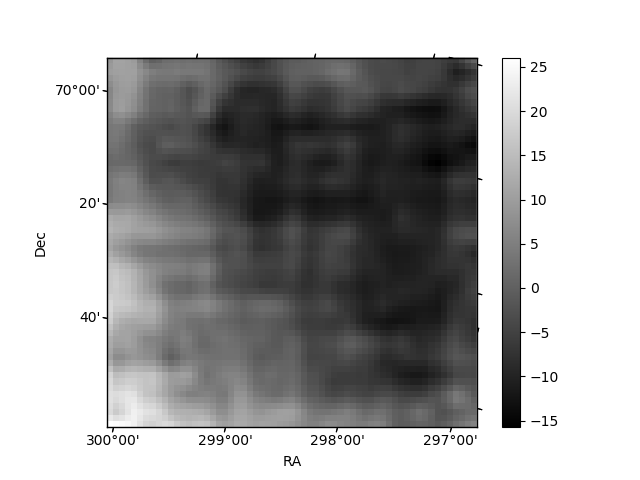
Quadrant B |
|---|---|---|---|
| Quadrant D | 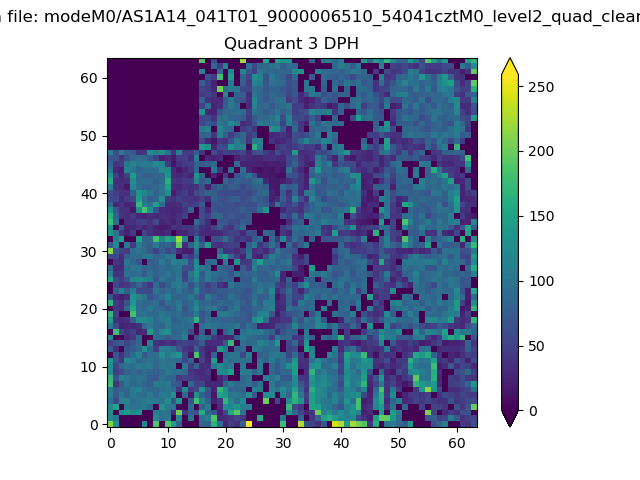 |
 |
Quadrant C |
| Plot type | Count rate plots | Images |
|---|---|---|
| Comparison with Poisson distribution Blue bars denote a histogram of data divided into 1 sec bins. Red curve is a Poisson curve with rate = median count rate of data. |
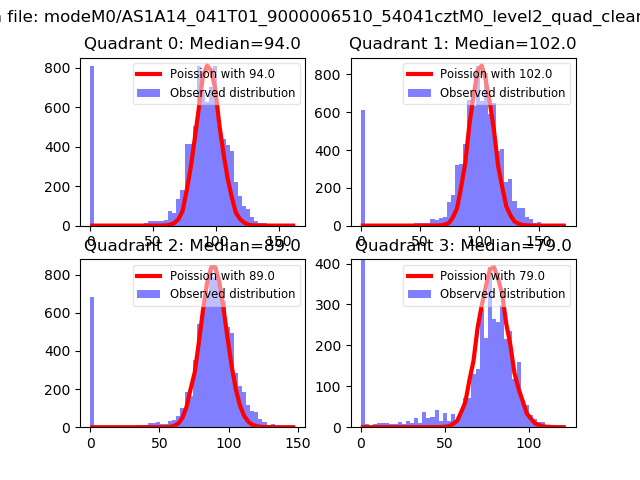 |
 |
| Quadrant-wise count rates Data is divided into 100 sec bins |
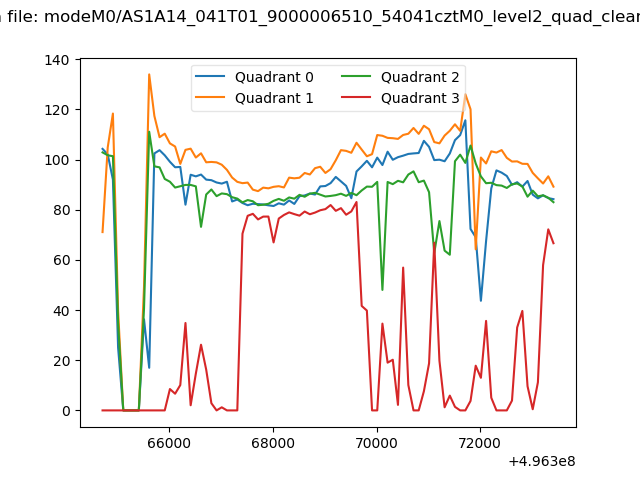 |
|
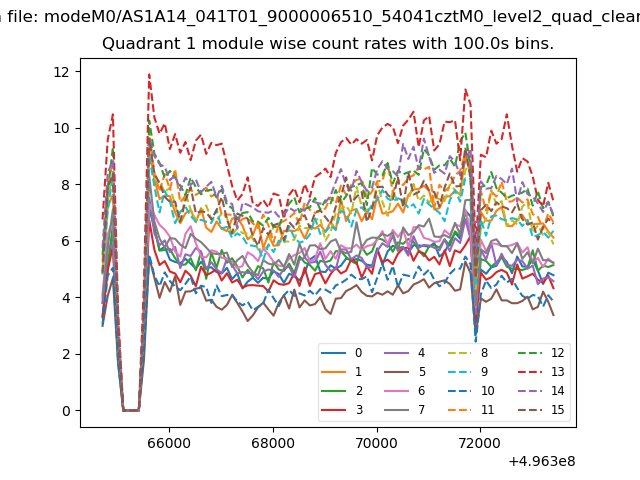
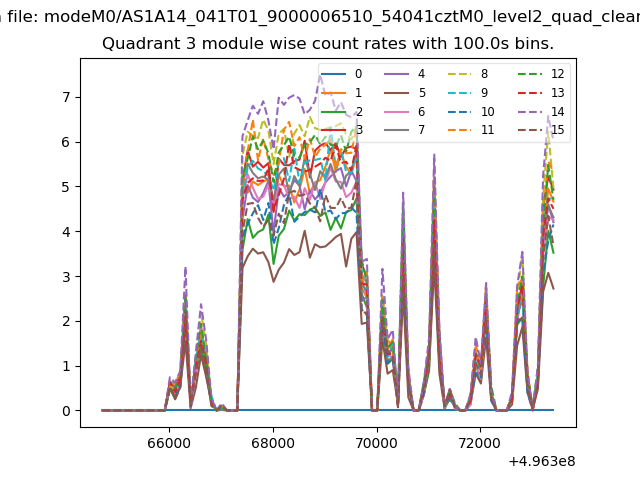
| Module-wise count rates for Quadrant A Data is divided into 100 sec bins |
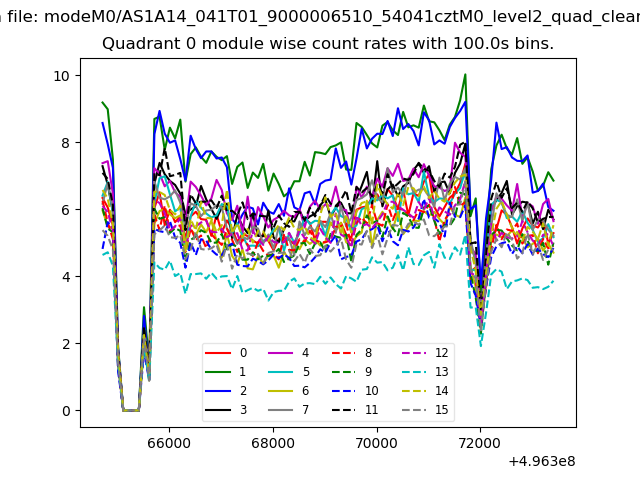 |
 |
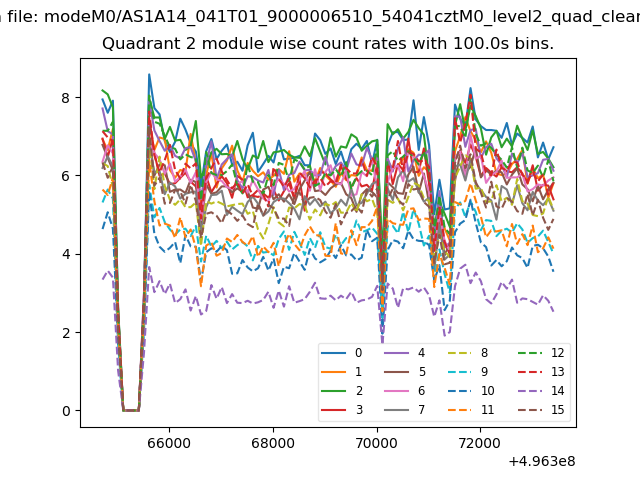
| Module-wise count rates for Quadrant B Data is divided into 100 sec bins |
 |
 |
| Module-wise count rates for Quadrant C Data is divided into 100 sec bins |
 |
 |
| Module-wise count rates for Quadrant D Data is divided into 100 sec bins |
 |
 |
| Parameter | Plot |
|---|---|
| CZT HV Monitor | 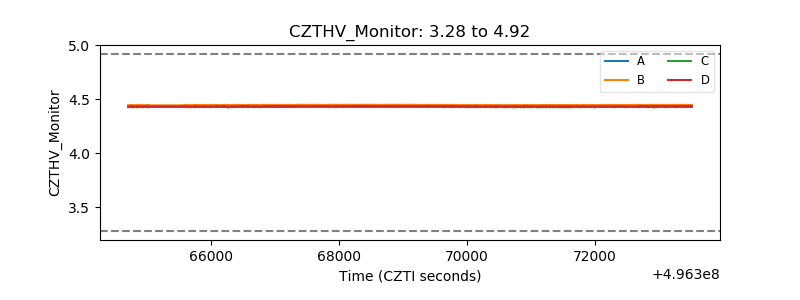 |
| D_VDD | 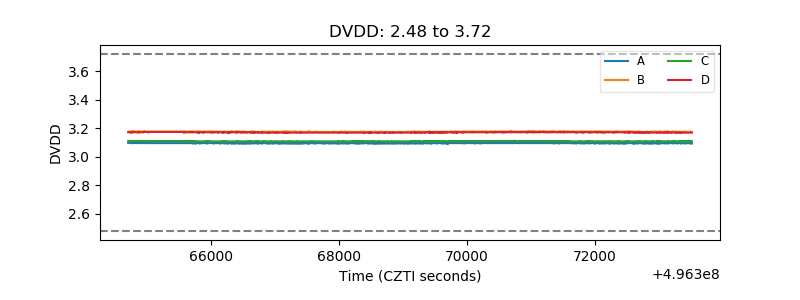 |
| Temperature 1 | 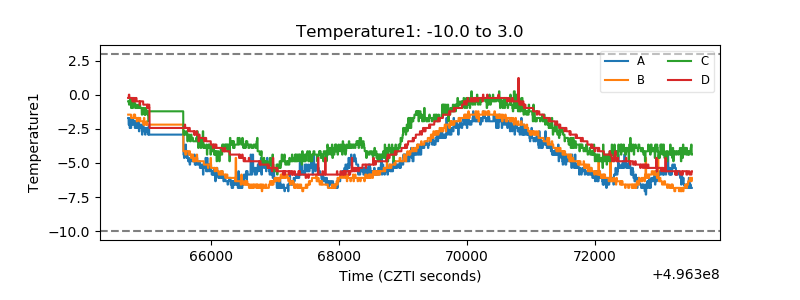 |
| Veto HV Monitor | 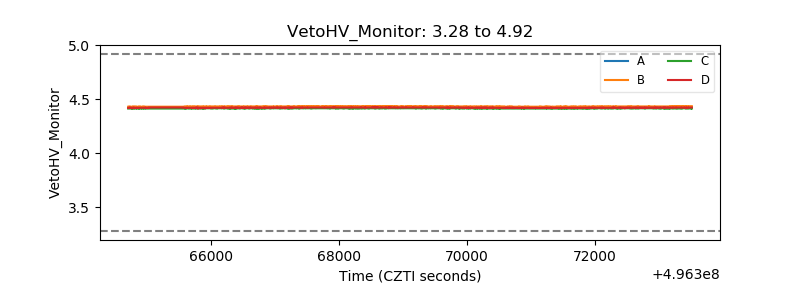 |
| Veto LLD | 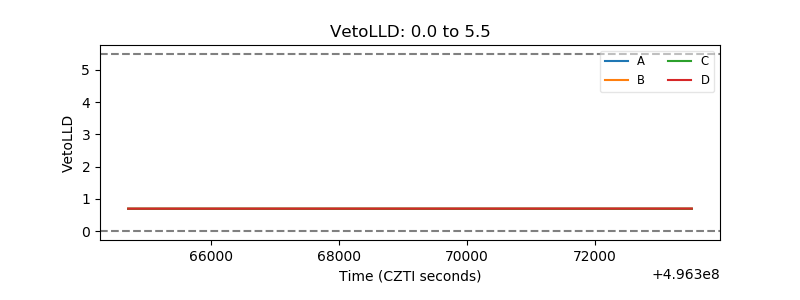 |
| Alpha Counter | 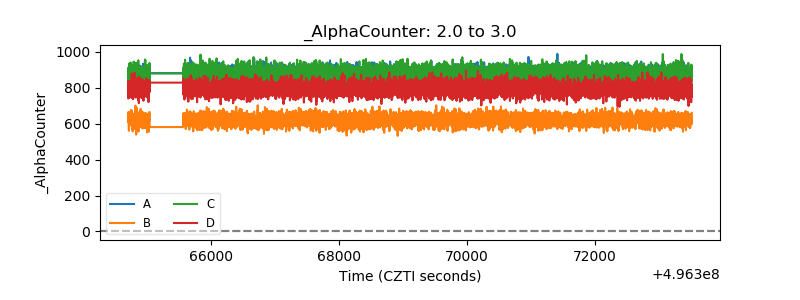 |
| _CPM_Rate | 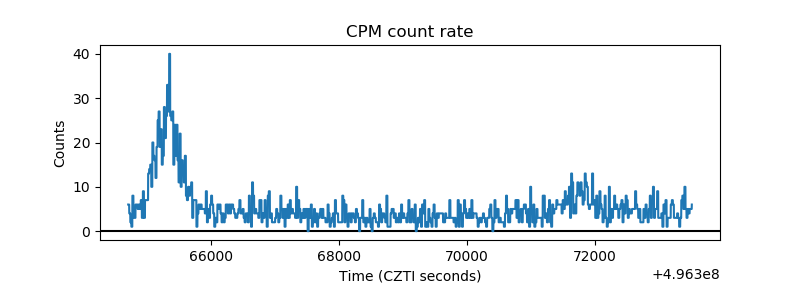 |
| CZT Counter | 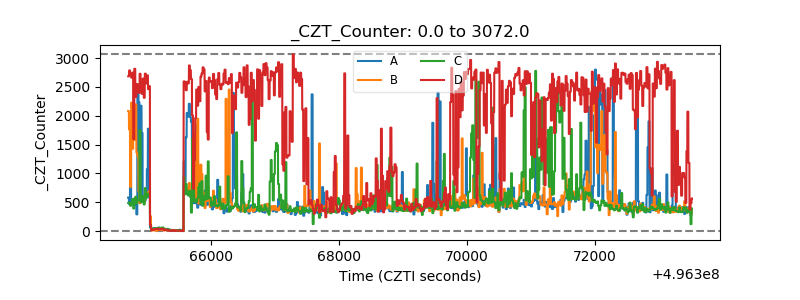 |
| +2.5 Volts monitor |  |
| +5 Volts monitor |  |
| _ROLL_ROT | 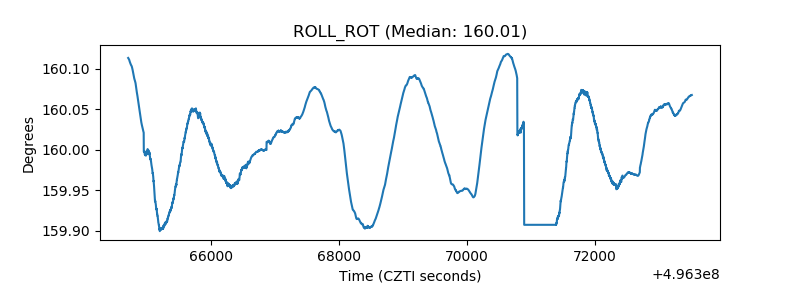 |
| _Roll_DEC | 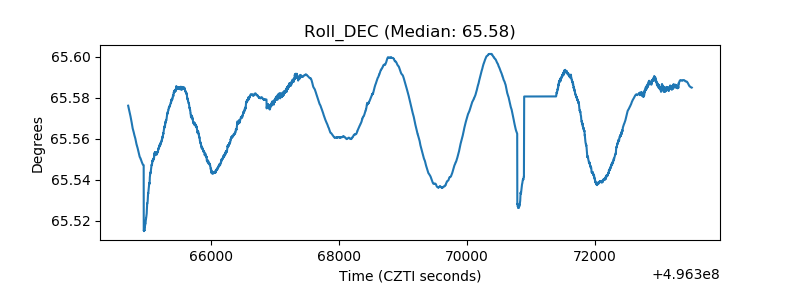 |
| _Roll_RA | 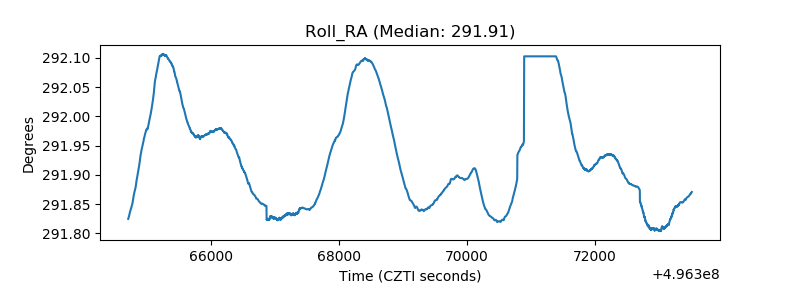 |
| Veto Counter | 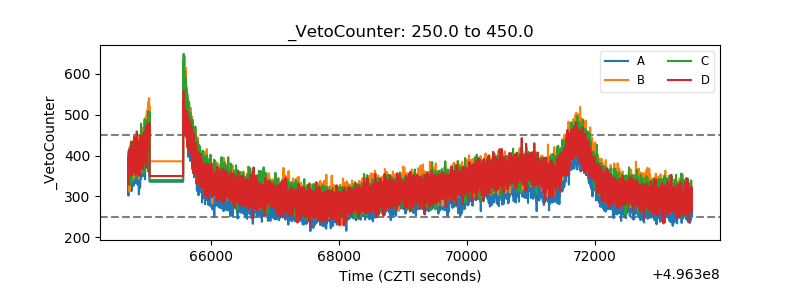 |