| Param | Original file | Final file |
|---|---|---|
| Filename | modeM0/AS1A14_041T01_9000006510_54042cztM0_level2.fits | modeM0/AS1A14_041T01_9000006510_54042cztM0_level2_quad_clean.evt |
| Size (bytes) | 800,507,520 | 105,048,000 |
| Size | 763.4 MB | 100.2 MB |
| Events in quadrant A | 4,985,838 | 750,532 |
| Events in quadrant B | 4,368,793 | 837,892 |
| Events in quadrant C | 5,367,894 | 714,174 |
| Events in quadrant D | 14,262,649 | 298,883 |
| Mode SS | |||
|---|---|---|---|
| Quadrant | BADHDUFLAG | Total packets | Discarded packets |
| A | 0 | 168 | 0 |
| B | 0 | 168 | 0 |
| C | 0 | 168 | 0 |
| D | 0 | 168 | 0 |
| Mode M0 | |||
|---|---|---|---|
| Quadrant | BADHDUFLAG | Total packets | Discarded packets |
| A | 0 | 21067 | 0 |
| B | 0 | 19259 | 0 |
| C | 0 | 22304 | 0 |
| D | 0 | 48323 | 0 |
| Quadrant | Total seconds | Saturated seconds | Saturation percentage |
|---|---|---|---|
| A | 8330 | 380 | 4.561825% |
| B | 8331 | 213 | 2.556716% |
| C | 8331 | 517 | 6.205738% |
| D | 8331 | 4749 | 57.003961% |
Noise dominated data is calculated using 1-second bins in cleaned event files. If a bin has >2000 counts, and if more than 50% of those come from <1% of pixels, then it is considered to be noise-dominated and hence unusable.
| Quadrant | # 1 sec bins | Bins with >0 counts | Bins with >2000 counts | High rate bins dominated by noise | Noise dominated (total time) | Noise dominated (detector-on time) | Marked lightcurve |
|---|---|---|---|---|---|---|---|
| A | 8330 | 8330 | 314 | 314 | 3.77% | 3.77% | 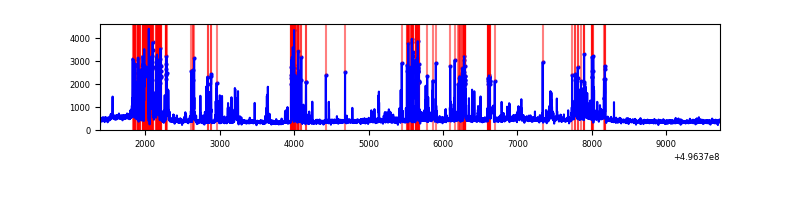 |
| B | 8331 | 8331 | 88 | 88 | 1.06% | 1.06% | 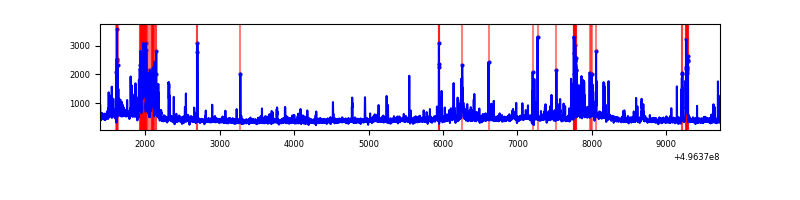 |
| C | 8331 | 8331 | 387 | 387 | 4.65% | 4.65% | 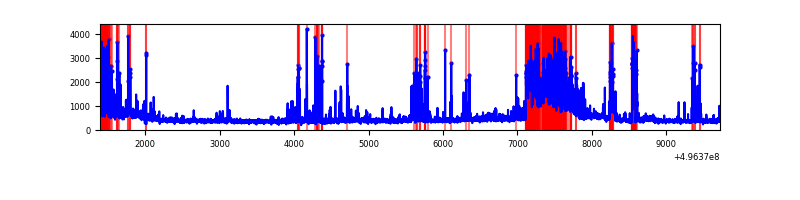 |
| D | 8331 | 8331 | 4170 | 4170 | 50.05% | 50.05% | 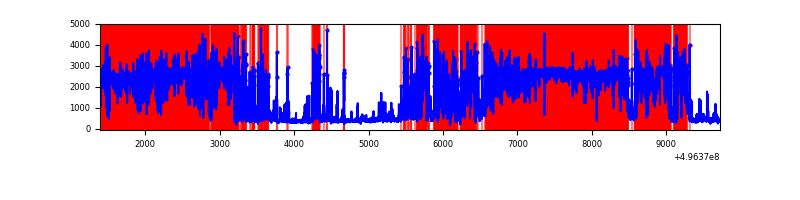 |
Top three noisy pixels from each quadrant. If the there are fewer than three noisy pixels in the level2.evt file, extra rows are filled as -1
| Pixel properties | Quadrant properties | ||||||
|---|---|---|---|---|---|---|---|
| Quadrant | DetID | PixID | Counts | Sigma | Mean | Median | Sigma |
| A | 15 | 174 | 825418 | 3901.77 | 855 | 831 | 211.3 |
| A | 0 | 8 | 470783 | 2223.71 | 855 | 831 | 211.3 |
| A | 13 | 248 | 164899 | 776.33 | 855 | 831 | 211.3 |
| B | 5 | 236 | 266072 | 1440.5 | 873 | 843 | 184.1 |
| B | 5 | 185 | 254626 | 1378.34 | 873 | 843 | 184.1 |
| B | 7 | 252 | 141633 | 764.65 | 873 | 843 | 184.1 |
| C | 15 | 158 | 836674 | 3564.54 | 848 | 837 | 234.5 |
| C | 13 | 3 | 475583 | 2024.62 | 848 | 837 | 234.5 |
| C | 15 | 147 | 184793 | 784.51 | 848 | 837 | 234.5 |
| D | 8 | 176 | 11514805 | 79859.44 | 505 | 483 | 144.2 |
| D | 3 | 12 | 238575 | 1651.33 | 505 | 483 | 144.2 |
| D | 10 | 172 | 224466 | 1553.47 | 505 | 483 | 144.2 |
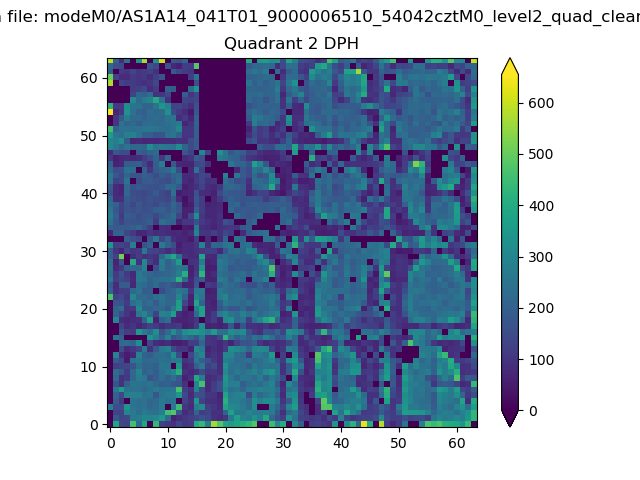
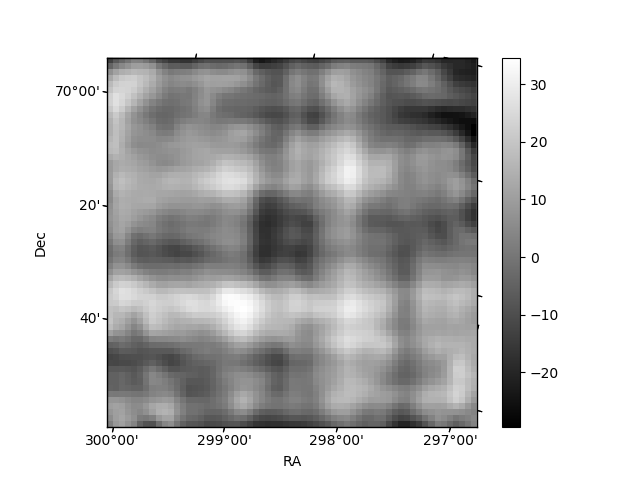
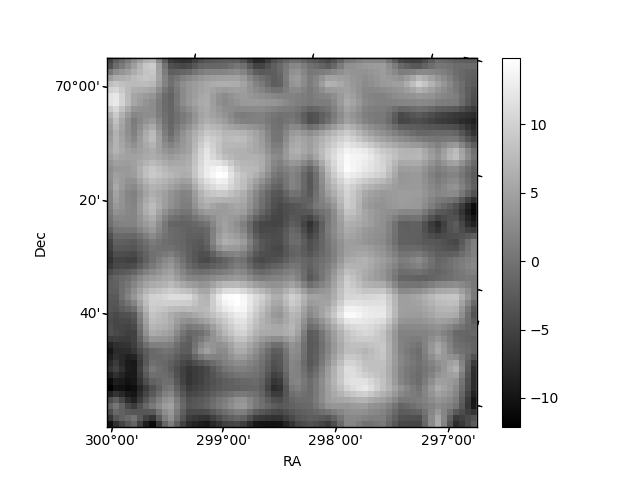
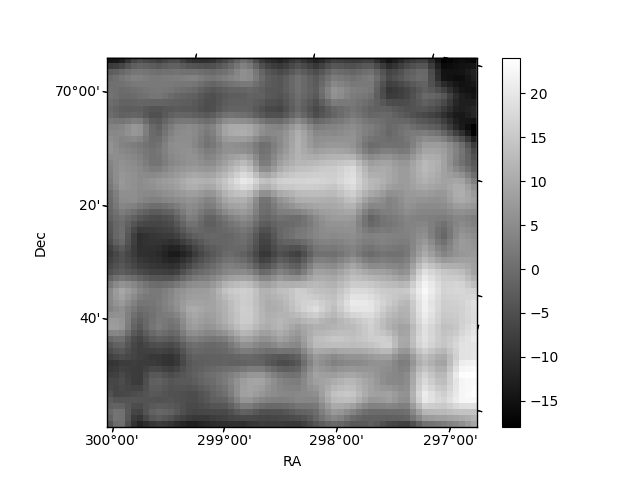
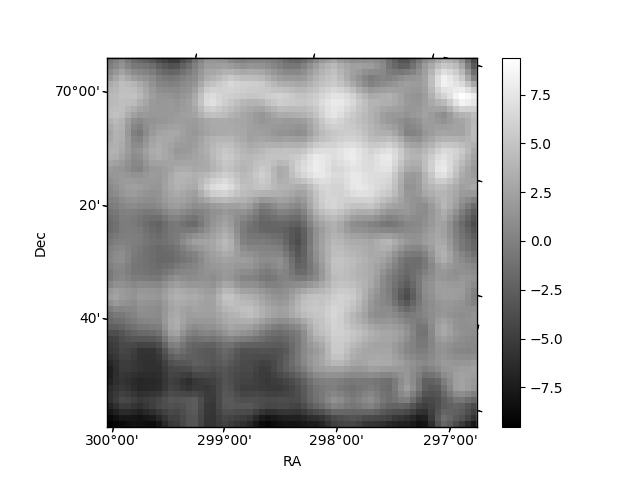
Histogram calculated using DETX and DETY for each event in the final _common_clean file
| Quadrant A | 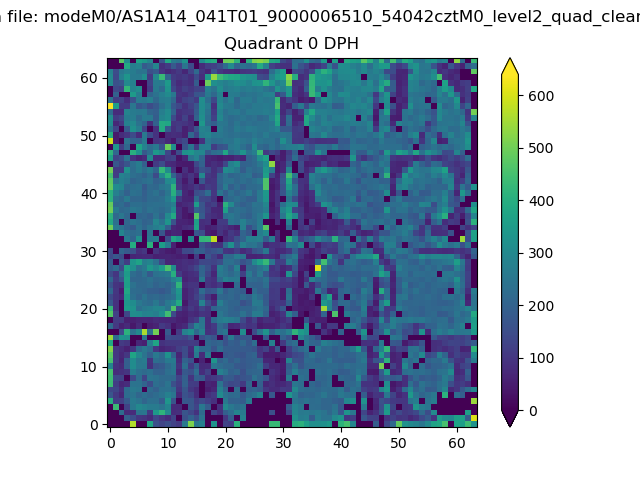 |
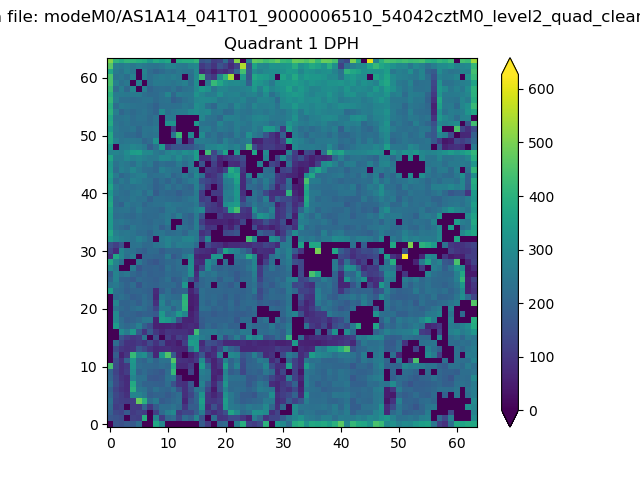 |
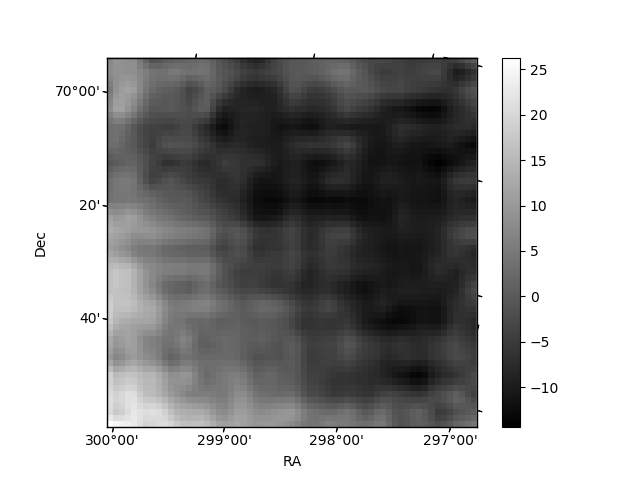
Quadrant B |
|---|---|---|---|
| Quadrant D | 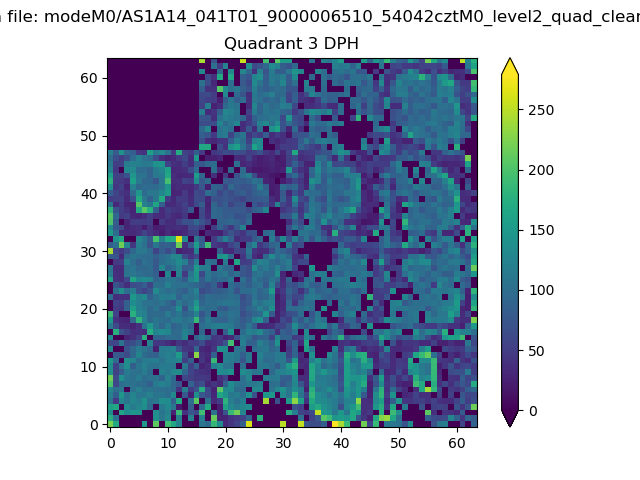 |
 |
Quadrant C |
| Plot type | Count rate plots | Images |
|---|---|---|
| Comparison with Poisson distribution Blue bars denote a histogram of data divided into 1 sec bins. Red curve is a Poisson curve with rate = median count rate of data. |
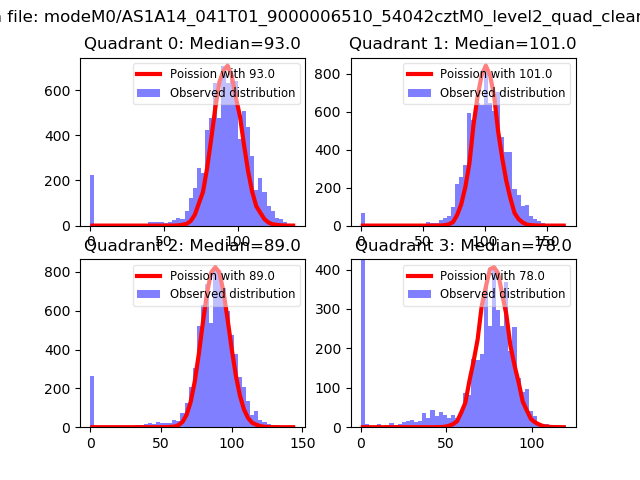 |
 |
| Quadrant-wise count rates Data is divided into 100 sec bins |
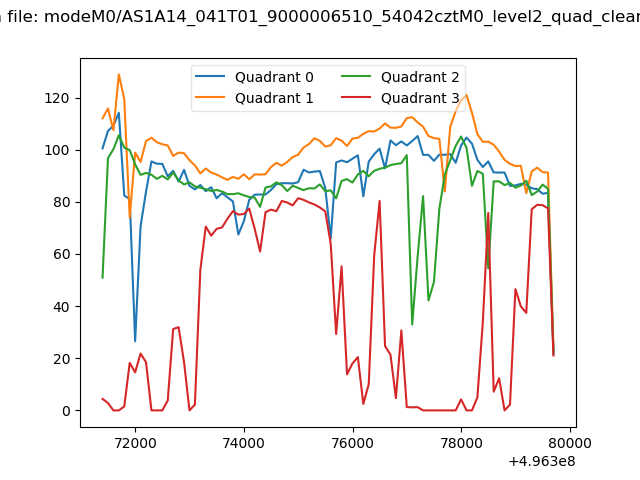 |
|
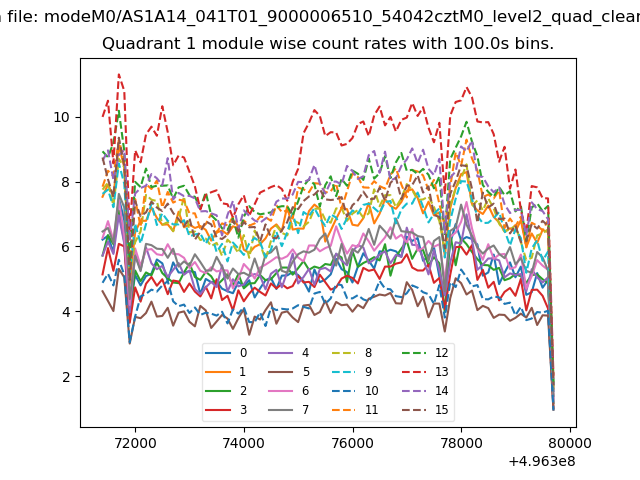
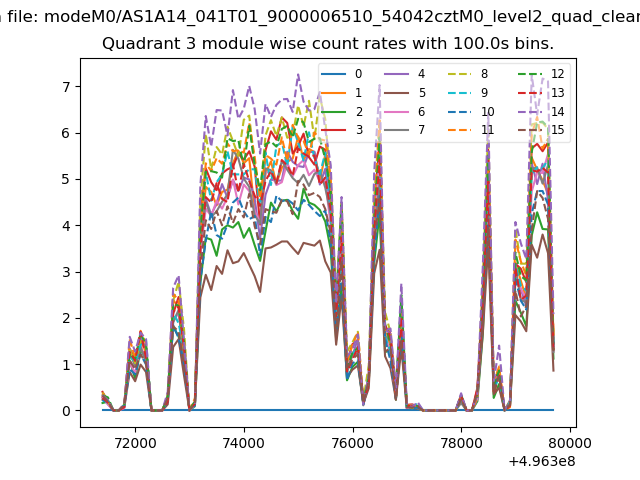
| Module-wise count rates for Quadrant A Data is divided into 100 sec bins |
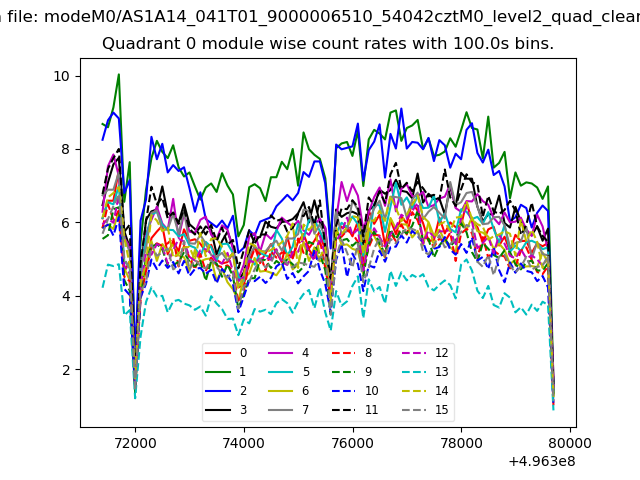 |
 |
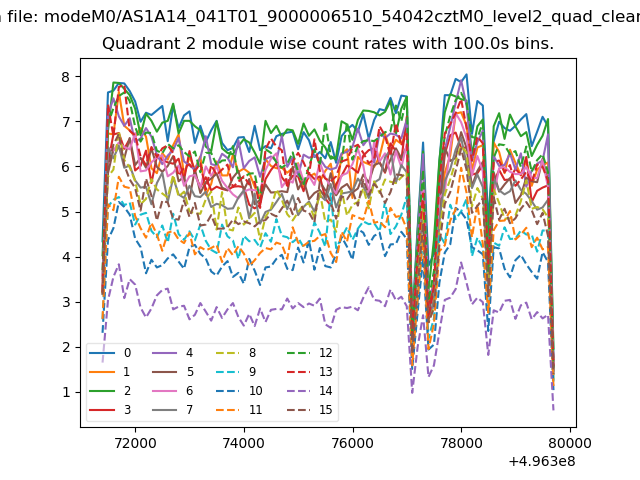
| Module-wise count rates for Quadrant B Data is divided into 100 sec bins |
 |
 |
| Module-wise count rates for Quadrant C Data is divided into 100 sec bins |
 |
 |
| Module-wise count rates for Quadrant D Data is divided into 100 sec bins |
 |
 |
| Parameter | Plot |
|---|---|
| CZT HV Monitor | 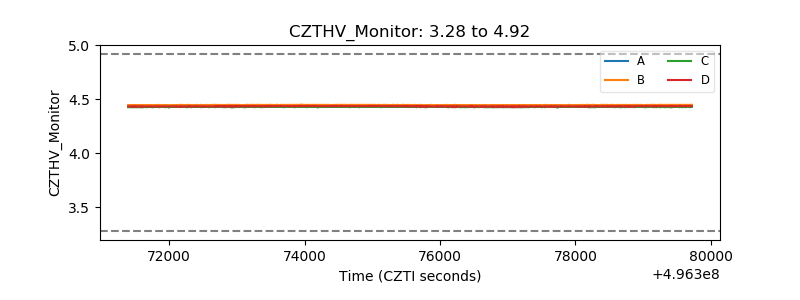 |
| D_VDD | 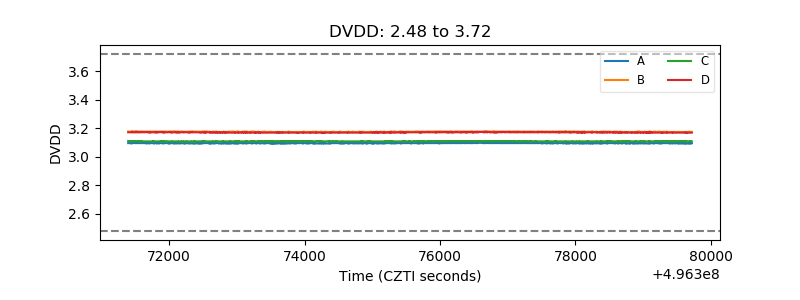 |
| Temperature 1 | 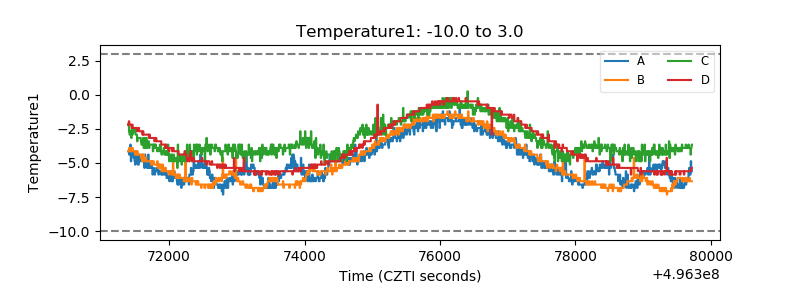 |
| Veto HV Monitor | 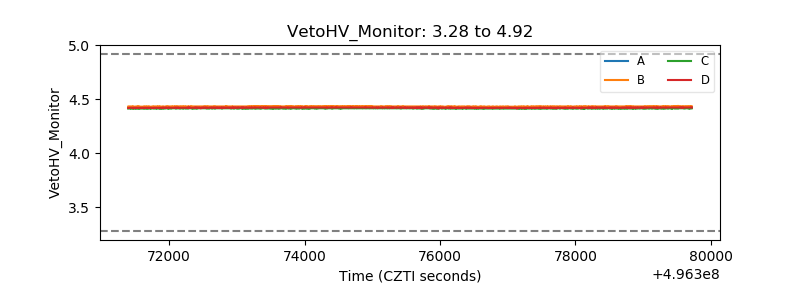 |
| Veto LLD | 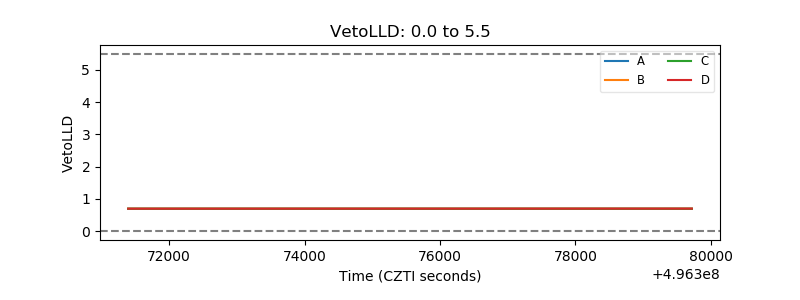 |
| Alpha Counter | 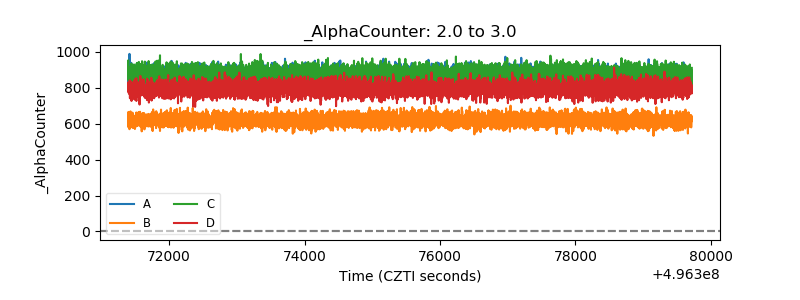 |
| _CPM_Rate | 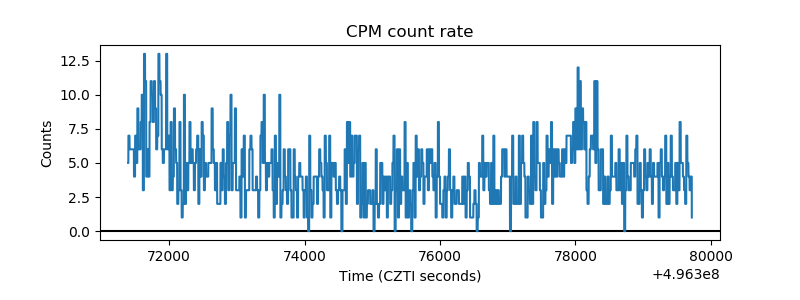 |
| CZT Counter | 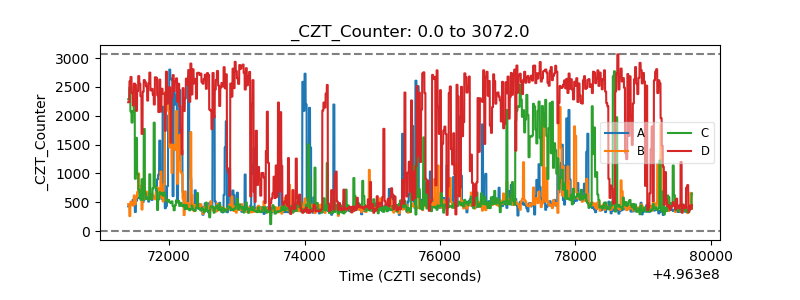 |
| +2.5 Volts monitor |  |
| +5 Volts monitor |  |
| _ROLL_ROT | 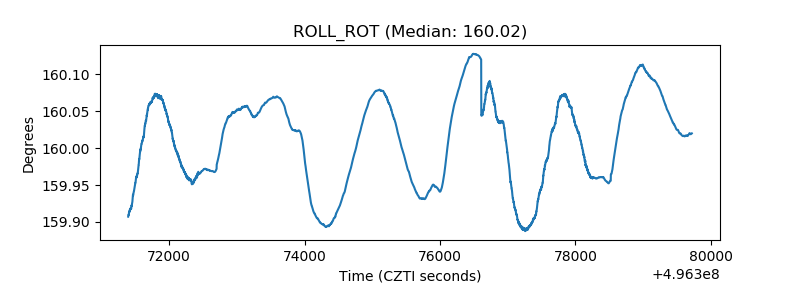 |
| _Roll_DEC | 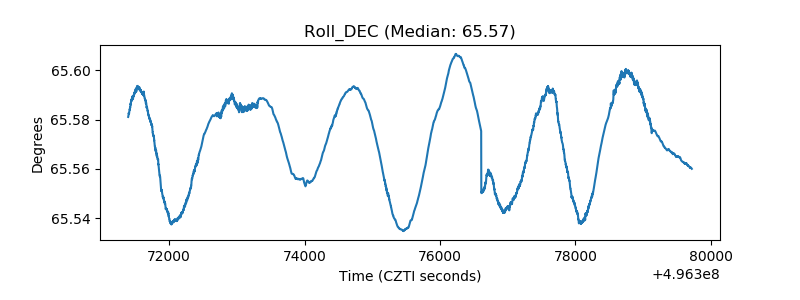 |
| _Roll_RA | 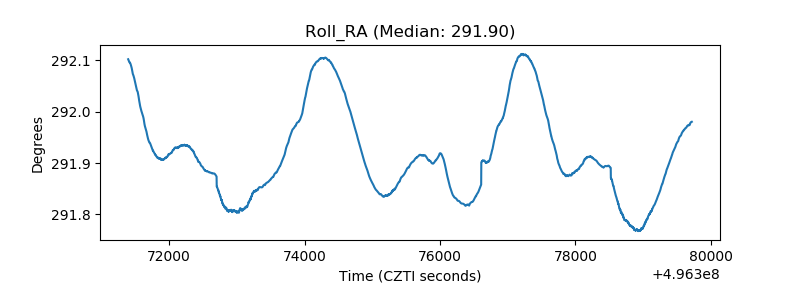 |
| Veto Counter | 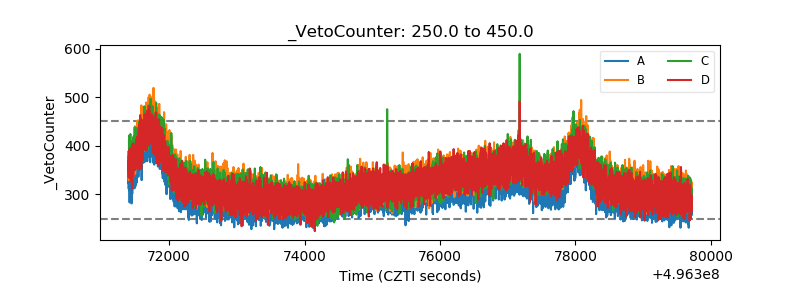 |