| Param | Original file | Final file |
|---|---|---|
| Filename | modeM0/AS1A14_041T01_9000006510_54045cztM0_level2.fits | modeM0/AS1A14_041T01_9000006510_54045cztM0_level2_quad_clean.evt |
| Size (bytes) | 1,221,338,880 | 178,067,520 |
| Size | 1.1 GB | 169.8 MB |
| Events in quadrant A | 6,420,049 | 1,276,902 |
| Events in quadrant B | 8,240,908 | 1,362,319 |
| Events in quadrant C | 9,676,897 | 1,150,180 |
| Events in quadrant D | 19,795,031 | 641,682 |
| Mode M9 | |||
|---|---|---|---|
| Quadrant | BADHDUFLAG | Total packets | Discarded packets |
| A | 0 | 3 | 0 |
| B | 0 | 3 | 0 |
| C | 0 | 3 | 0 |
| D | 0 | 3 | 0 |
| Mode SS | |||
|---|---|---|---|
| Quadrant | BADHDUFLAG | Total packets | Discarded packets |
| A | 0 | 280 | 0 |
| B | 0 | 280 | 0 |
| C | 0 | 280 | 0 |
| D | 0 | 280 | 0 |
| Mode M0 | |||
|---|---|---|---|
| Quadrant | BADHDUFLAG | Total packets | Discarded packets |
| A | 0 | 29826 | 5 |
| B | 0 | 34900 | 1 |
| C | 0 | 38814 | 1 |
| D | 0 | 68955 | 10 |
| Quadrant | Total seconds | Saturated seconds | Saturation percentage |
|---|---|---|---|
| A | 13897 | 222 | 1.597467% |
| B | 13899 | 637 | 4.583064% |
| C | 13899 | 1017 | 7.317073% |
| D | 13897 | 6021 | 43.325898% |
Noise dominated data is calculated using 1-second bins in cleaned event files. If a bin has >2000 counts, and if more than 50% of those come from <1% of pixels, then it is considered to be noise-dominated and hence unusable.
| Quadrant | # 1 sec bins | Bins with >0 counts | Bins with >2000 counts | High rate bins dominated by noise | Noise dominated (total time) | Noise dominated (detector-on time) | Marked lightcurve |
|---|---|---|---|---|---|---|---|
| A | 14199 | 13900 | 76 | 76 | 0.54% | 0.55% | 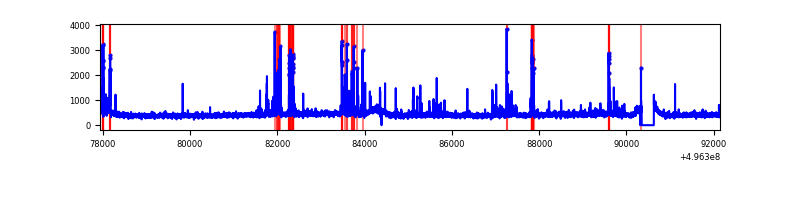 |
| B | 14199 | 13901 | 274 | 274 | 1.93% | 1.97% | 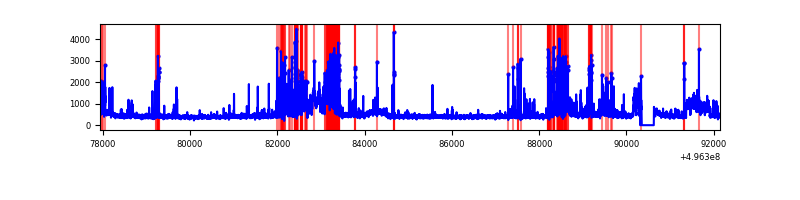 |
| C | 14199 | 13901 | 803 | 803 | 5.66% | 5.78% | 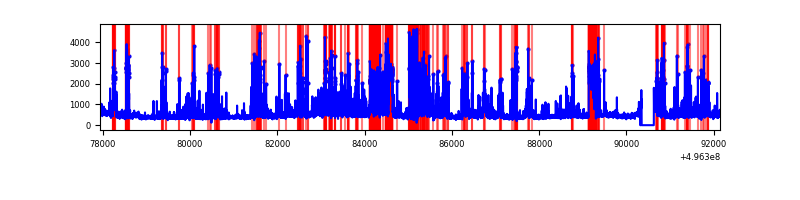 |
| D | 14198 | 13898 | 4784 | 4784 | 33.69% | 34.42% | 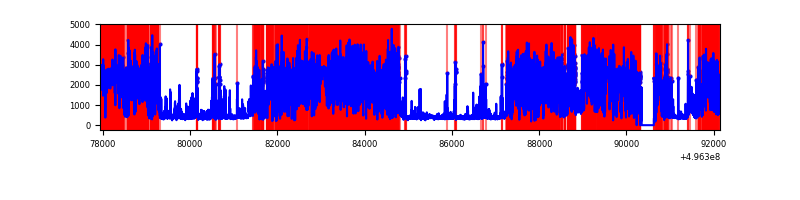 |
Top three noisy pixels from each quadrant. If the there are fewer than three noisy pixels in the level2.evt file, extra rows are filled as -1
| Pixel properties | Quadrant properties | ||||||
|---|---|---|---|---|---|---|---|
| Quadrant | DetID | PixID | Counts | Sigma | Mean | Median | Sigma |
| A | 15 | 174 | 339635 | 940.27 | 1469 | 1432 | 359.7 |
| A | 7 | 14 | 82336 | 224.93 | 1469 | 1432 | 359.7 |
| A | 13 | 248 | 50074 | 135.23 | 1469 | 1432 | 359.7 |
| B | 5 | 236 | 1053591 | 3369.32 | 1455 | 1399 | 312.3 |
| B | 5 | 185 | 712718 | 2277.78 | 1455 | 1399 | 312.3 |
| B | 4 | 171 | 242954 | 773.51 | 1455 | 1399 | 312.3 |
| C | 13 | 3 | 982797 | 2628.83 | 1383 | 1371 | 373.3 |
| C | 15 | 158 | 795787 | 2127.91 | 1383 | 1371 | 373.3 |
| C | 4 | 5 | 793058 | 2120.6 | 1383 | 1371 | 373.3 |
| D | 8 | 176 | 13799430 | 48088.85 | 1006 | 960 | 286.9 |
| D | 2 | 165 | 975997 | 3398.09 | 1006 | 960 | 286.9 |
| D | 3 | 12 | 630048 | 2192.43 | 1006 | 960 | 286.9 |
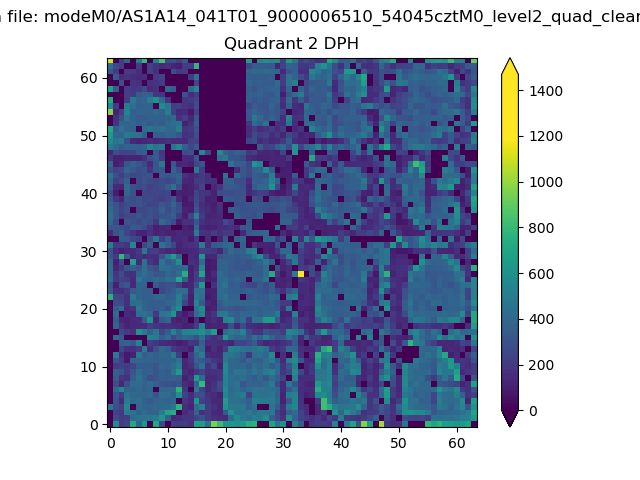
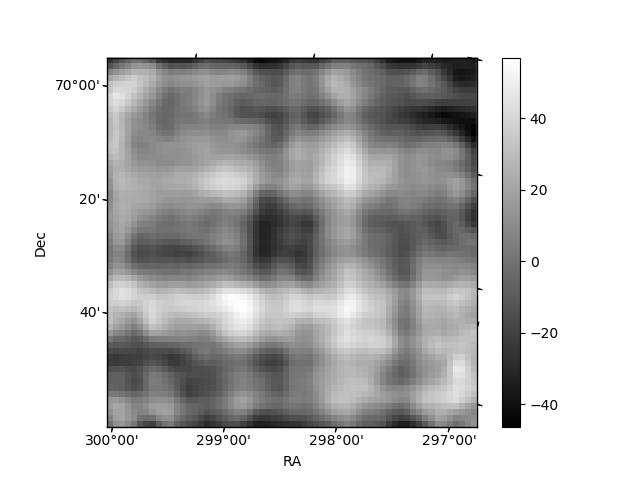
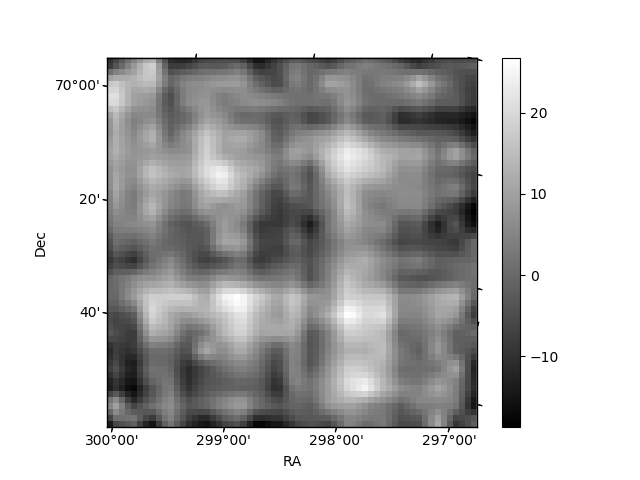
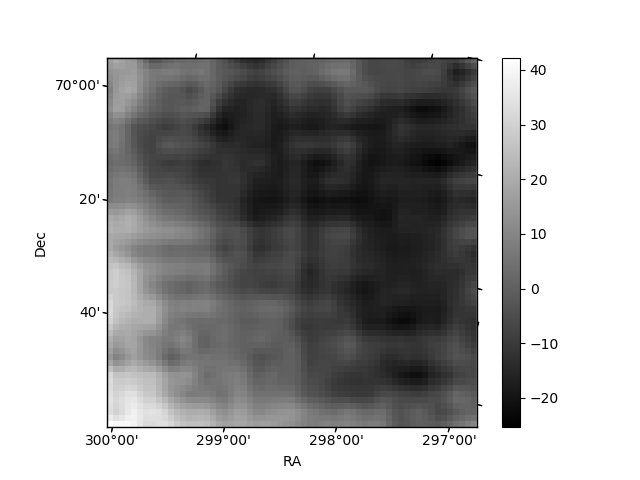
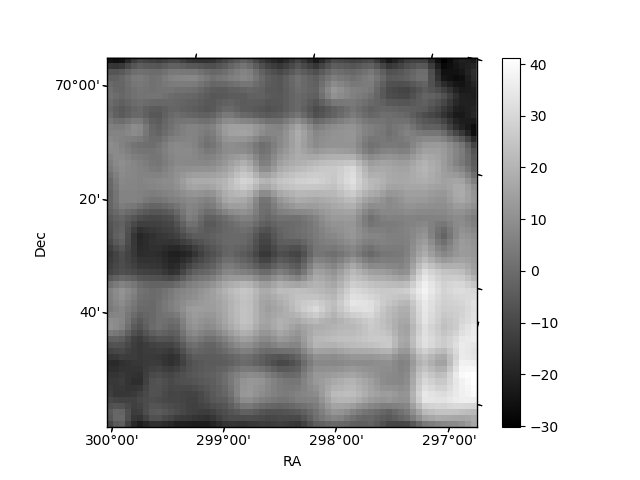
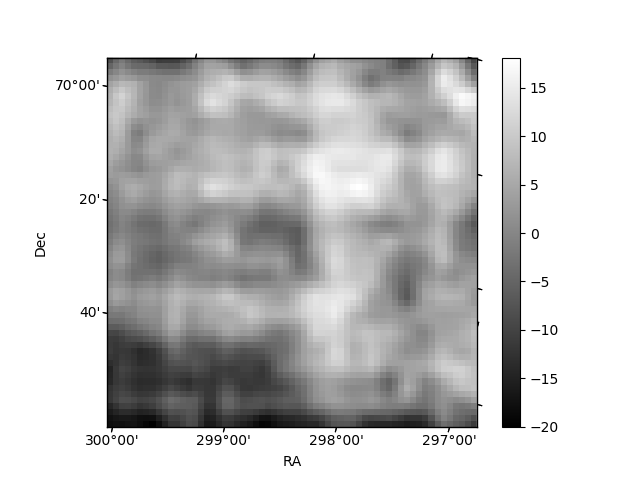
Histogram calculated using DETX and DETY for each event in the final _common_clean file
| Quadrant A | 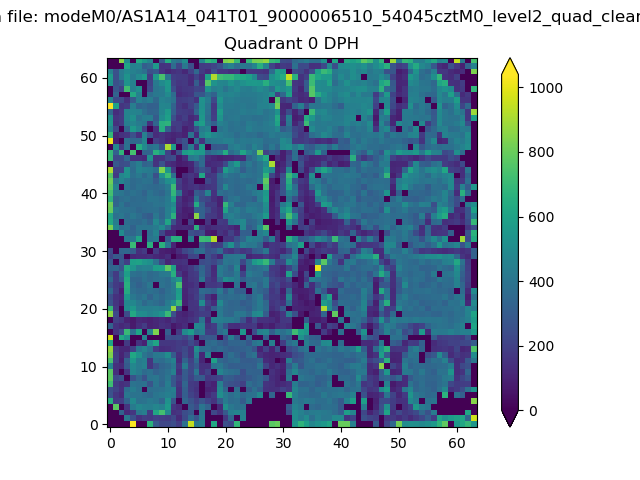 |
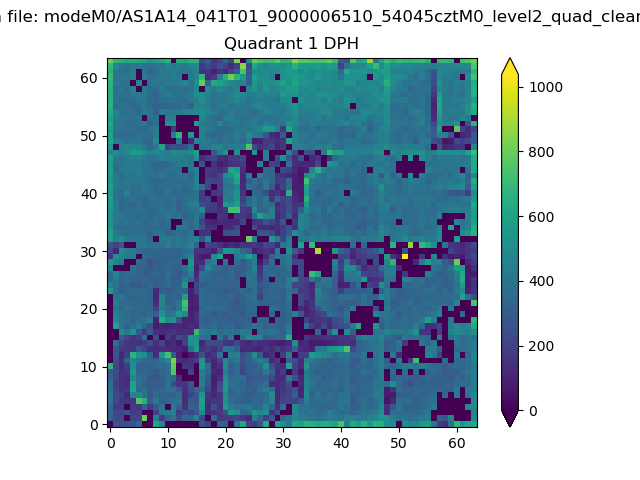 |
Quadrant B |
|---|---|---|---|
| Quadrant D | 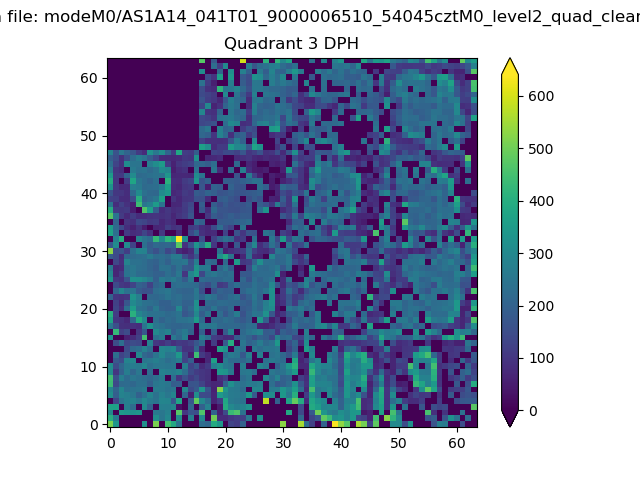 |
 |
Quadrant C |
| Plot type | Count rate plots | Images |
|---|---|---|
| Comparison with Poisson distribution Blue bars denote a histogram of data divided into 1 sec bins. Red curve is a Poisson curve with rate = median count rate of data. |
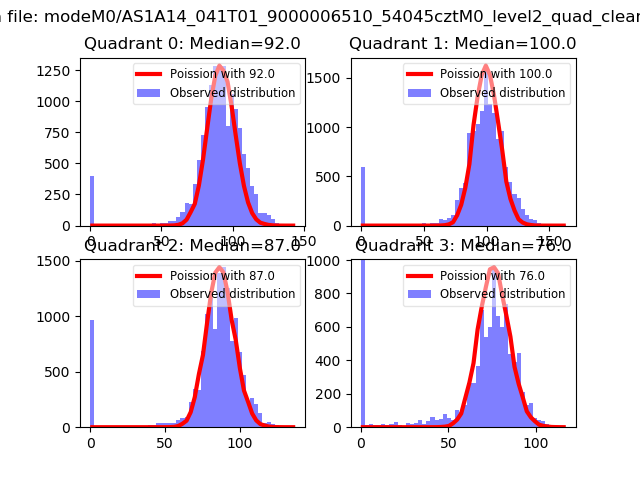 |
 |
| Quadrant-wise count rates Data is divided into 100 sec bins |
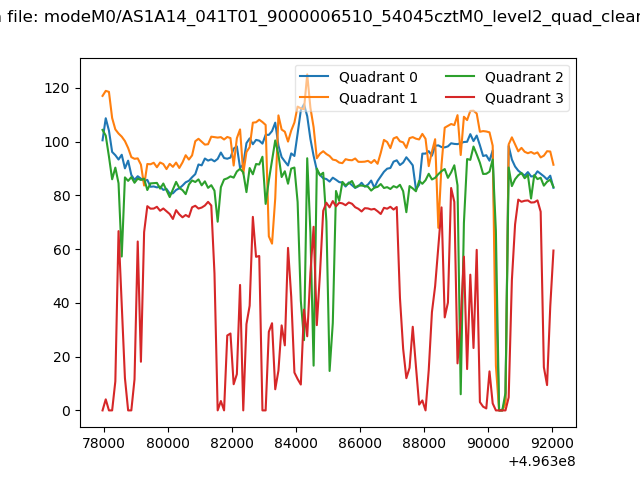 |
|
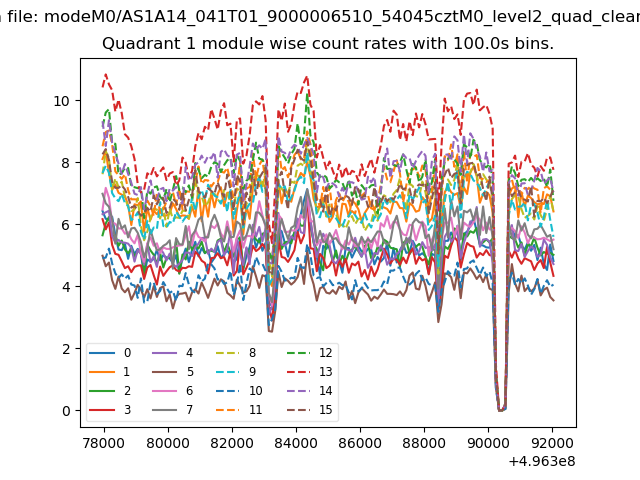
| Module-wise count rates for Quadrant A Data is divided into 100 sec bins |
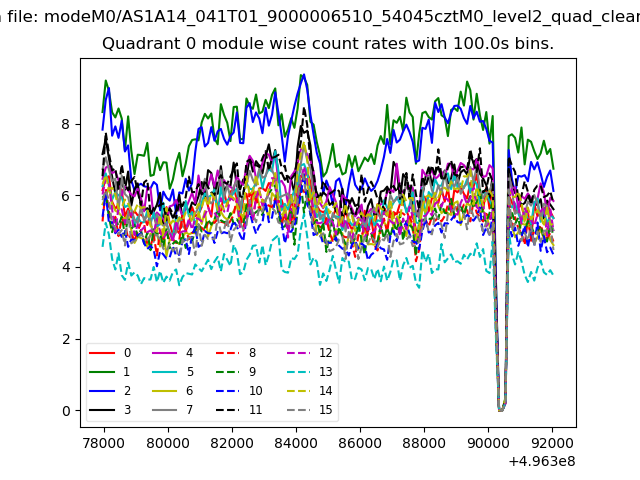 |
 |
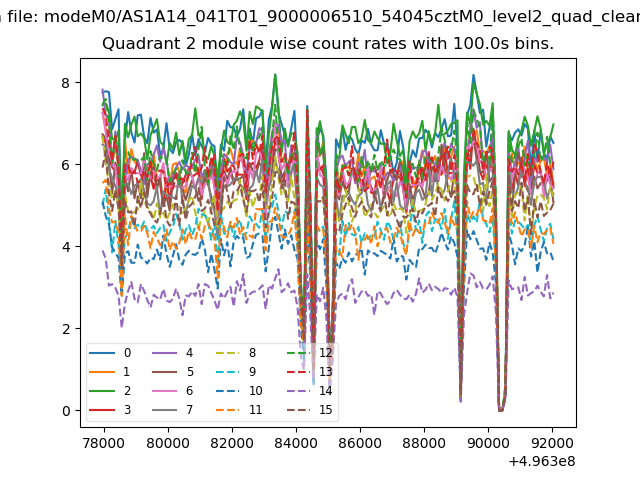
| Module-wise count rates for Quadrant B Data is divided into 100 sec bins |
 |
 |
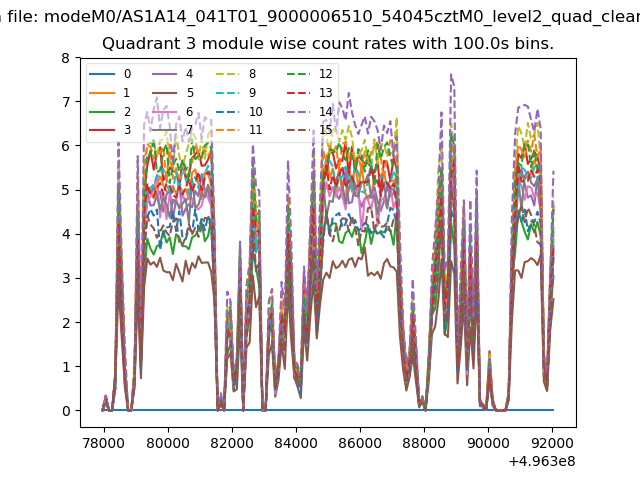
| Module-wise count rates for Quadrant C Data is divided into 100 sec bins |
 |
 |
| Module-wise count rates for Quadrant D Data is divided into 100 sec bins |
 |
 |
| Parameter | Plot |
|---|---|
| CZT HV Monitor | 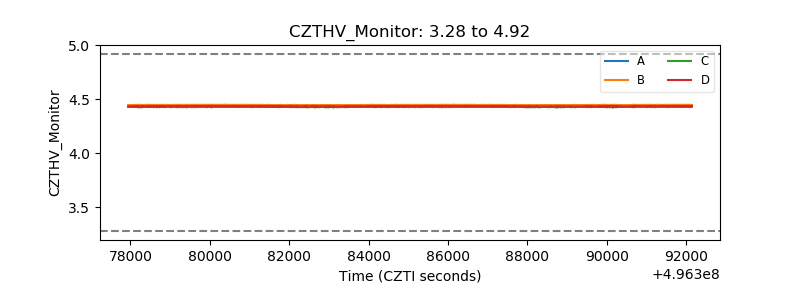 |
| D_VDD | 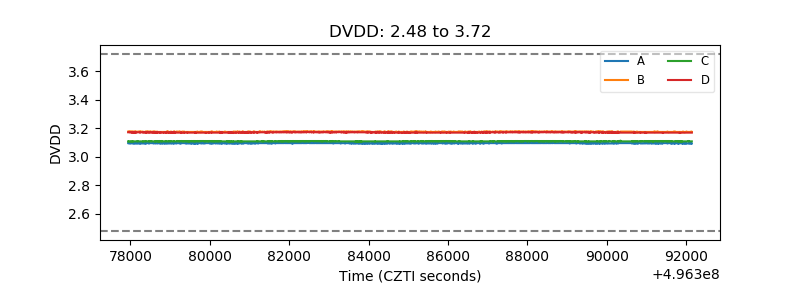 |
| Temperature 1 | 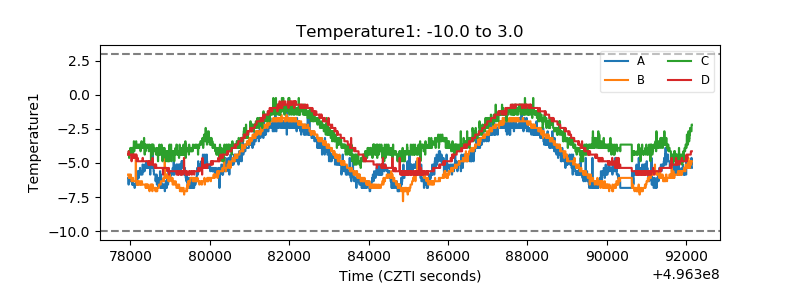 |
| Veto HV Monitor | 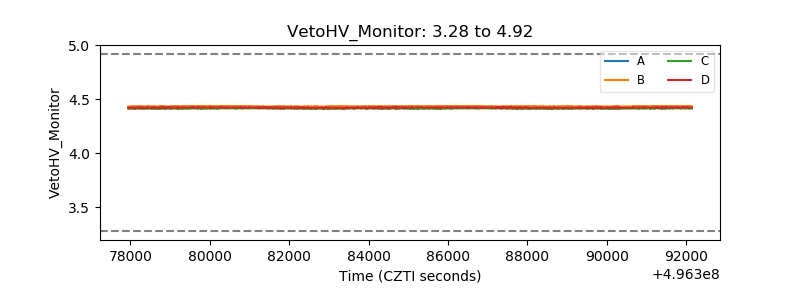 |
| Veto LLD | 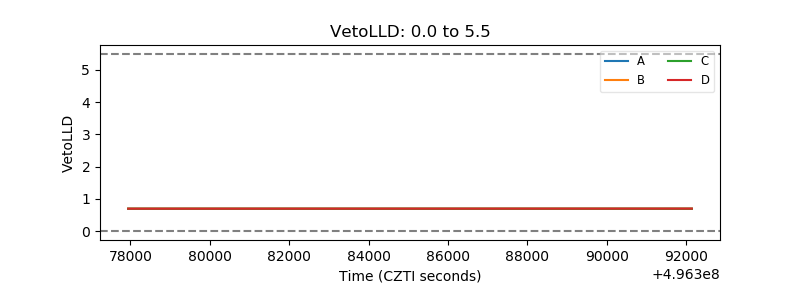 |
| Alpha Counter | 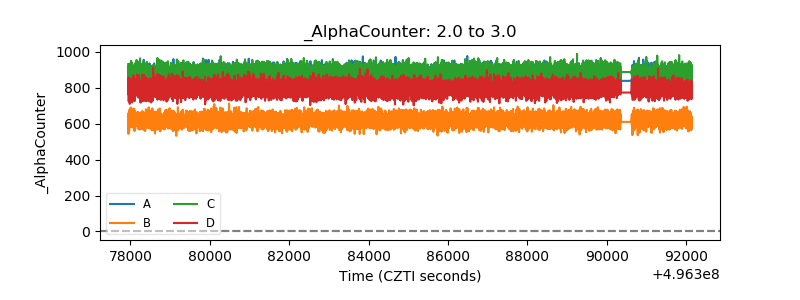 |
| _CPM_Rate | 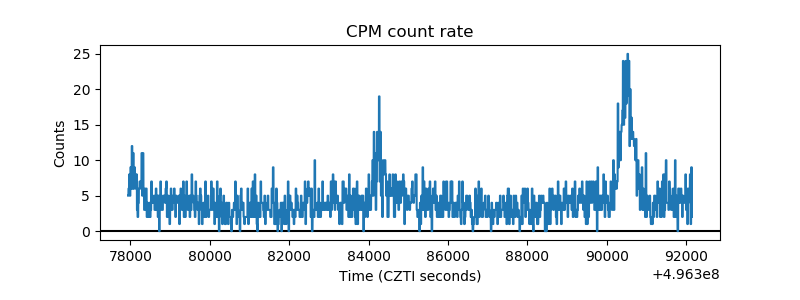 |
| CZT Counter | 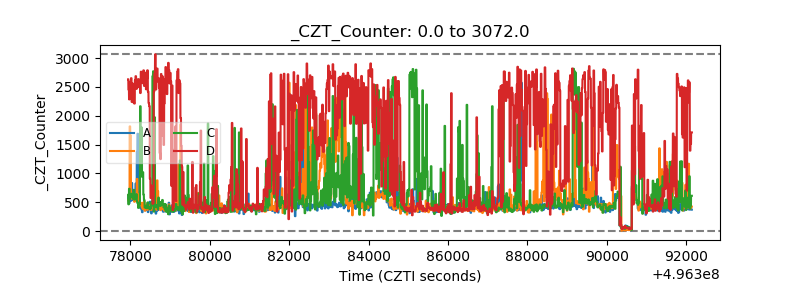 |
| +2.5 Volts monitor |  |
| +5 Volts monitor |  |
| _ROLL_ROT | 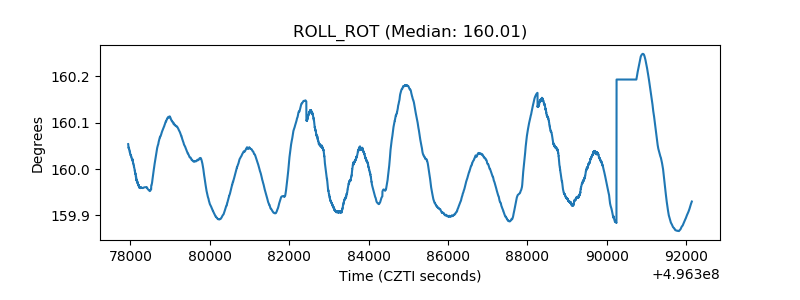 |
| _Roll_DEC | 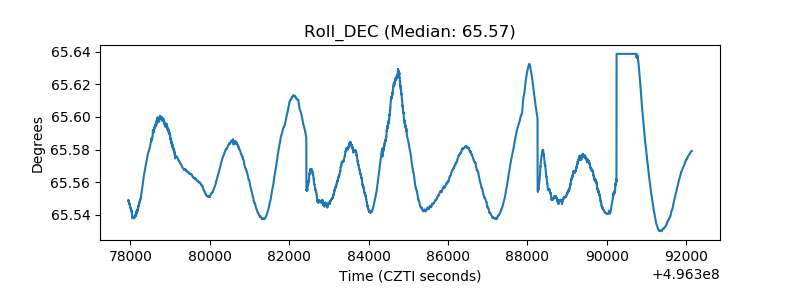 |
| _Roll_RA | 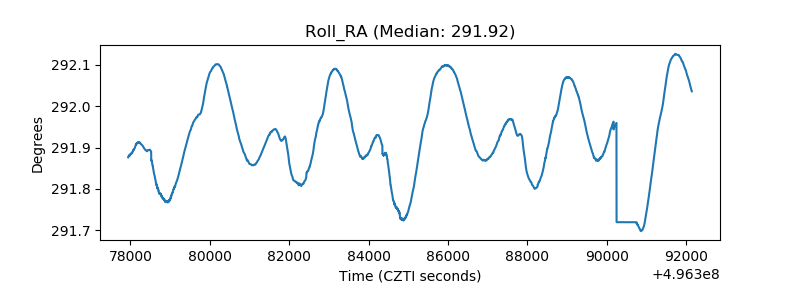 |
| Veto Counter | 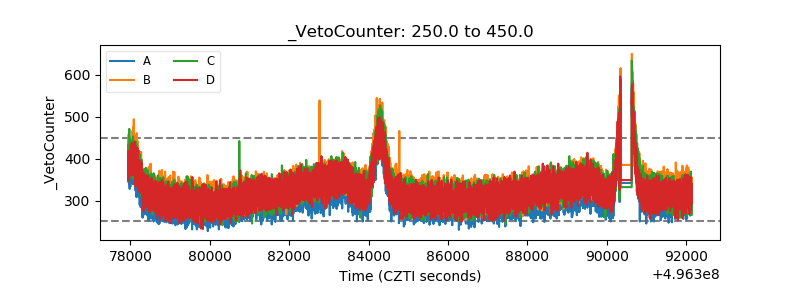 |