| Param | Original file | Final file |
|---|---|---|
| Filename | modeM0/AS1A14_041T01_9000006510_54046cztM0_level2.fits | modeM0/AS1A14_041T01_9000006510_54046cztM0_level2_quad_clean.evt |
| Size (bytes) | 1,126,249,920 | 150,137,280 |
| Size | 1.0 GB | 143.2 MB |
| Events in quadrant A | 6,761,530 | 1,085,437 |
| Events in quadrant B | 7,488,901 | 1,187,791 |
| Events in quadrant C | 6,791,915 | 1,023,090 |
| Events in quadrant D | 19,719,466 | 421,349 |
| Mode M9 | |||
|---|---|---|---|
| Quadrant | BADHDUFLAG | Total packets | Discarded packets |
| A | 0 | 12 | 0 |
| B | 0 | 12 | 0 |
| C | 0 | 12 | 0 |
| D | 0 | 12 | 0 |
| Mode SS | |||
|---|---|---|---|
| Quadrant | BADHDUFLAG | Total packets | Discarded packets |
| A | 0 | 244 | 0 |
| B | 0 | 244 | 0 |
| C | 0 | 244 | 0 |
| D | 0 | 244 | 0 |
| Mode M0 | |||
|---|---|---|---|
| Quadrant | BADHDUFLAG | Total packets | Discarded packets |
| A | 0 | 28796 | 2 |
| B | 0 | 30275 | 2 |
| C | 0 | 29029 | 2 |
| D | 0 | 66845 | 2 |
| Quadrant | Total seconds | Saturated seconds | Saturation percentage |
|---|---|---|---|
| A | 11967 | 356 | 2.974847% |
| B | 11967 | 373 | 3.116905% |
| C | 11968 | 432 | 3.609626% |
| D | 11968 | 7140 | 59.659091% |
Noise dominated data is calculated using 1-second bins in cleaned event files. If a bin has >2000 counts, and if more than 50% of those come from <1% of pixels, then it is considered to be noise-dominated and hence unusable.
| Quadrant | # 1 sec bins | Bins with >0 counts | Bins with >2000 counts | High rate bins dominated by noise | Noise dominated (total time) | Noise dominated (detector-on time) | Marked lightcurve |
|---|---|---|---|---|---|---|---|
| A | 13242 | 11968 | 187 | 187 | 1.41% | 1.56% | 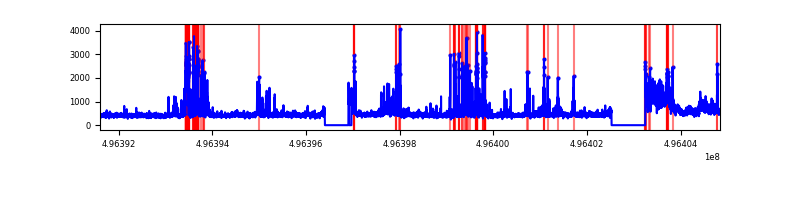 |
| B | 13242 | 11968 | 124 | 124 | 0.94% | 1.04% | 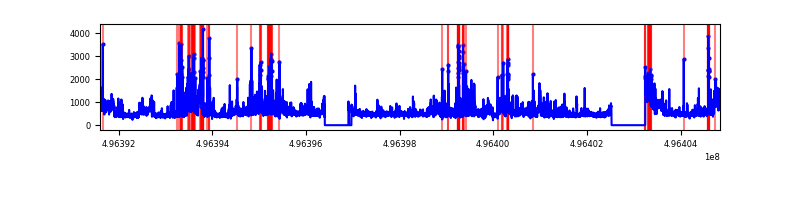 |
| C | 13243 | 11971 | 244 | 244 | 1.84% | 2.04% | 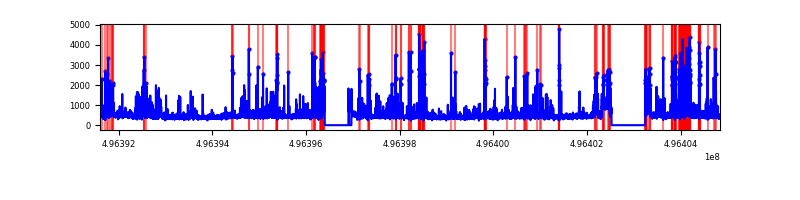 |
| D | 13242 | 11967 | 5112 | 5112 | 38.60% | 42.72% | 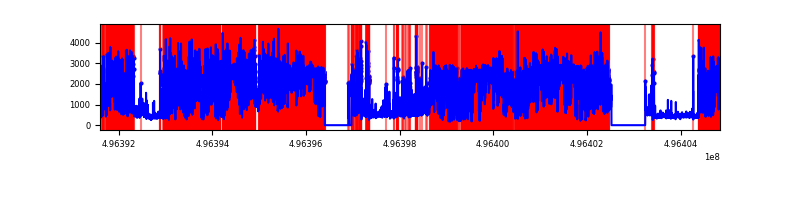 |
Top three noisy pixels from each quadrant. If the there are fewer than three noisy pixels in the level2.evt file, extra rows are filled as -1
| Pixel properties | Quadrant properties | ||||||
|---|---|---|---|---|---|---|---|
| Quadrant | DetID | PixID | Counts | Sigma | Mean | Median | Sigma |
| A | 15 | 174 | 754704 | 2433.59 | 1251 | 1217 | 309.6 |
| A | 12 | 115 | 735415 | 2371.29 | 1251 | 1217 | 309.6 |
| A | 3 | 14 | 102243 | 326.29 | 1251 | 1217 | 309.6 |
| B | 5 | 236 | 961618 | 3632.07 | 1244 | 1202 | 264.4 |
| B | 4 | 173 | 600130 | 2265.0 | 1244 | 1202 | 264.4 |
| B | 15 | 20 | 291750 | 1098.78 | 1244 | 1202 | 264.4 |
| C | 13 | 3 | 1174143 | 3572.6 | 1203 | 1190 | 328.3 |
| C | 4 | 5 | 262713 | 796.55 | 1203 | 1190 | 328.3 |
| C | 9 | 38 | 188416 | 570.26 | 1203 | 1190 | 328.3 |
| D | 8 | 176 | 13193873 | 63944.85 | 719 | 686 | 206.3 |
| D | 2 | 165 | 1514049 | 7334.98 | 719 | 686 | 206.3 |
| D | 7 | 70 | 1129564 | 5471.46 | 719 | 686 | 206.3 |
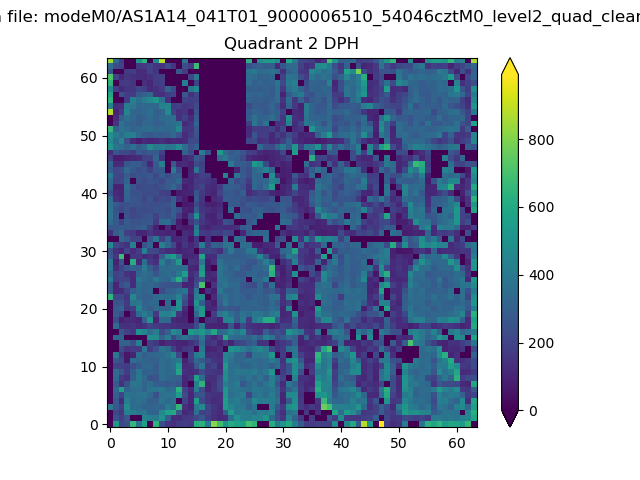
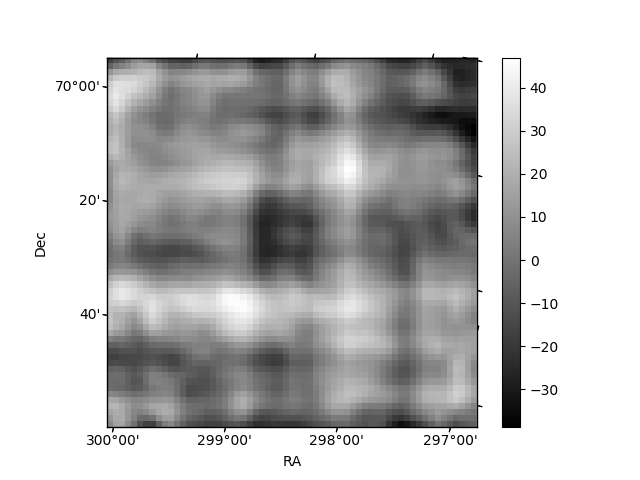
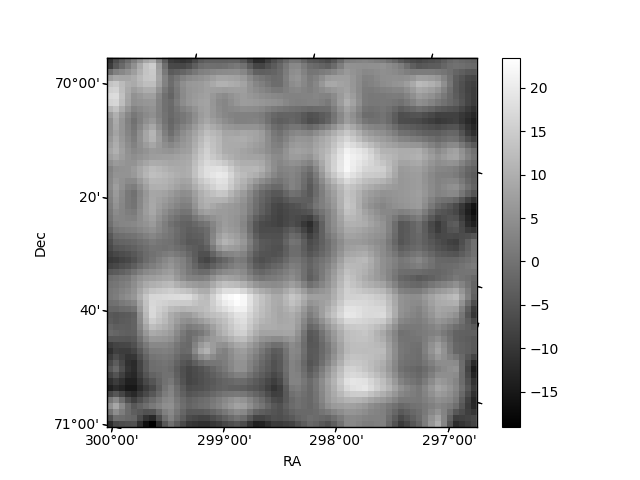
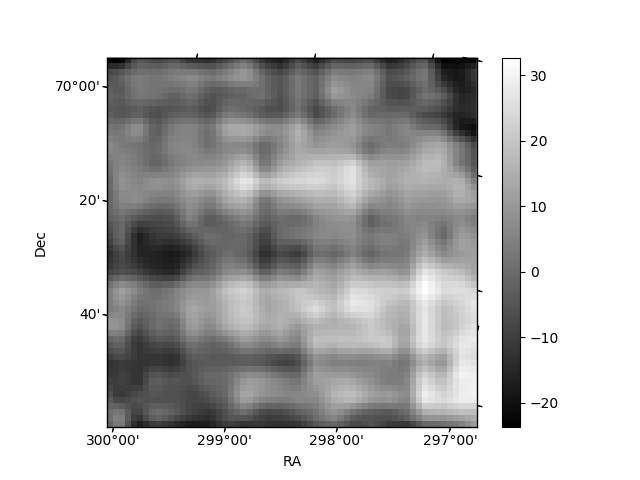
Histogram calculated using DETX and DETY for each event in the final _common_clean file
| Quadrant A | 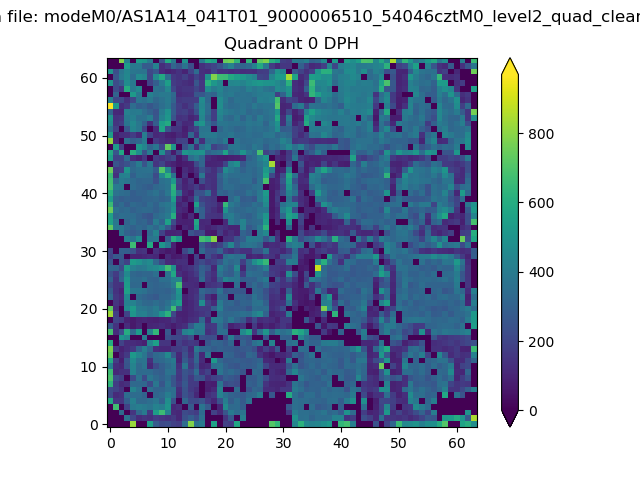 |
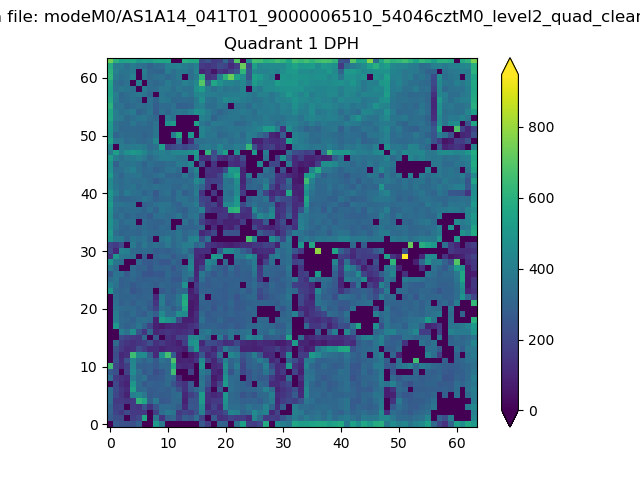 |
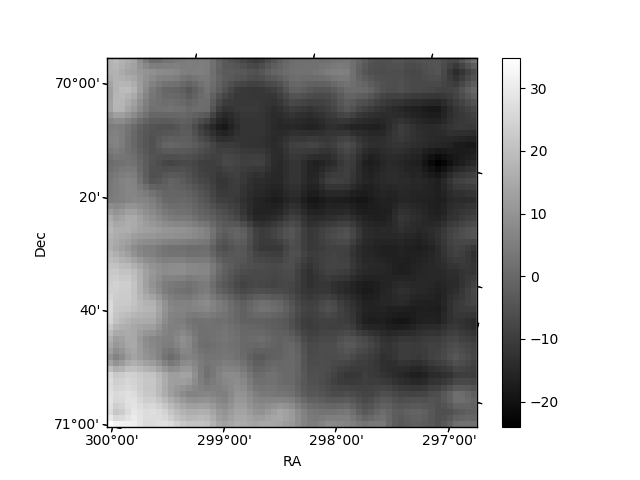
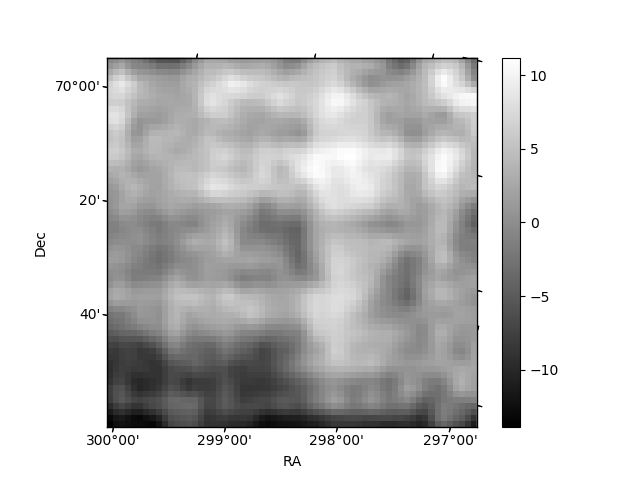
Quadrant B |
|---|---|---|---|
| Quadrant D | 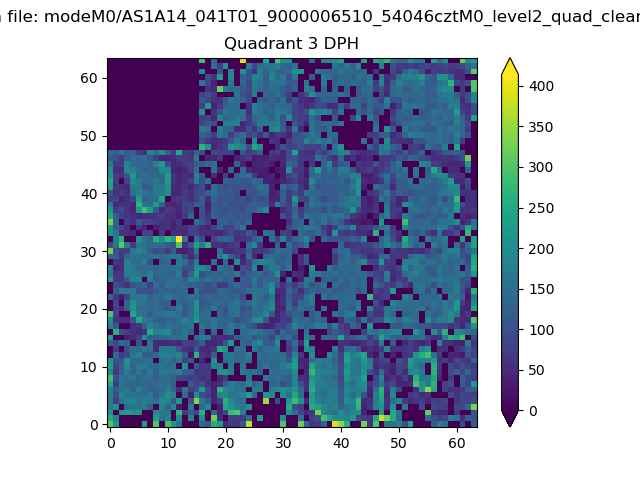 |
 |
Quadrant C |
| Plot type | Count rate plots | Images |
|---|---|---|
| Comparison with Poisson distribution Blue bars denote a histogram of data divided into 1 sec bins. Red curve is a Poisson curve with rate = median count rate of data. |
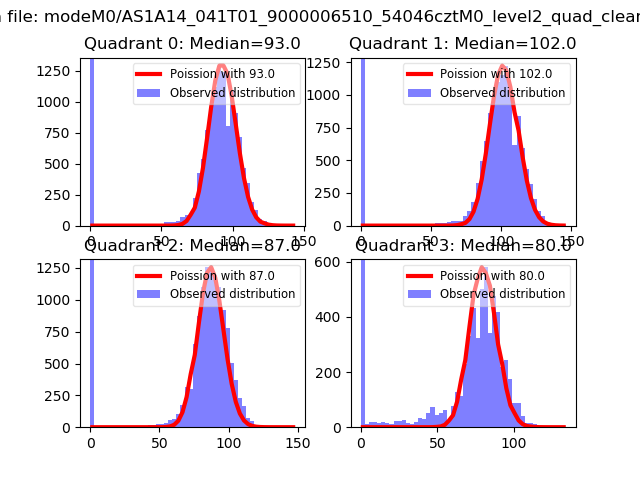 |
 |
| Quadrant-wise count rates Data is divided into 100 sec bins |
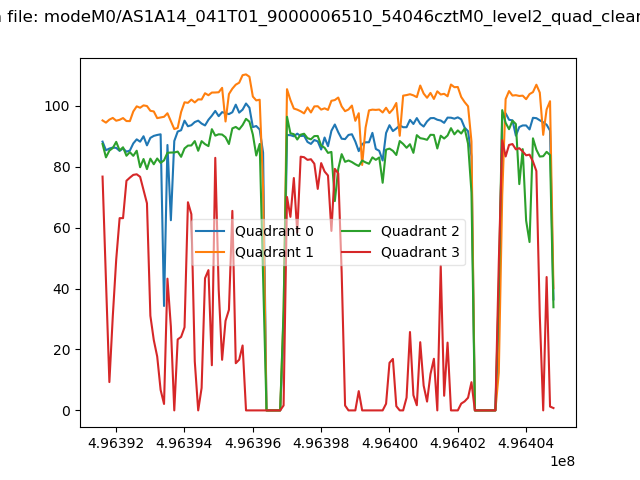 |
|
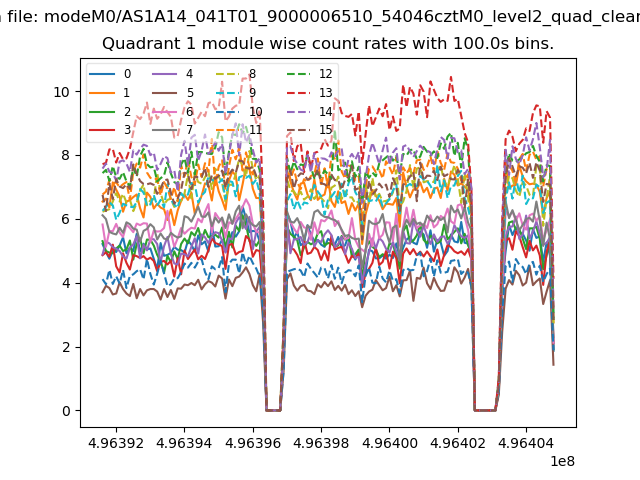
| Module-wise count rates for Quadrant A Data is divided into 100 sec bins |
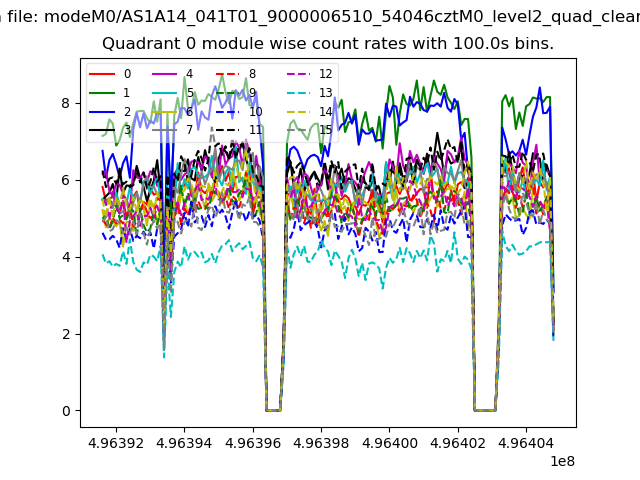 |
 |
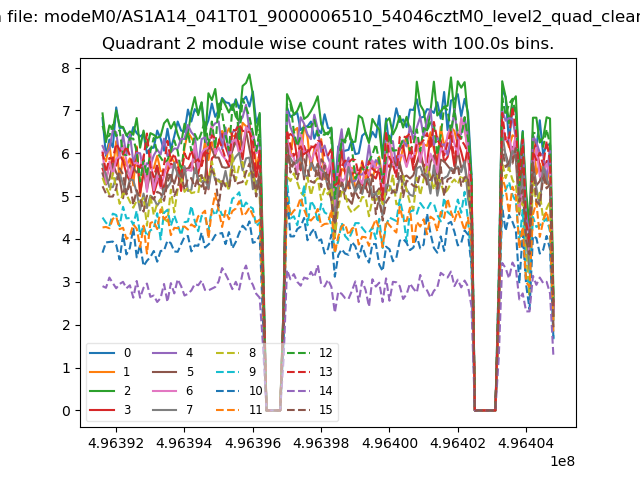
| Module-wise count rates for Quadrant B Data is divided into 100 sec bins |
 |
 |
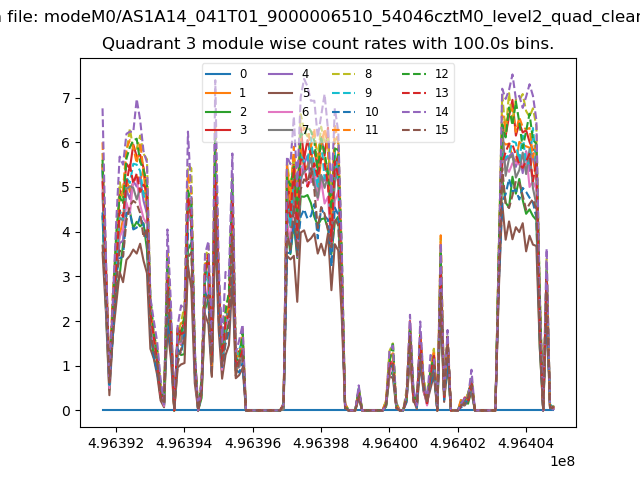
| Module-wise count rates for Quadrant C Data is divided into 100 sec bins |
 |
 |
| Module-wise count rates for Quadrant D Data is divided into 100 sec bins |
 |
 |
| Parameter | Plot |
|---|---|
| CZT HV Monitor | 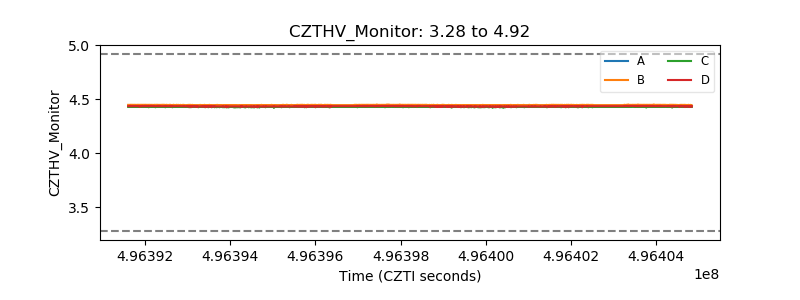 |
| D_VDD | 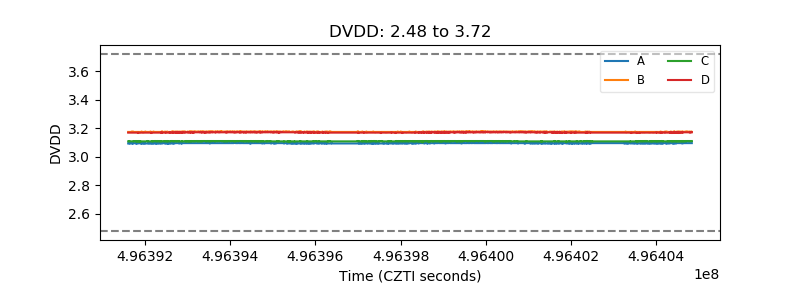 |
| Temperature 1 | 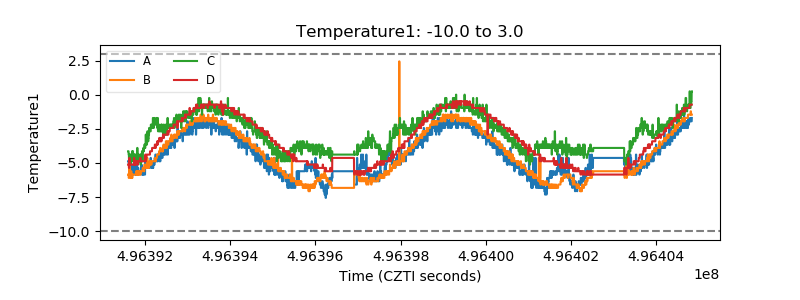 |
| Veto HV Monitor | 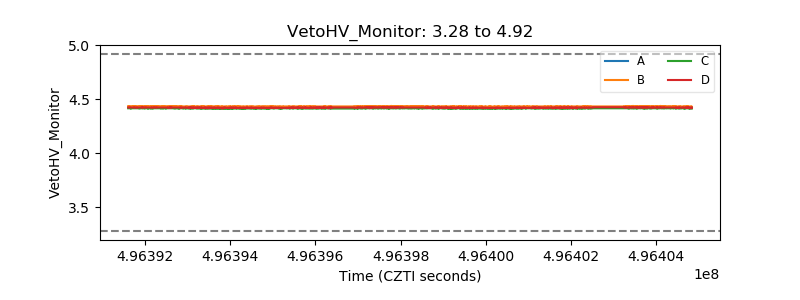 |
| Veto LLD | 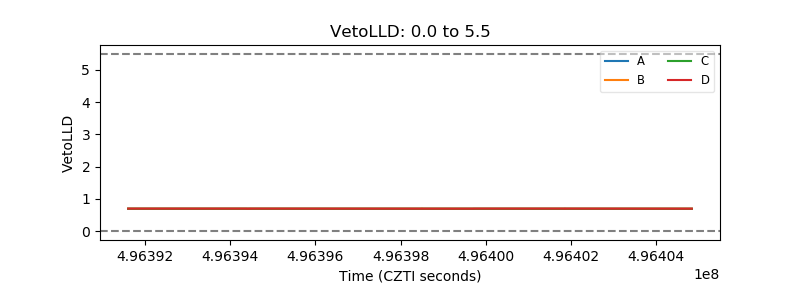 |
| Alpha Counter | 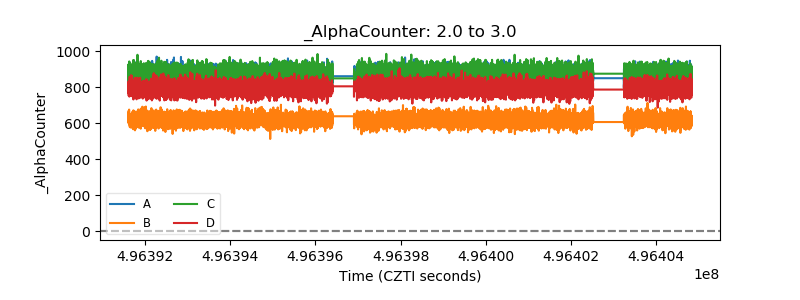 |
| _CPM_Rate | 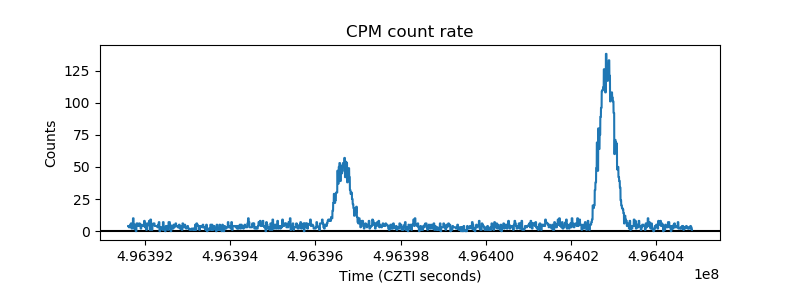 |
| CZT Counter | 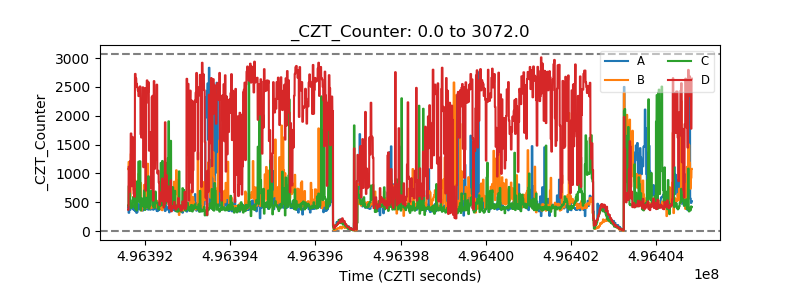 |
| +2.5 Volts monitor |  |
| +5 Volts monitor |  |
| _ROLL_ROT | 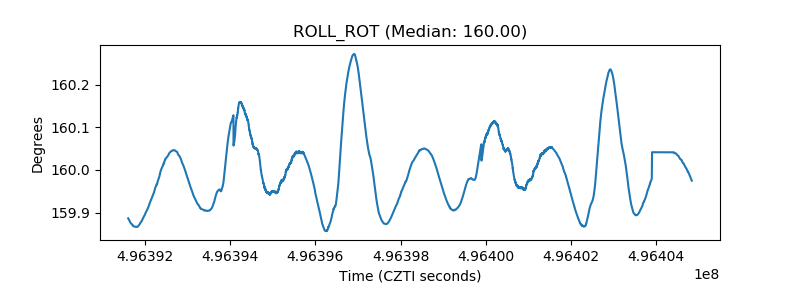 |
| _Roll_DEC | 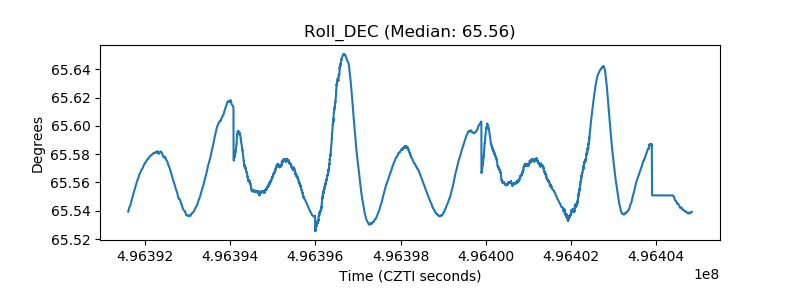 |
| _Roll_RA | 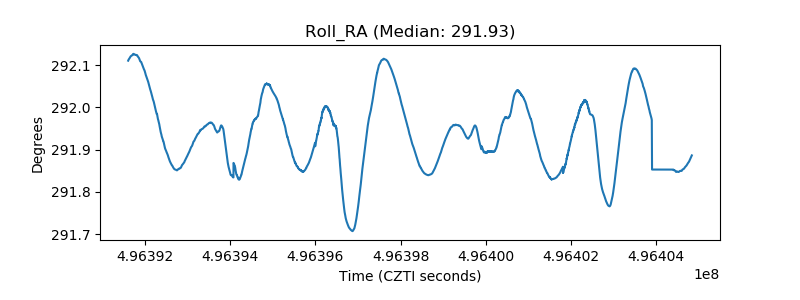 |
| Veto Counter | 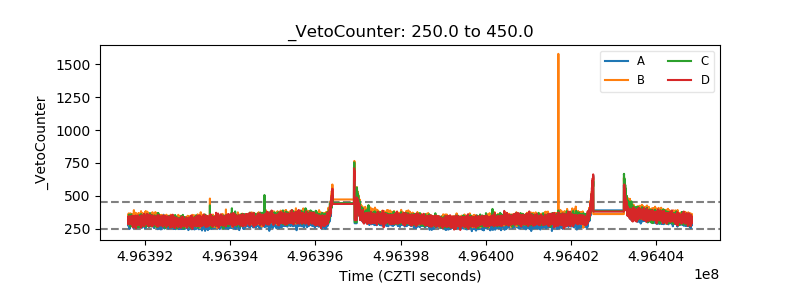 |