| Param | Original file | Final file |
|---|---|---|
| Filename | modeM0/AS1A14_041T01_9000006510_54047cztM0_level2.fits | modeM0/AS1A14_041T01_9000006510_54047cztM0_level2_quad_clean.evt |
| Size (bytes) | 628,894,080 | 80,444,160 |
| Size | 599.8 MB | 76.7 MB |
| Events in quadrant A | 3,751,439 | 588,796 |
| Events in quadrant B | 4,371,541 | 637,883 |
| Events in quadrant C | 4,053,671 | 535,253 |
| Events in quadrant D | 10,611,511 | 232,828 |
| Mode M9 | |||
|---|---|---|---|
| Quadrant | BADHDUFLAG | Total packets | Discarded packets |
| A | 0 | 9 | 0 |
| B | 0 | 9 | 0 |
| C | 0 | 9 | 0 |
| D | 0 | 9 | 0 |
| Mode SS | |||
|---|---|---|---|
| Quadrant | BADHDUFLAG | Total packets | Discarded packets |
| A | 0 | 128 | 0 |
| B | 0 | 128 | 0 |
| C | 0 | 128 | 0 |
| D | 0 | 128 | 0 |
| Mode M0 | |||
|---|---|---|---|
| Quadrant | BADHDUFLAG | Total packets | Discarded packets |
| A | 0 | 15643 | 2 |
| B | 0 | 17154 | 1 |
| C | 0 | 16677 | 1 |
| D | 0 | 35893 | 1 |
| Quadrant | Total seconds | Saturated seconds | Saturation percentage |
|---|---|---|---|
| A | 6318 | 273 | 4.320988% |
| B | 6318 | 307 | 4.859133% |
| C | 6318 | 453 | 7.169991% |
| D | 6318 | 3774 | 59.734093% |
Noise dominated data is calculated using 1-second bins in cleaned event files. If a bin has >2000 counts, and if more than 50% of those come from <1% of pixels, then it is considered to be noise-dominated and hence unusable.
| Quadrant | # 1 sec bins | Bins with >0 counts | Bins with >2000 counts | High rate bins dominated by noise | Noise dominated (total time) | Noise dominated (detector-on time) | Marked lightcurve |
|---|---|---|---|---|---|---|---|
| A | 7218 | 6319 | 213 | 213 | 2.95% | 3.37% | 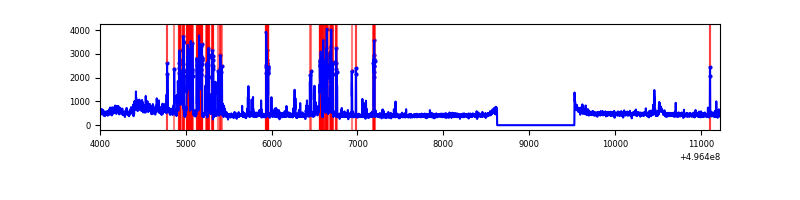 |
| B | 7218 | 6318 | 196 | 196 | 2.72% | 3.10% | 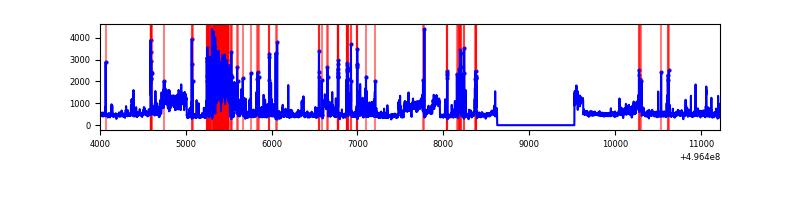 |
| C | 7218 | 6319 | 294 | 294 | 4.07% | 4.65% | 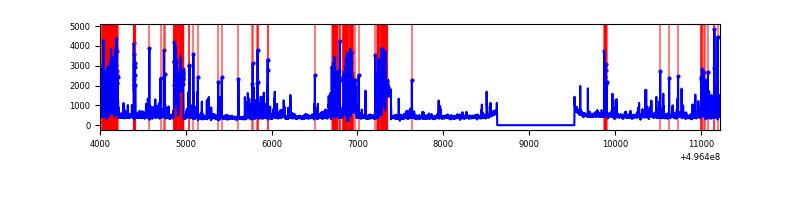 |
| D | 7217 | 6318 | 2868 | 2868 | 39.74% | 45.39% | 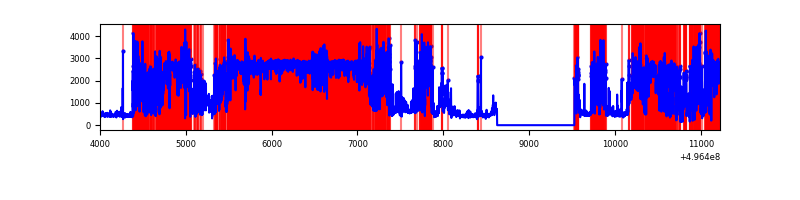 |
Top three noisy pixels from each quadrant. If the there are fewer than three noisy pixels in the level2.evt file, extra rows are filled as -1
| Pixel properties | Quadrant properties | ||||||
|---|---|---|---|---|---|---|---|
| Quadrant | DetID | PixID | Counts | Sigma | Mean | Median | Sigma |
| A | 15 | 174 | 735658 | 4511.06 | 661 | 646 | 162.9 |
| A | 12 | 115 | 222667 | 1362.63 | 661 | 646 | 162.9 |
| A | 3 | 14 | 53256 | 322.89 | 661 | 646 | 162.9 |
| B | 5 | 236 | 788098 | 5643.95 | 653 | 628 | 139.5 |
| B | 5 | 185 | 256917 | 1836.87 | 653 | 628 | 139.5 |
| B | 4 | 171 | 221845 | 1585.5 | 653 | 628 | 139.5 |
| C | 13 | 3 | 643323 | 3792.38 | 622 | 615 | 169.5 |
| C | 9 | 38 | 517119 | 3047.7 | 622 | 615 | 169.5 |
| C | 4 | 5 | 206982 | 1217.69 | 622 | 615 | 169.5 |
| D | 8 | 176 | 8441070 | 77902.91 | 374 | 357 | 108.3 |
| D | 2 | 62 | 279751 | 2578.65 | 374 | 357 | 108.3 |
| D | 3 | 12 | 171291 | 1577.62 | 374 | 357 | 108.3 |
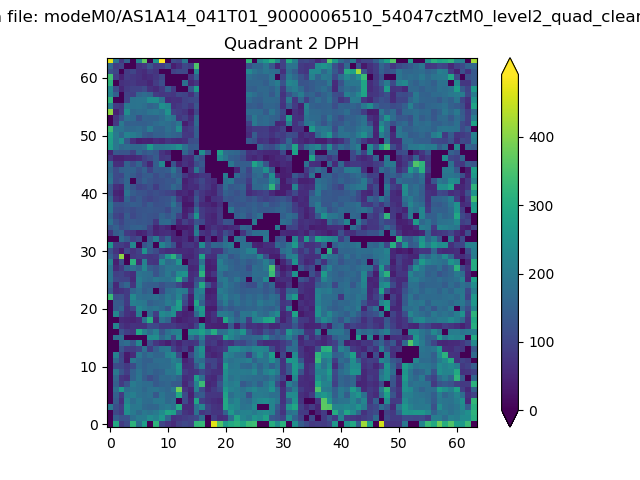
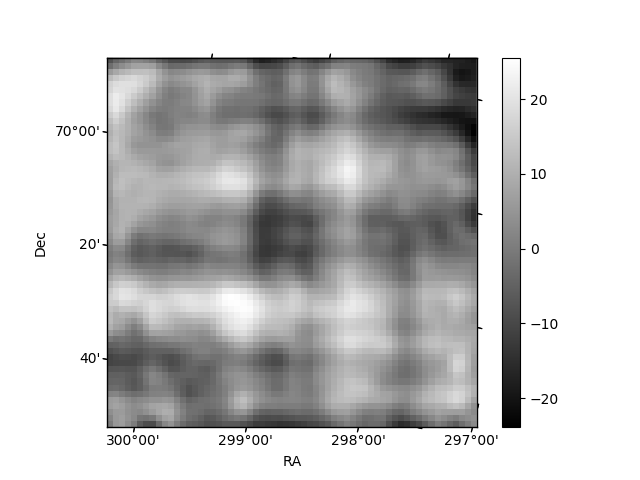
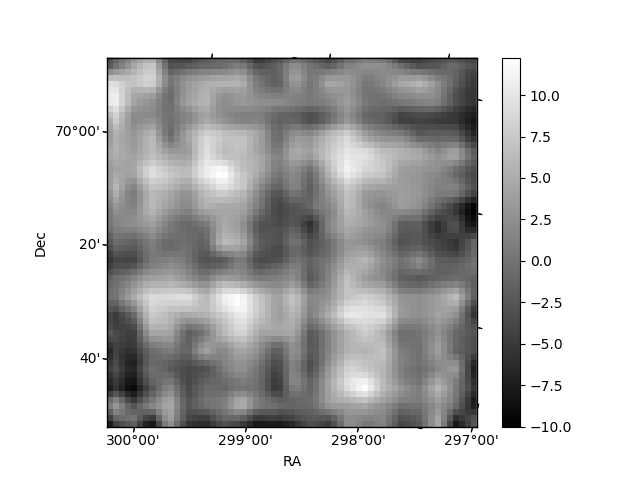
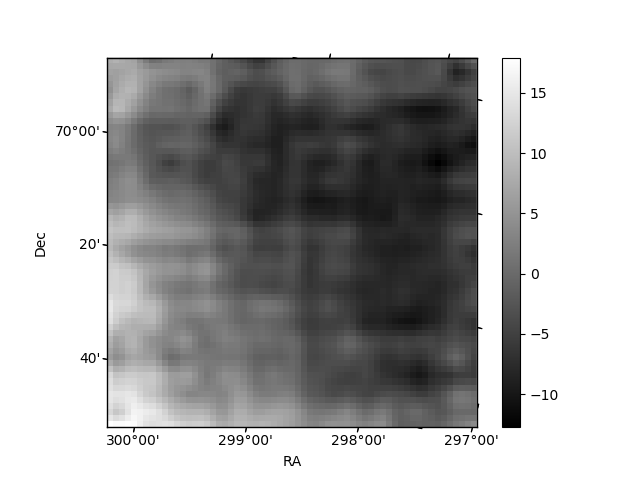
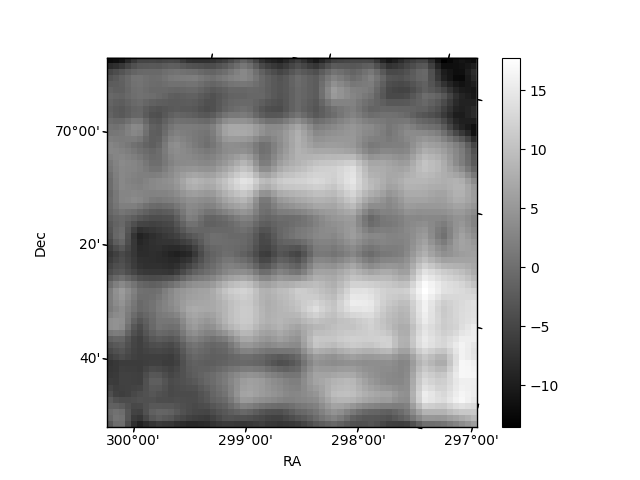
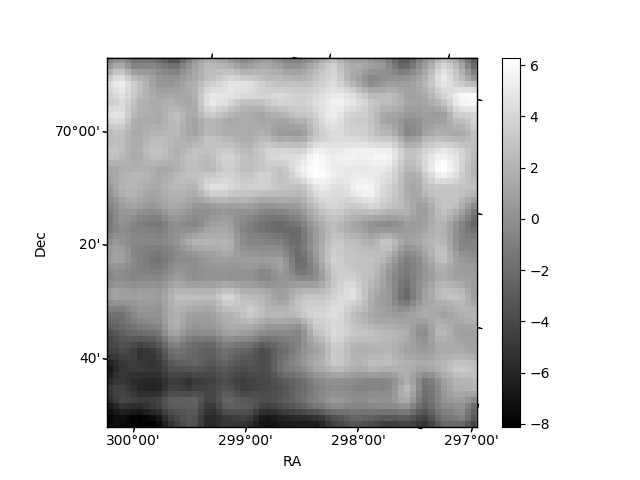
Histogram calculated using DETX and DETY for each event in the final _common_clean file
| Quadrant A | 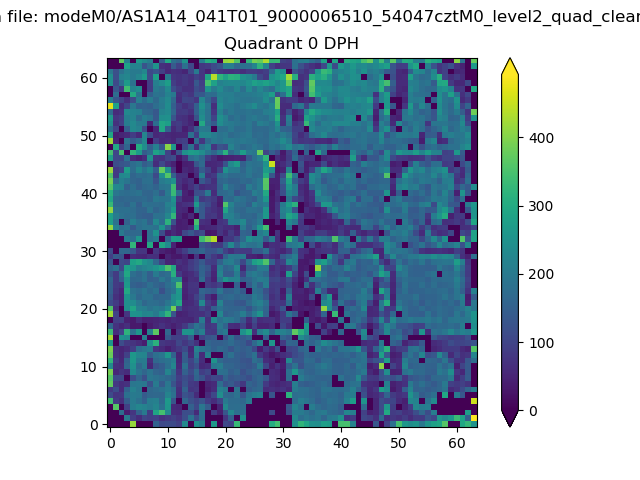 |
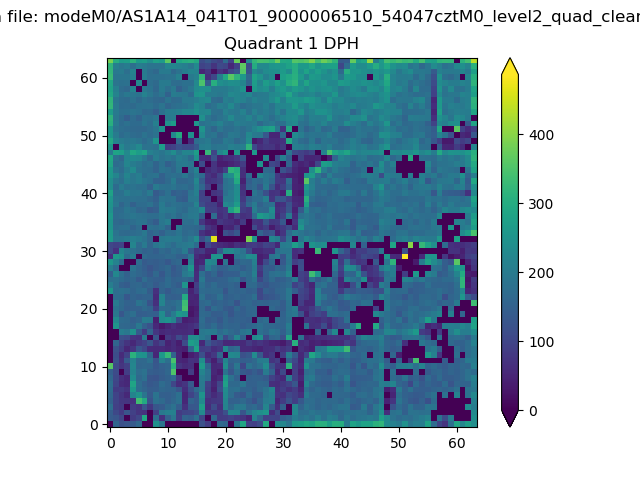 |
Quadrant B |
|---|---|---|---|
| Quadrant D | 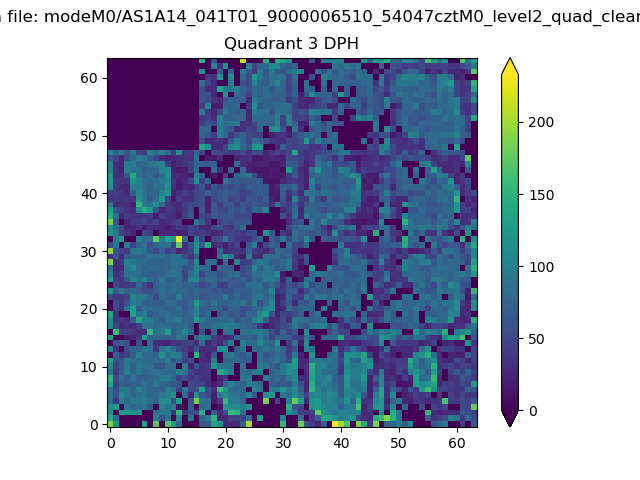 |
 |
Quadrant C |
| Plot type | Count rate plots | Images |
|---|---|---|
| Comparison with Poisson distribution Blue bars denote a histogram of data divided into 1 sec bins. Red curve is a Poisson curve with rate = median count rate of data. |
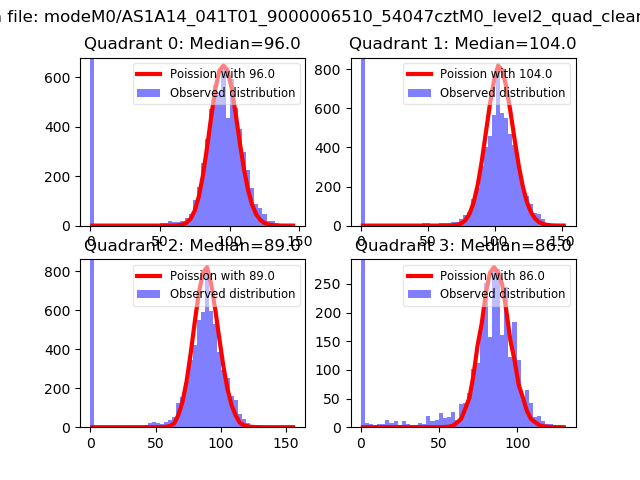 |
 |
| Quadrant-wise count rates Data is divided into 100 sec bins |
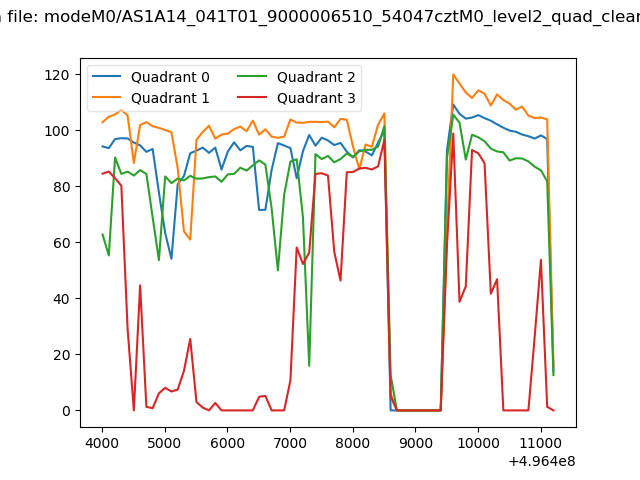 |
|
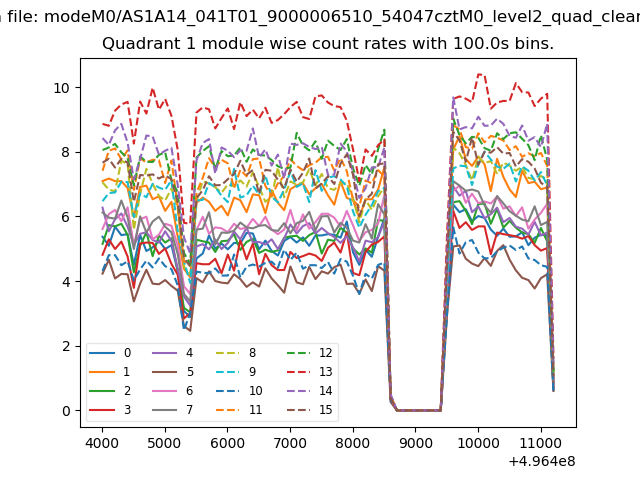
| Module-wise count rates for Quadrant A Data is divided into 100 sec bins |
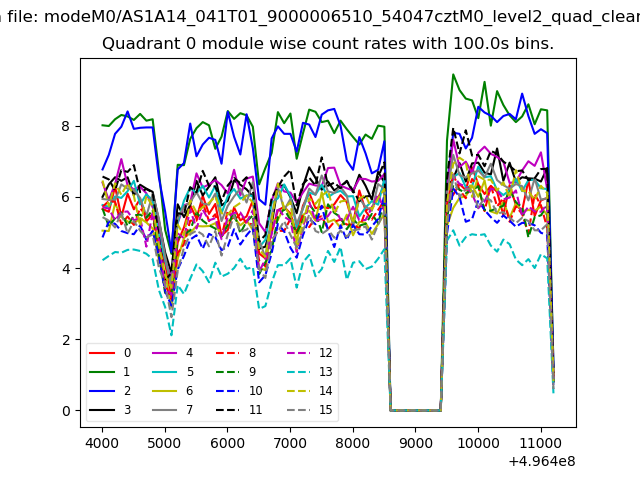 |
 |
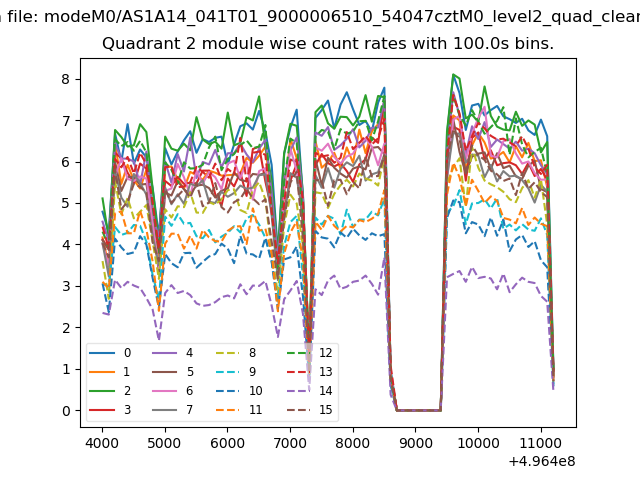
| Module-wise count rates for Quadrant B Data is divided into 100 sec bins |
 |
 |
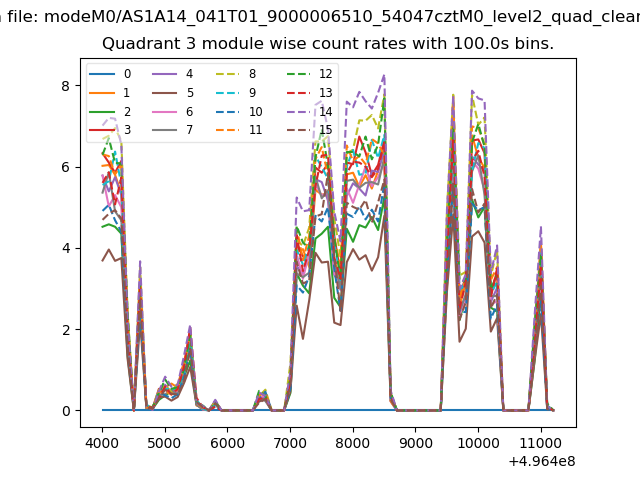
| Module-wise count rates for Quadrant C Data is divided into 100 sec bins |
 |
 |
| Module-wise count rates for Quadrant D Data is divided into 100 sec bins |
 |
 |
| Parameter | Plot |
|---|---|
| CZT HV Monitor | 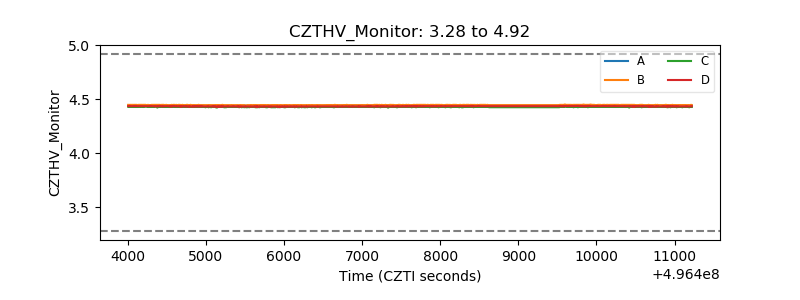 |
| D_VDD | 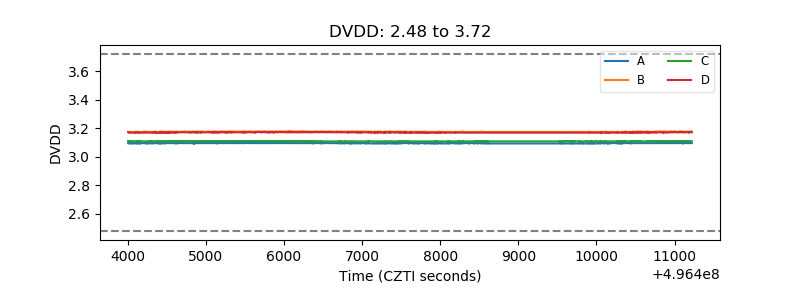 |
| Temperature 1 | 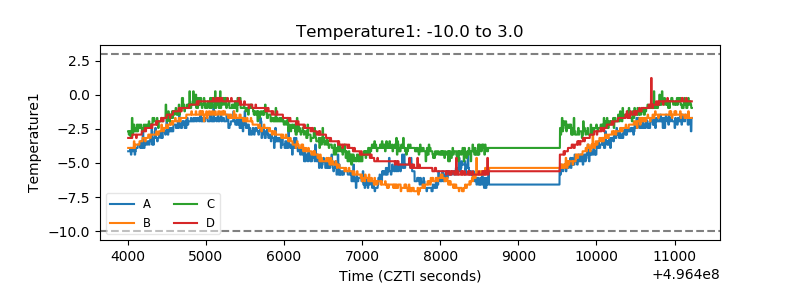 |
| Veto HV Monitor | 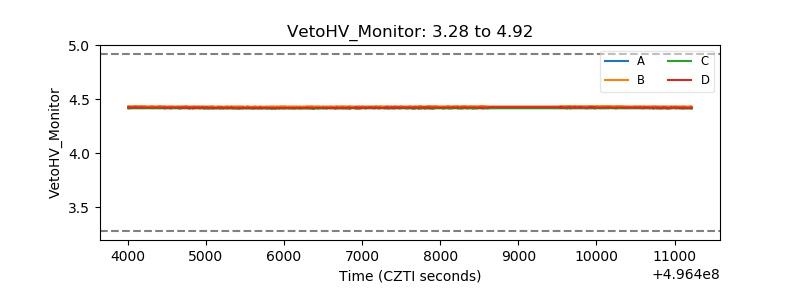 |
| Veto LLD | 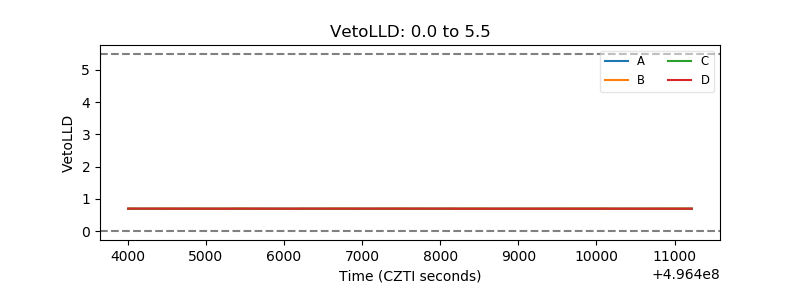 |
| Alpha Counter | 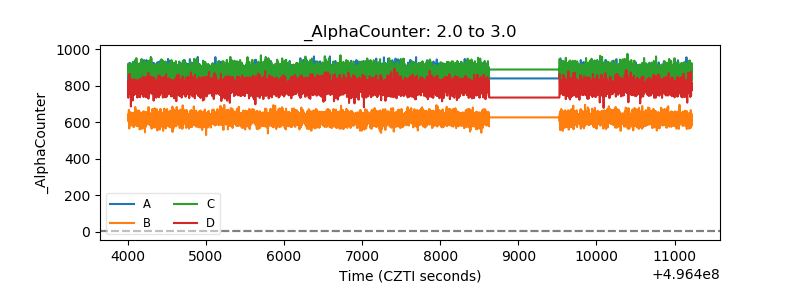 |
| _CPM_Rate | 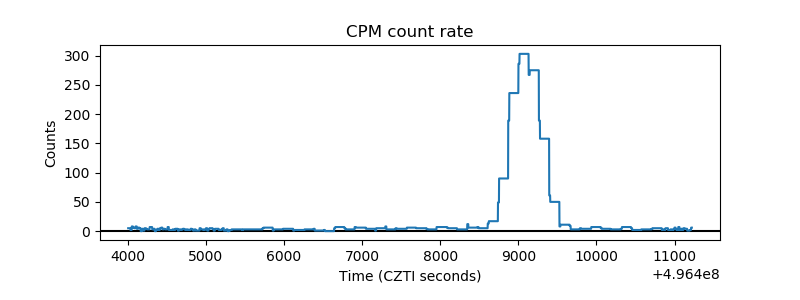 |
| CZT Counter | 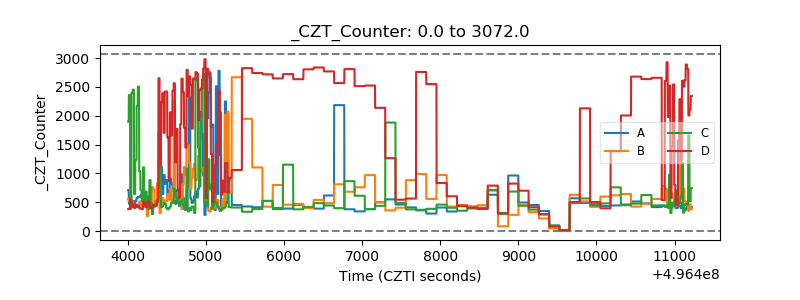 |
| +2.5 Volts monitor |  |
| +5 Volts monitor |  |
| _ROLL_ROT | 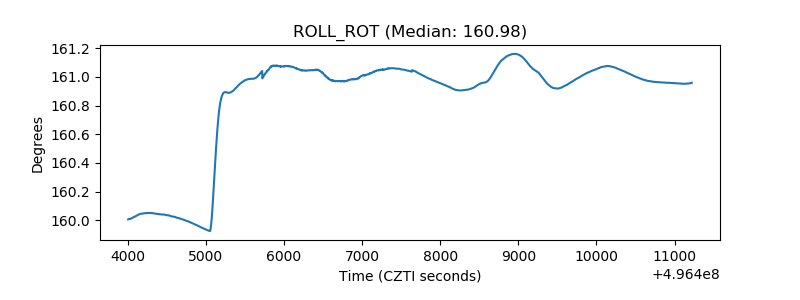 |
| _Roll_DEC | 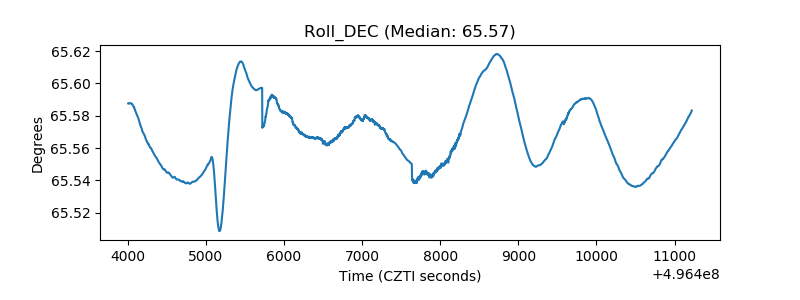 |
| _Roll_RA |  |
| Veto Counter | 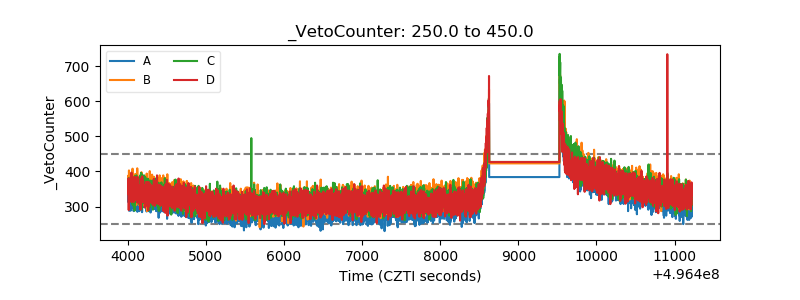 |