| Param | Original file | Final file |
|---|---|---|
| Filename | modeM0/AS1A14_041T01_9000006510_54050cztM0_level2.fits | modeM0/AS1A14_041T01_9000006510_54050cztM0_level2_quad_clean.evt |
| Size (bytes) | 621,371,520 | 82,575,360 |
| Size | 592.6 MB | 78.8 MB |
| Events in quadrant A | 3,841,883 | 602,404 |
| Events in quadrant B | 5,403,005 | 618,778 |
| Events in quadrant C | 3,027,810 | 566,400 |
| Events in quadrant D | 10,255,439 | 287,313 |
| Mode M9 | |||
|---|---|---|---|
| Quadrant | BADHDUFLAG | Total packets | Discarded packets |
| A | 0 | 11 | 0 |
| B | 0 | 11 | 0 |
| C | 0 | 11 | 0 |
| D | 0 | 11 | 0 |
| Mode SS | |||
|---|---|---|---|
| Quadrant | BADHDUFLAG | Total packets | Discarded packets |
| A | 0 | 124 | 0 |
| B | 0 | 124 | 0 |
| C | 0 | 124 | 0 |
| D | 0 | 124 | 0 |
| Mode M0 | |||
|---|---|---|---|
| Quadrant | BADHDUFLAG | Total packets | Discarded packets |
| A | 0 | 15748 | 1 |
| B | 0 | 20165 | 1 |
| C | 0 | 13573 | 2 |
| D | 0 | 34691 | 1 |
| Quadrant | Total seconds | Saturated seconds | Saturation percentage |
|---|---|---|---|
| A | 6090 | 188 | 3.087028% |
| B | 6090 | 603 | 9.901478% |
| C | 6090 | 130 | 2.134647% |
| D | 6090 | 3034 | 49.819376% |
Noise dominated data is calculated using 1-second bins in cleaned event files. If a bin has >2000 counts, and if more than 50% of those come from <1% of pixels, then it is considered to be noise-dominated and hence unusable.
| Quadrant | # 1 sec bins | Bins with >0 counts | Bins with >2000 counts | High rate bins dominated by noise | Noise dominated (total time) | Noise dominated (detector-on time) | Marked lightcurve |
|---|---|---|---|---|---|---|---|
| A | 7220 | 6091 | 130 | 130 | 1.80% | 2.13% | 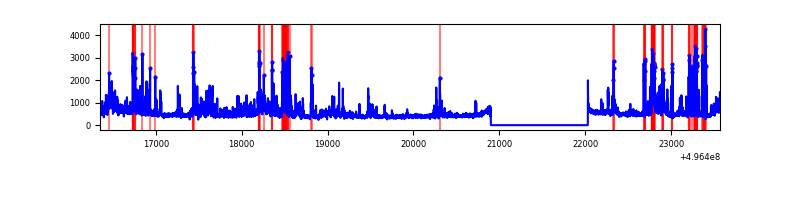 |
| B | 7220 | 6090 | 276 | 276 | 3.82% | 4.53% | 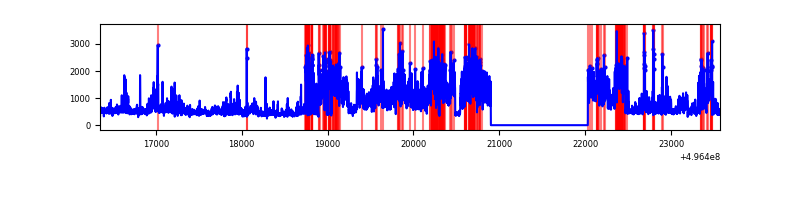 |
| C | 7220 | 6091 | 96 | 96 | 1.33% | 1.58% | 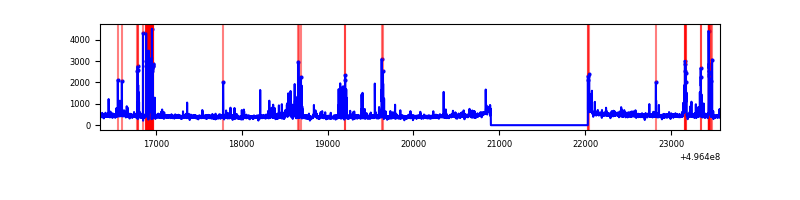 |
| D | 7220 | 6090 | 2470 | 2470 | 34.21% | 40.56% | 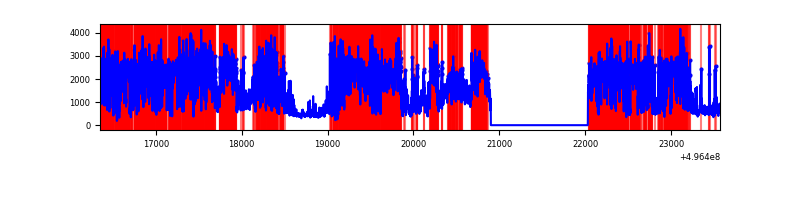 |
Top three noisy pixels from each quadrant. If the there are fewer than three noisy pixels in the level2.evt file, extra rows are filled as -1
| Pixel properties | Quadrant properties | ||||||
|---|---|---|---|---|---|---|---|
| Quadrant | DetID | PixID | Counts | Sigma | Mean | Median | Sigma |
| A | 15 | 174 | 550481 | 3396.31 | 647 | 630 | 161.9 |
| A | 12 | 115 | 411639 | 2538.72 | 647 | 630 | 161.9 |
| A | 12 | 15 | 150421 | 925.23 | 647 | 630 | 161.9 |
| B | 5 | 236 | 2176034 | 16052.62 | 632 | 613 | 135.5 |
| B | 15 | 20 | 530882 | 3912.9 | 632 | 613 | 135.5 |
| B | 4 | 173 | 35166 | 254.97 | 632 | 613 | 135.5 |
| C | 4 | 5 | 167586 | 953.13 | 631 | 623 | 175.2 |
| C | 13 | 3 | 150120 | 853.43 | 631 | 623 | 175.2 |
| C | 12 | 252 | 58922 | 332.81 | 631 | 623 | 175.2 |
| D | 8 | 176 | 6688141 | 54028.71 | 432 | 413 | 123.8 |
| D | 2 | 165 | 799782 | 6457.93 | 432 | 413 | 123.8 |
| D | 12 | 2 | 320232 | 2583.75 | 432 | 413 | 123.8 |
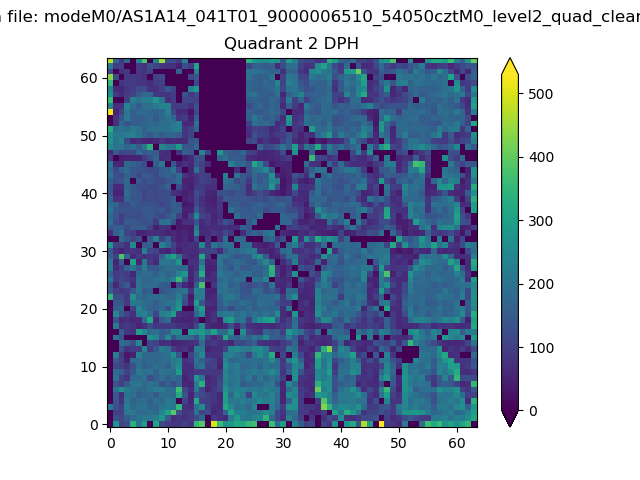
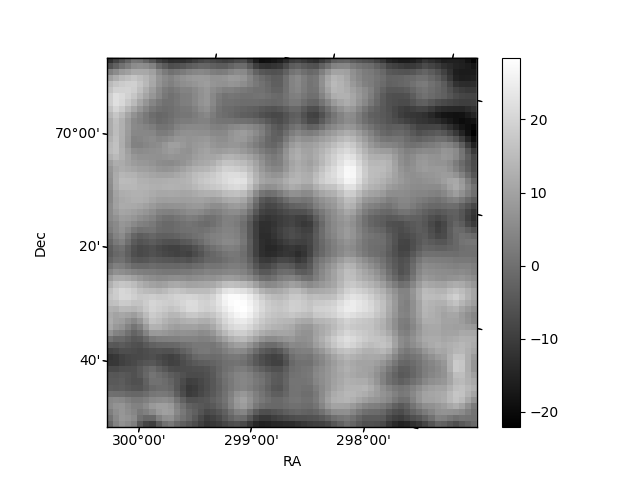
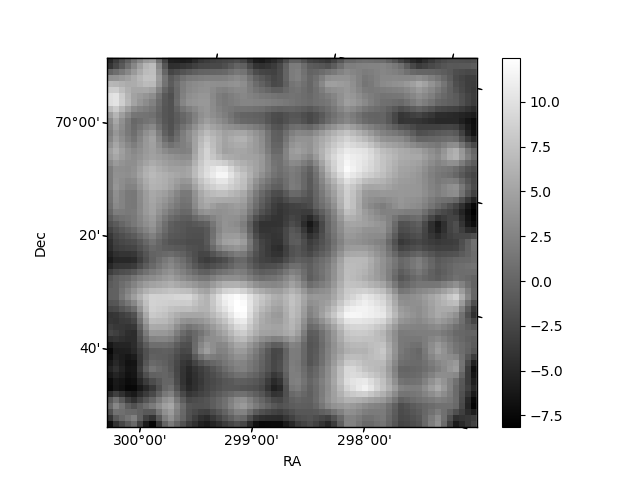
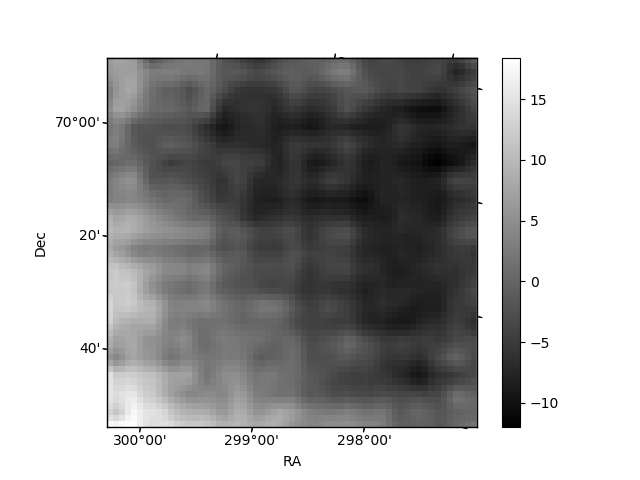
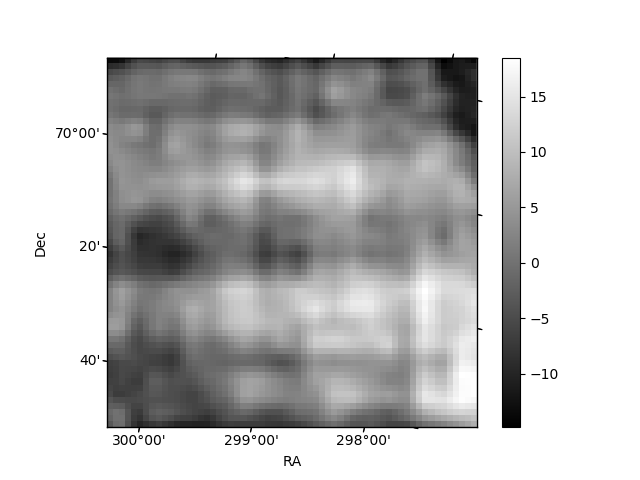
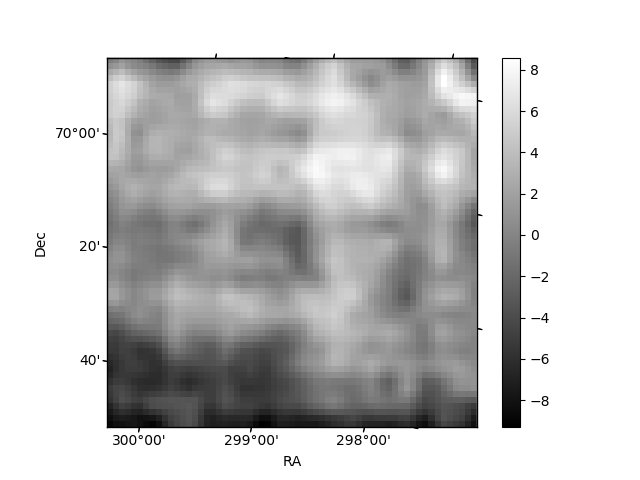
Histogram calculated using DETX and DETY for each event in the final _common_clean file
| Quadrant A | 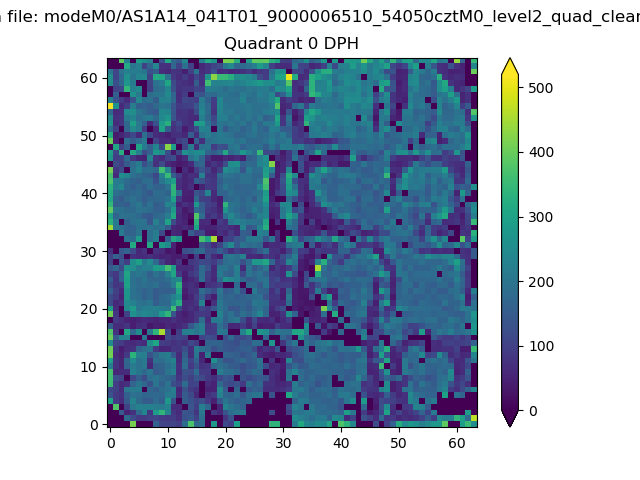 |
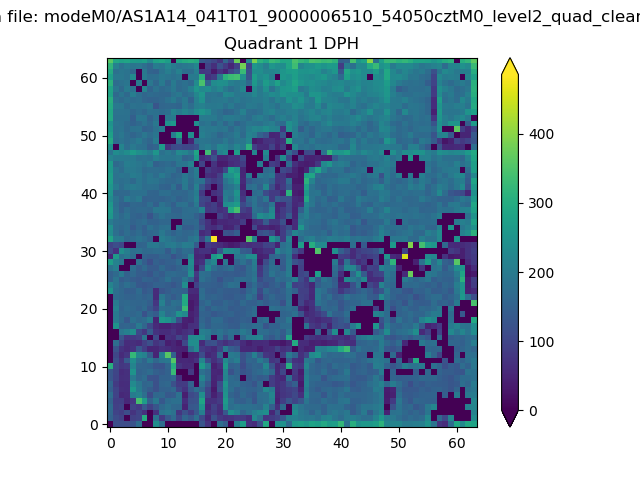 |
Quadrant B |
|---|---|---|---|
| Quadrant D | 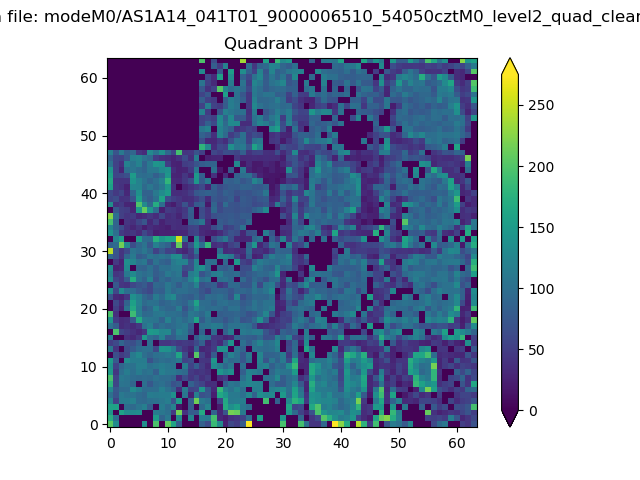 |
 |
Quadrant C |
| Plot type | Count rate plots | Images |
|---|---|---|
| Comparison with Poisson distribution Blue bars denote a histogram of data divided into 1 sec bins. Red curve is a Poisson curve with rate = median count rate of data. |
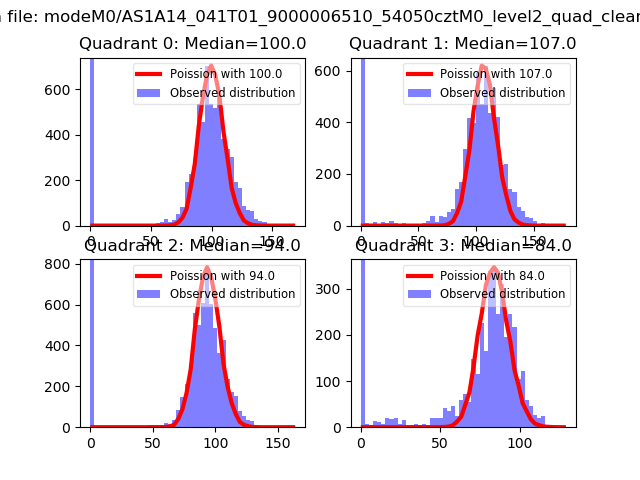 |
 |
| Quadrant-wise count rates Data is divided into 100 sec bins |
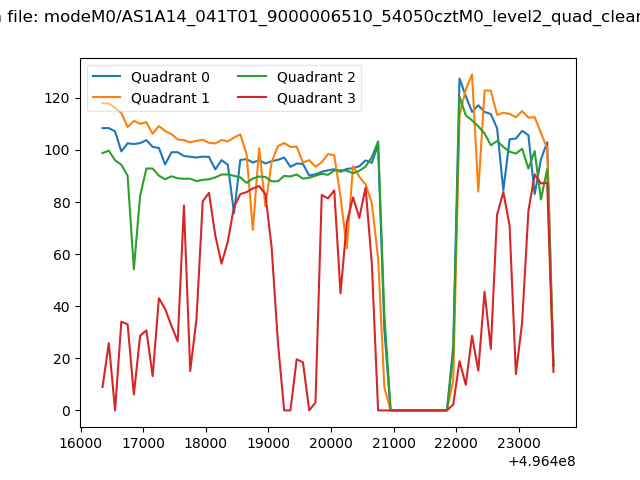 |
|
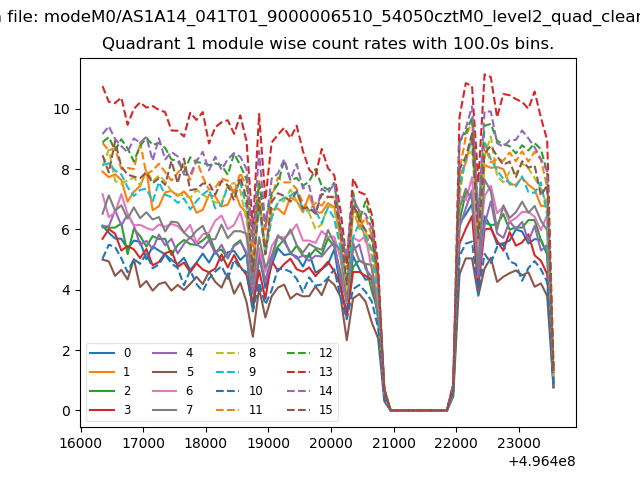
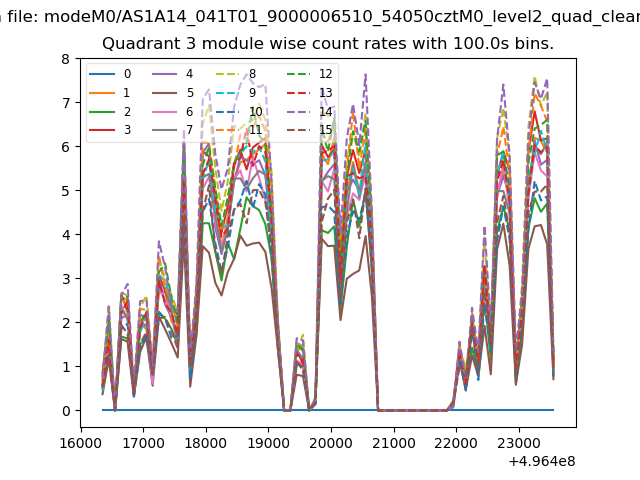
| Module-wise count rates for Quadrant A Data is divided into 100 sec bins |
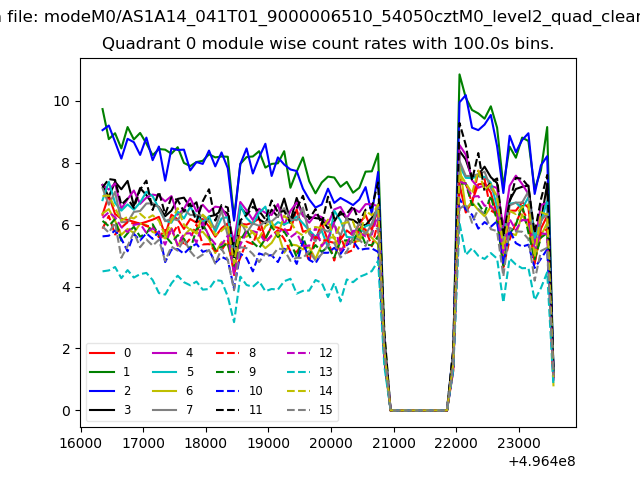 |
 |
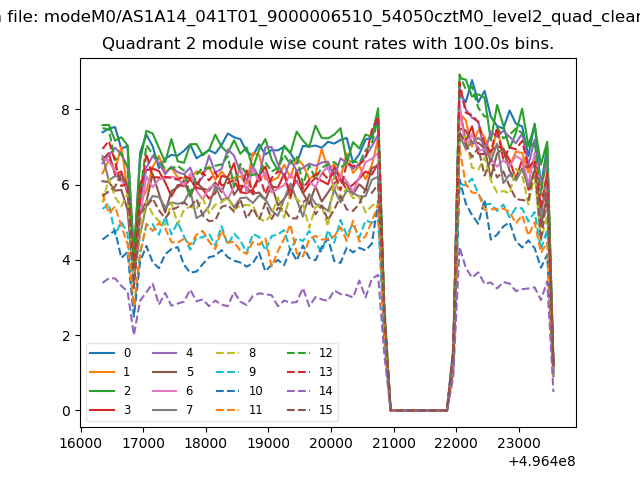
| Module-wise count rates for Quadrant B Data is divided into 100 sec bins |
 |
 |
| Module-wise count rates for Quadrant C Data is divided into 100 sec bins |
 |
 |
| Module-wise count rates for Quadrant D Data is divided into 100 sec bins |
 |
 |
| Parameter | Plot |
|---|---|
| CZT HV Monitor | 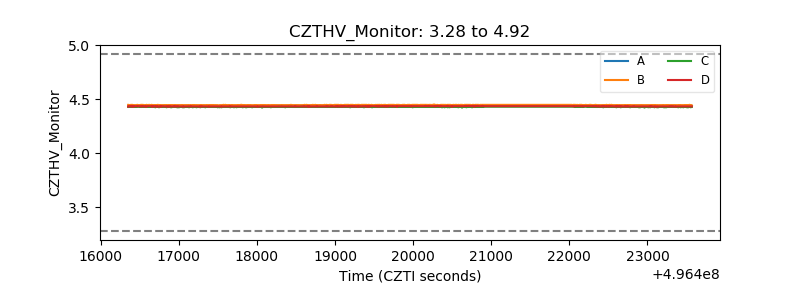 |
| D_VDD | 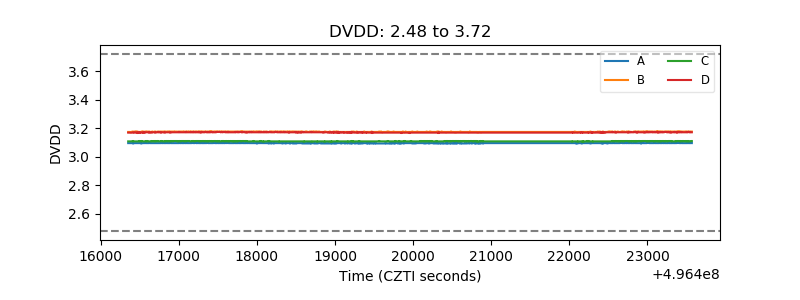 |
| Temperature 1 | 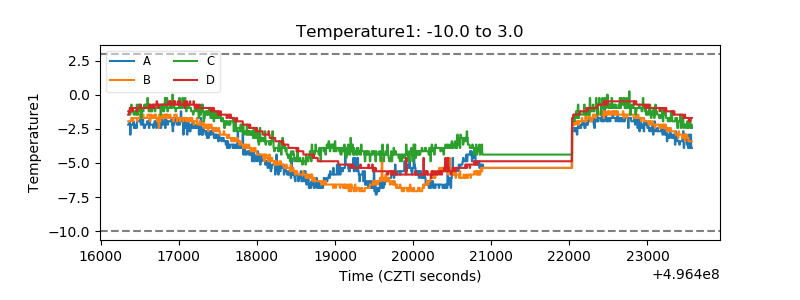 |
| Veto HV Monitor | 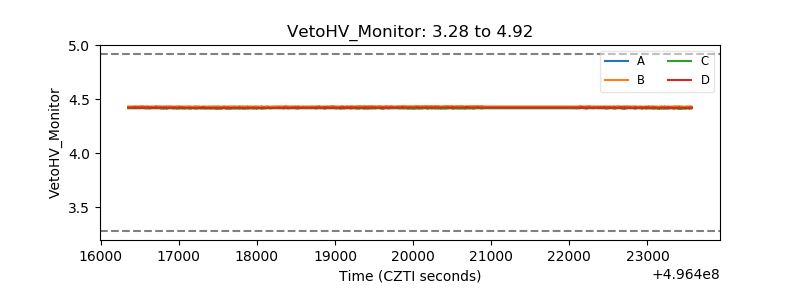 |
| Veto LLD | 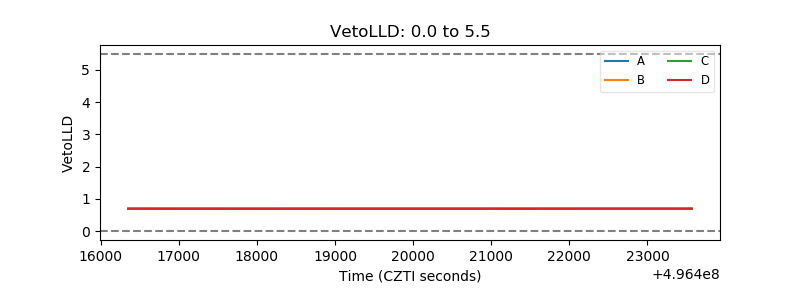 |
| Alpha Counter | 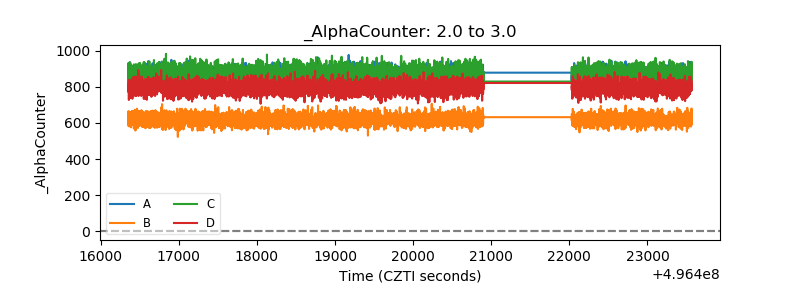 |
| _CPM_Rate | 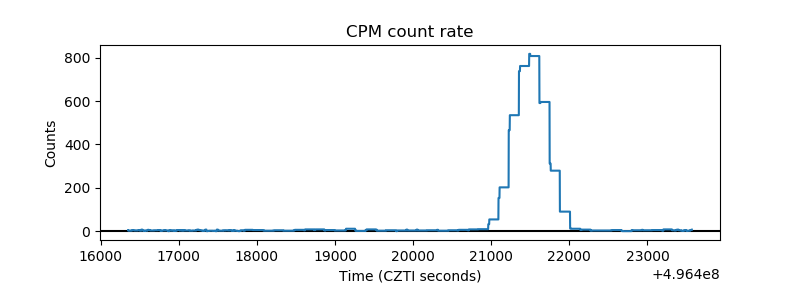 |
| CZT Counter | 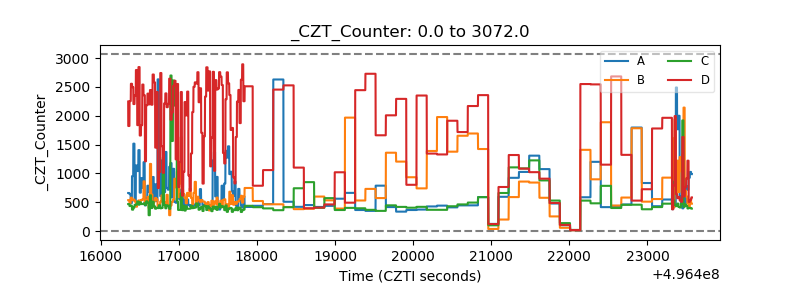 |
| +2.5 Volts monitor |  |
| +5 Volts monitor |  |
| _ROLL_ROT | 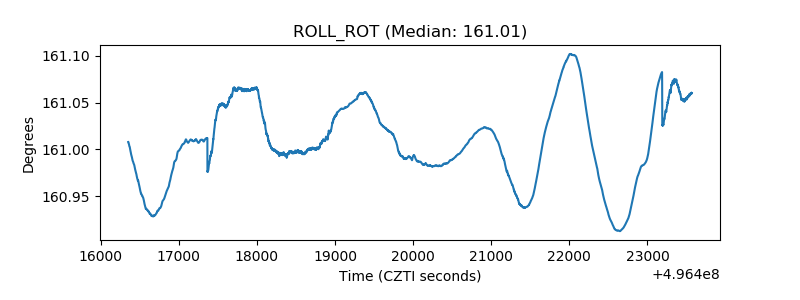 |
| _Roll_DEC | 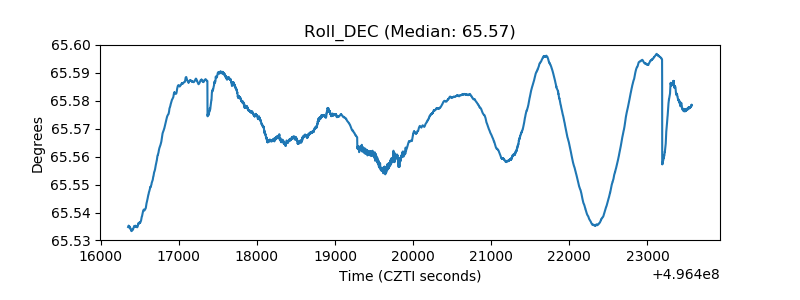 |
| _Roll_RA | 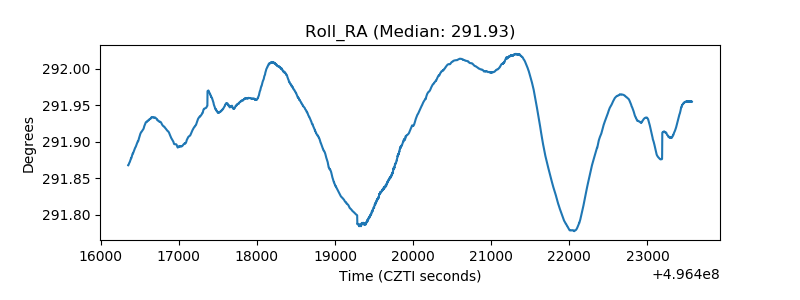 |
| Veto Counter | 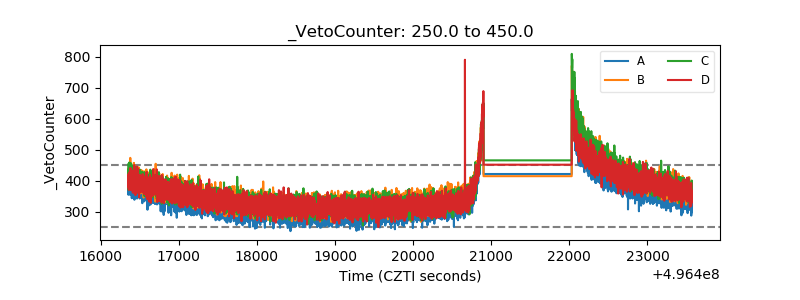 |