| Param | Original file | Final file |
|---|---|---|
| Filename | modeM0/AS1A14_041T01_9000006510_54051cztM0_level2.fits | modeM0/AS1A14_041T01_9000006510_54051cztM0_level2_quad_clean.evt |
| Size (bytes) | 614,370,240 | 85,227,840 |
| Size | 585.9 MB | 81.3 MB |
| Events in quadrant A | 4,720,396 | 619,823 |
| Events in quadrant B | 7,950,016 | 432,952 |
| Events in quadrant C | 3,698,221 | 592,182 |
| Events in quadrant D | 5,878,444 | 491,552 |
| Mode M9 | |||
|---|---|---|---|
| Quadrant | BADHDUFLAG | Total packets | Discarded packets |
| A | 0 | 12 | 0 |
| B | 0 | 12 | 0 |
| C | 0 | 12 | 0 |
| D | 0 | 12 | 0 |
| Mode SS | |||
|---|---|---|---|
| Quadrant | BADHDUFLAG | Total packets | Discarded packets |
| A | 0 | 128 | 0 |
| B | 0 | 128 | 0 |
| C | 0 | 128 | 0 |
| D | 0 | 128 | 0 |
| Mode M0 | |||
|---|---|---|---|
| Quadrant | BADHDUFLAG | Total packets | Discarded packets |
| A | 0 | 18564 | 1 |
| B | 0 | 28069 | 2 |
| C | 0 | 15589 | 1 |
| D | 0 | 21935 | 1 |
| Quadrant | Total seconds | Saturated seconds | Saturation percentage |
|---|---|---|---|
| A | 6366 | 422 | 6.628966% |
| B | 6366 | 2611 | 41.014766% |
| C | 6366 | 289 | 4.539742% |
| D | 6366 | 990 | 15.551367% |
Noise dominated data is calculated using 1-second bins in cleaned event files. If a bin has >2000 counts, and if more than 50% of those come from <1% of pixels, then it is considered to be noise-dominated and hence unusable.
| Quadrant | # 1 sec bins | Bins with >0 counts | Bins with >2000 counts | High rate bins dominated by noise | Noise dominated (total time) | Noise dominated (detector-on time) | Marked lightcurve |
|---|---|---|---|---|---|---|---|
| A | 7556 | 6367 | 344 | 344 | 4.55% | 5.40% | 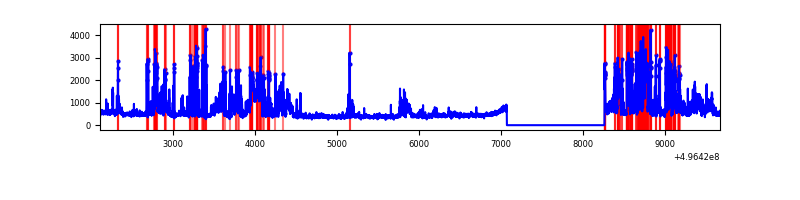 |
| B | 7556 | 6366 | 1484 | 1484 | 19.64% | 23.31% | 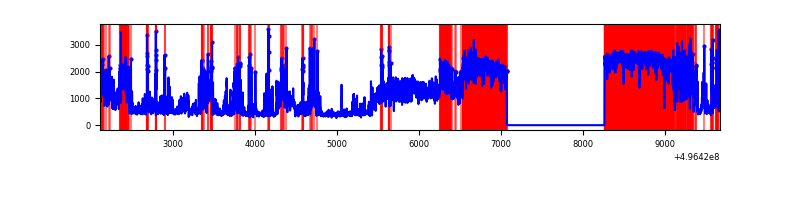 |
| C | 7556 | 6367 | 265 | 265 | 3.51% | 4.16% | 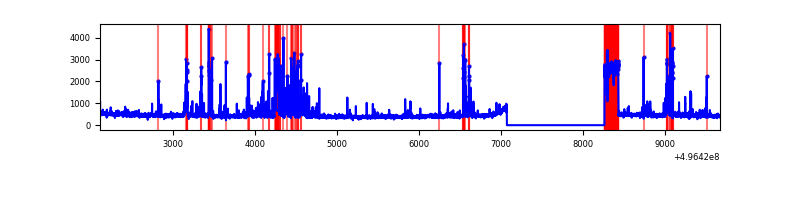 |
| D | 7556 | 6367 | 844 | 844 | 11.17% | 13.26% | 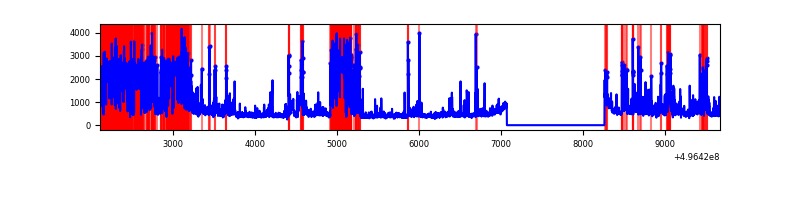 |
Top three noisy pixels from each quadrant. If the there are fewer than three noisy pixels in the level2.evt file, extra rows are filled as -1
| Pixel properties | Quadrant properties | ||||||
|---|---|---|---|---|---|---|---|
| Quadrant | DetID | PixID | Counts | Sigma | Mean | Median | Sigma |
| A | 12 | 115 | 1276704 | 7637.02 | 674 | 656 | 167.1 |
| A | 15 | 174 | 576195 | 3444.54 | 674 | 656 | 167.1 |
| A | 0 | 8 | 142616 | 849.62 | 674 | 656 | 167.1 |
| B | 5 | 250 | 3570104 | 31202.58 | 532 | 513 | 114.4 |
| B | 15 | 20 | 1342871 | 11733.85 | 532 | 513 | 114.4 |
| B | 5 | 236 | 491878 | 4295.13 | 532 | 513 | 114.4 |
| C | 1 | 241 | 504788 | 2770.22 | 661 | 655 | 182.0 |
| C | 13 | 3 | 243876 | 1336.51 | 661 | 655 | 182.0 |
| C | 12 | 2 | 194280 | 1063.97 | 661 | 655 | 182.0 |
| D | 8 | 176 | 2298002 | 13251.0 | 611 | 584 | 173.4 |
| D | 3 | 12 | 368126 | 2119.9 | 611 | 584 | 173.4 |
| D | 2 | 165 | 288210 | 1658.96 | 611 | 584 | 173.4 |
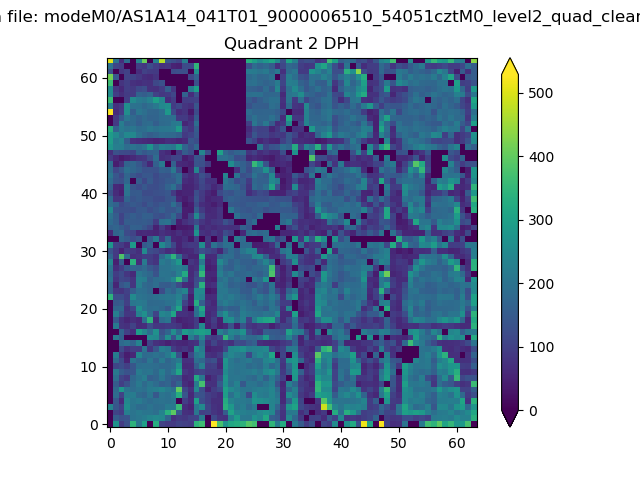
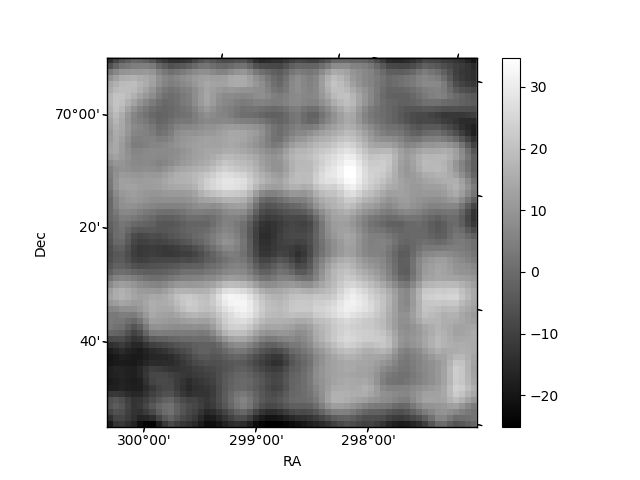
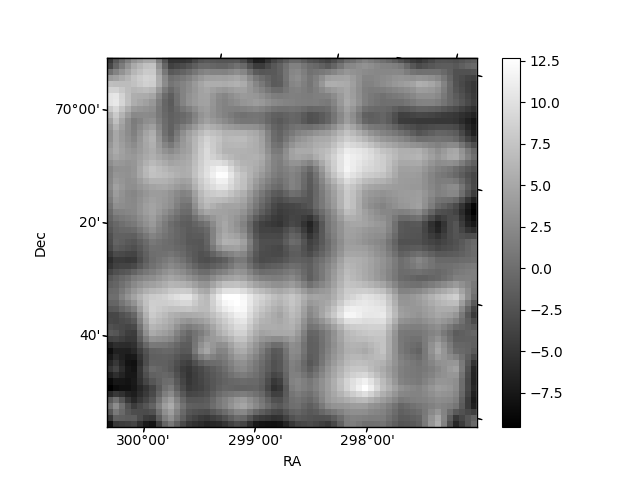
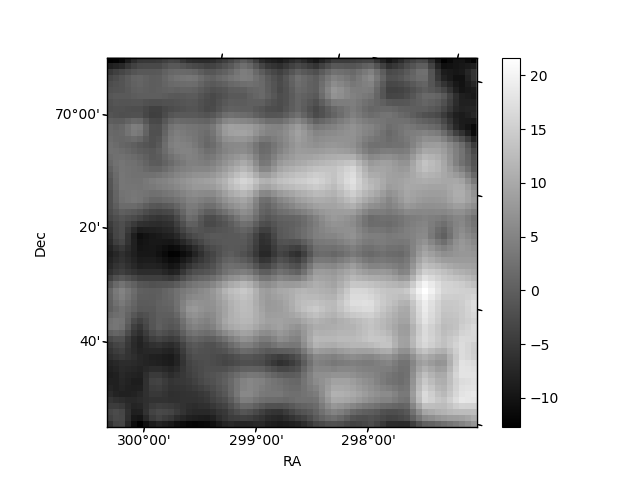
Histogram calculated using DETX and DETY for each event in the final _common_clean file
| Quadrant A | 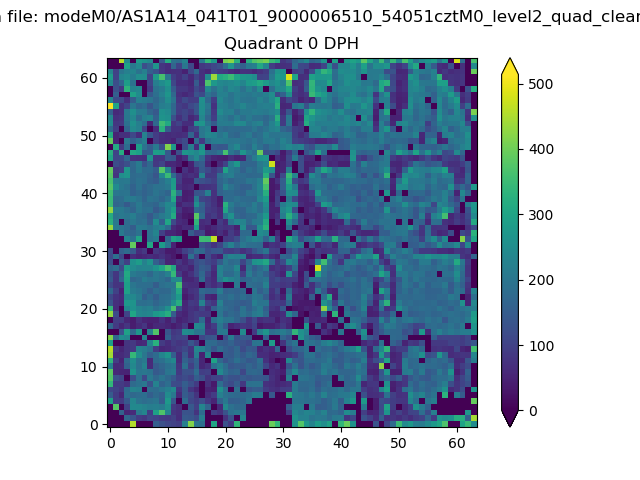 |
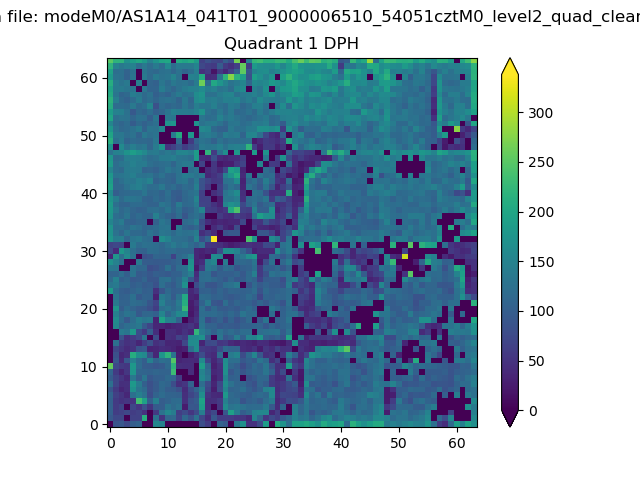 |
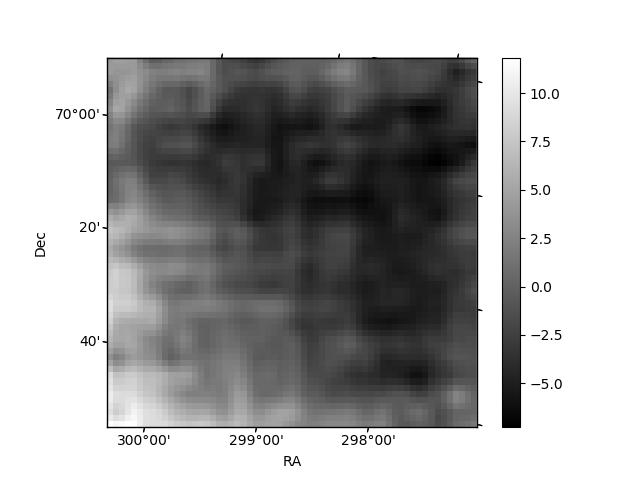
Quadrant B |
|---|---|---|---|
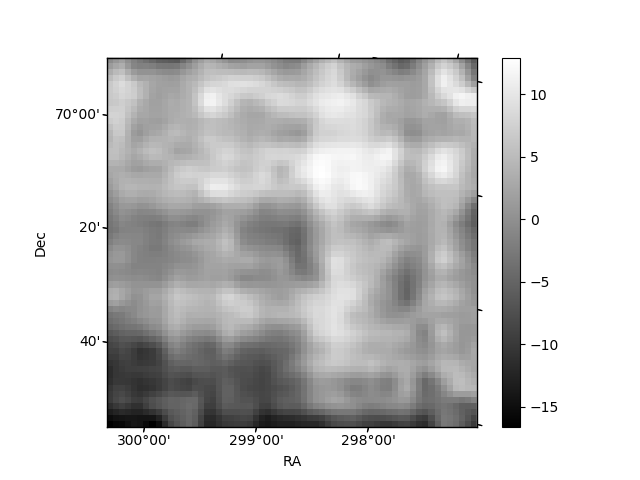
| Quadrant D | 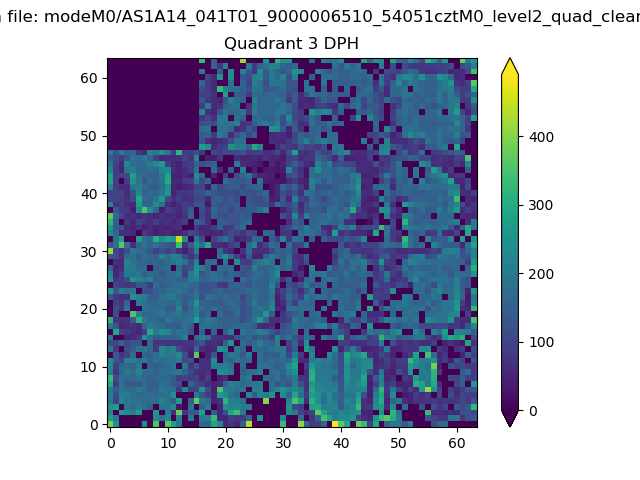 |
 |
Quadrant C |
| Plot type | Count rate plots | Images |
|---|---|---|
| Comparison with Poisson distribution Blue bars denote a histogram of data divided into 1 sec bins. Red curve is a Poisson curve with rate = median count rate of data. |
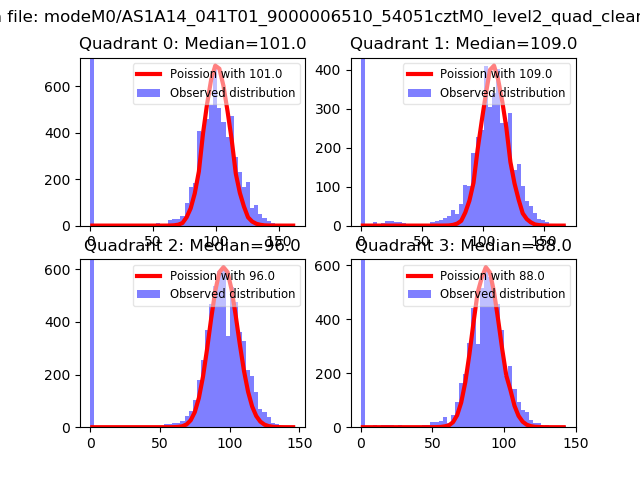 |
 |
| Quadrant-wise count rates Data is divided into 100 sec bins |
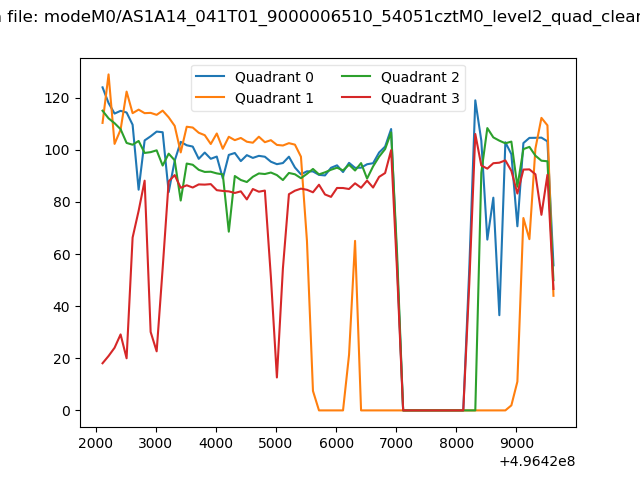 |
|
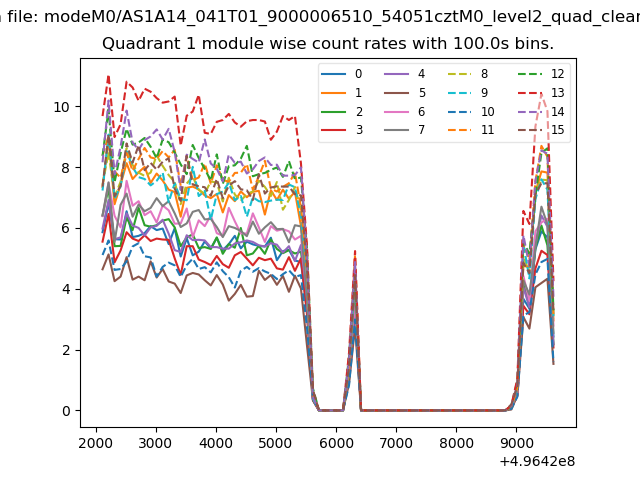
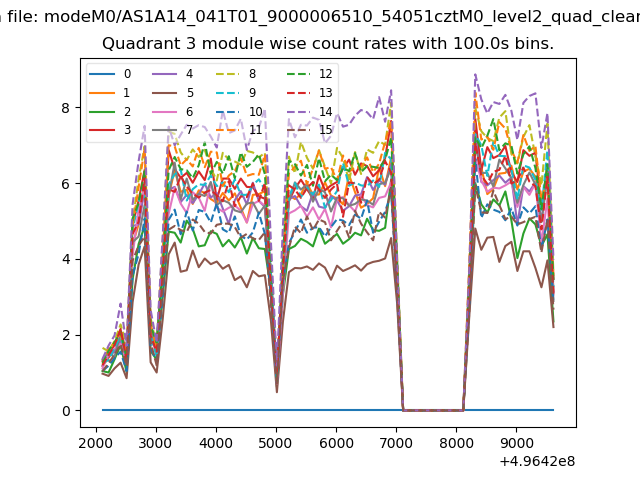
| Module-wise count rates for Quadrant A Data is divided into 100 sec bins |
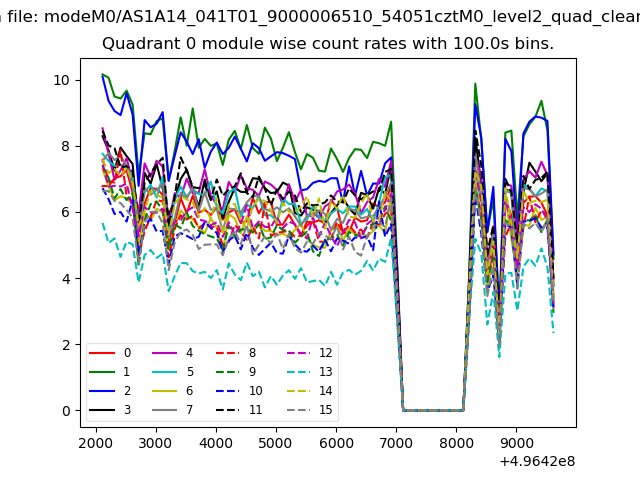 |
 |
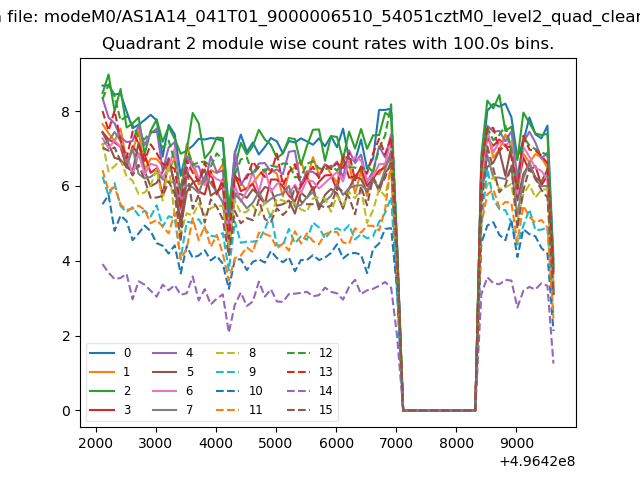
| Module-wise count rates for Quadrant B Data is divided into 100 sec bins |
 |
 |
| Module-wise count rates for Quadrant C Data is divided into 100 sec bins |
 |
 |
| Module-wise count rates for Quadrant D Data is divided into 100 sec bins |
 |
 |
| Parameter | Plot |
|---|---|
| CZT HV Monitor | 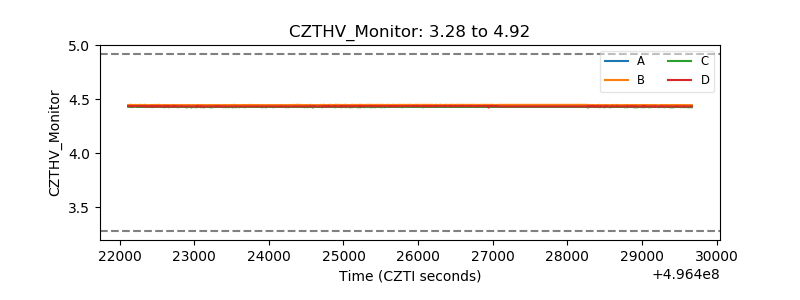 |
| D_VDD | 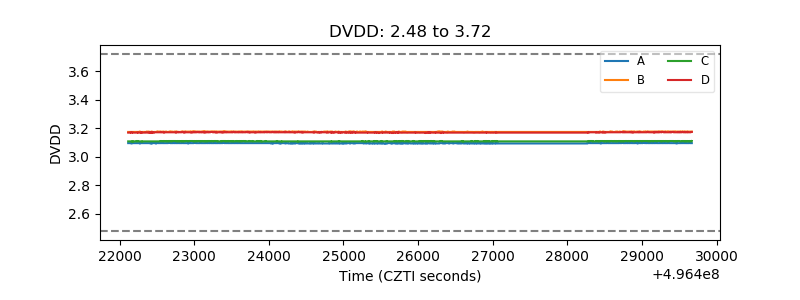 |
| Temperature 1 | 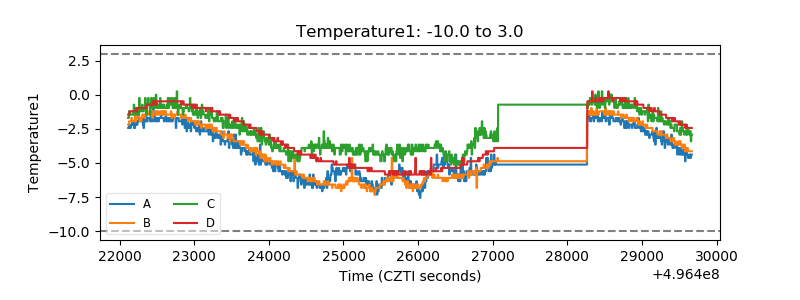 |
| Veto HV Monitor | 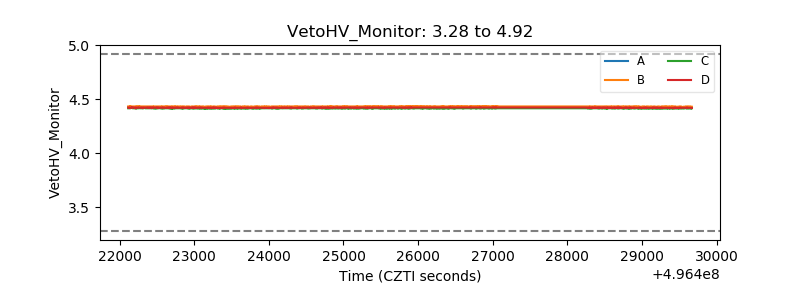 |
| Veto LLD | 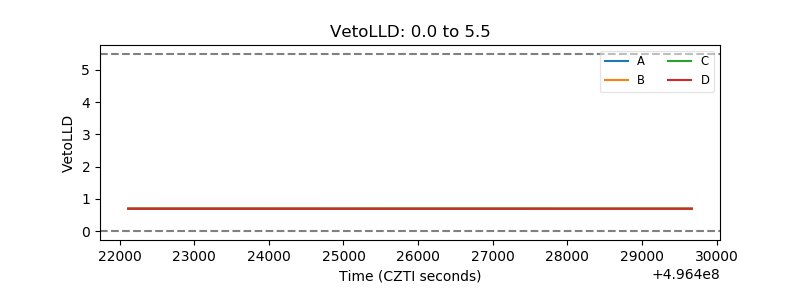 |
| Alpha Counter | 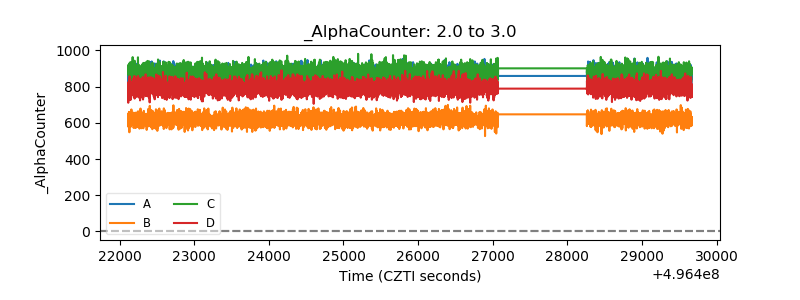 |
| _CPM_Rate | 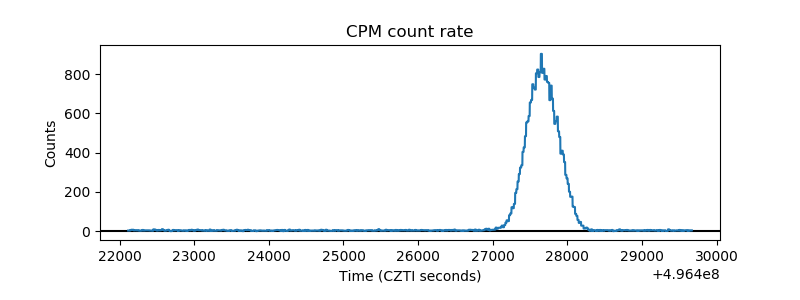 |
| CZT Counter | 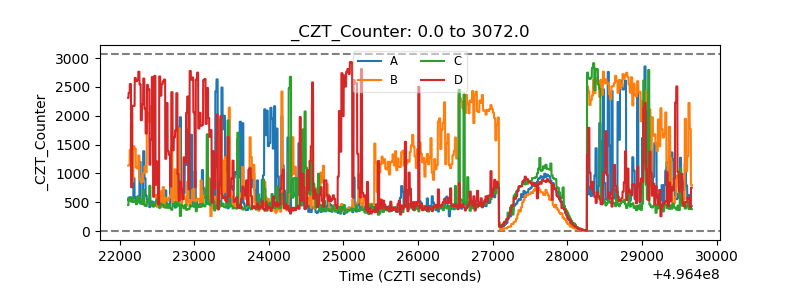 |
| +2.5 Volts monitor |  |
| +5 Volts monitor |  |
| _ROLL_ROT | 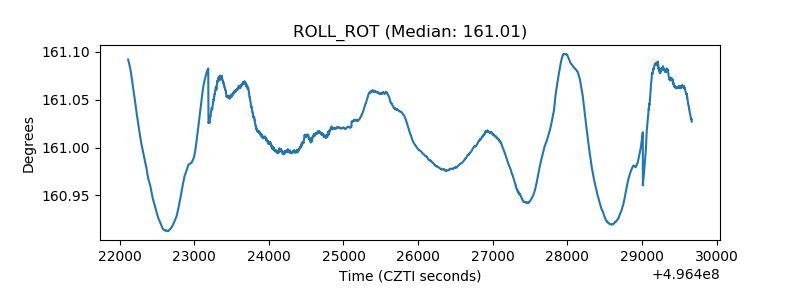 |
| _Roll_DEC | 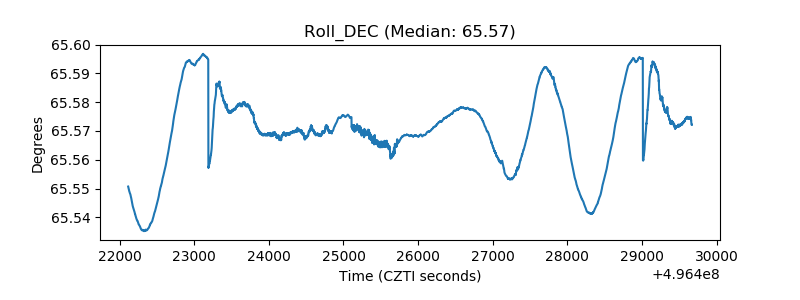 |
| _Roll_RA | 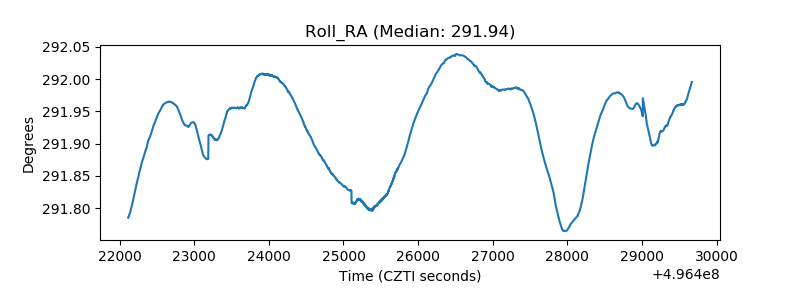 |
| Veto Counter | 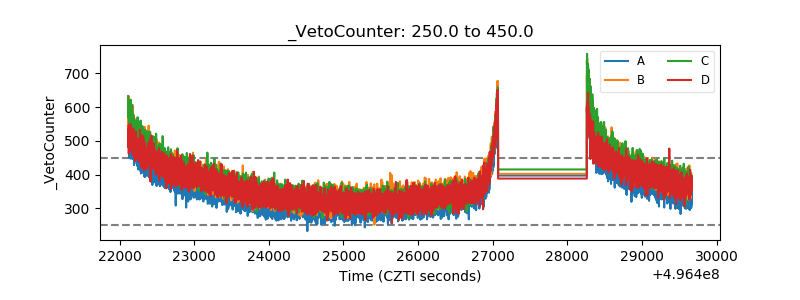 |