| Param | Original file | Final file |
|---|---|---|
| Filename | modeM0/AS1A14_041T01_9000006510_54052cztM0_level2.fits | modeM0/AS1A14_041T01_9000006510_54052cztM0_level2_quad_clean.evt |
| Size (bytes) | 542,545,920 | 89,654,400 |
| Size | 517.4 MB | 85.5 MB |
| Events in quadrant A | 4,489,981 | 605,478 |
| Events in quadrant B | 6,987,535 | 550,758 |
| Events in quadrant C | 3,445,471 | 579,449 |
| Events in quadrant D | 4,671,103 | 539,725 |
| Mode M9 | |||
|---|---|---|---|
| Quadrant | BADHDUFLAG | Total packets | Discarded packets |
| A | 0 | 15 | 0 |
| B | 0 | 15 | 0 |
| C | 0 | 16 | 0 |
| D | 0 | 16 | 0 |
| Mode SS | |||
|---|---|---|---|
| Quadrant | BADHDUFLAG | Total packets | Discarded packets |
| A | 0 | 128 | 0 |
| B | 0 | 128 | 0 |
| C | 0 | 128 | 0 |
| D | 0 | 128 | 0 |
| Mode M0 | |||
|---|---|---|---|
| Quadrant | BADHDUFLAG | Total packets | Discarded packets |
| A | 0 | 17819 | 2 |
| B | 0 | 25148 | 5 |
| C | 0 | 14983 | 2 |
| D | 0 | 18402 | 2 |
| Quadrant | Total seconds | Saturated seconds | Saturation percentage |
|---|---|---|---|
| A | 6303 | 371 | 5.886086% |
| B | 6302 | 1345 | 21.342431% |
| C | 6302 | 271 | 4.300222% |
| D | 6302 | 362 | 5.744208% |
Noise dominated data is calculated using 1-second bins in cleaned event files. If a bin has >2000 counts, and if more than 50% of those come from <1% of pixels, then it is considered to be noise-dominated and hence unusable.
| Quadrant | # 1 sec bins | Bins with >0 counts | Bins with >2000 counts | High rate bins dominated by noise | Noise dominated (total time) | Noise dominated (detector-on time) | Marked lightcurve |
|---|---|---|---|---|---|---|---|
| A | 7523 | 6304 | 296 | 296 | 3.93% | 4.70% | 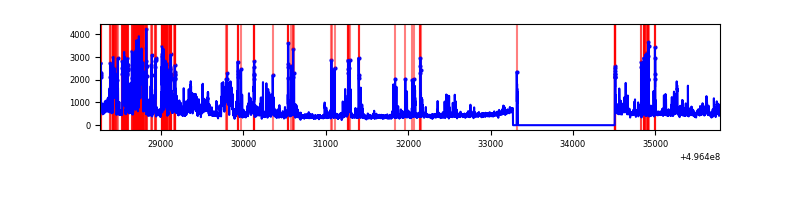 |
| B | 7522 | 6304 | 1148 | 1148 | 15.26% | 18.21% | 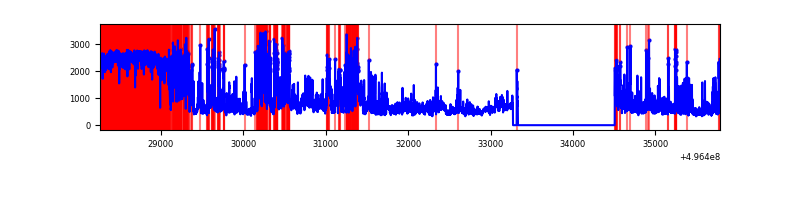 |
| C | 7522 | 6304 | 237 | 237 | 3.15% | 3.76% | 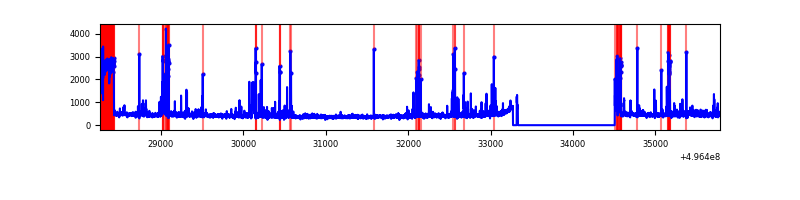 |
| D | 7521 | 6302 | 285 | 285 | 3.79% | 4.52% | 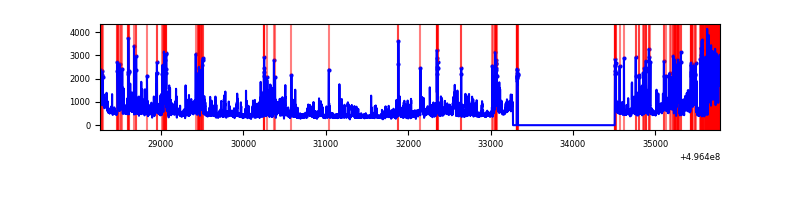 |
Top three noisy pixels from each quadrant. If the there are fewer than three noisy pixels in the level2.evt file, extra rows are filled as -1
| Pixel properties | Quadrant properties | ||||||
|---|---|---|---|---|---|---|---|
| Quadrant | DetID | PixID | Counts | Sigma | Mean | Median | Sigma |
| A | 12 | 115 | 1076716 | 6525.48 | 661 | 641 | 164.9 |
| A | 15 | 174 | 363272 | 2199.05 | 661 | 641 | 164.9 |
| A | 12 | 15 | 176318 | 1065.33 | 661 | 641 | 164.9 |
| B | 5 | 250 | 1458063 | 11831.21 | 587 | 571 | 123.2 |
| B | 15 | 20 | 1310731 | 10635.24 | 587 | 571 | 123.2 |
| B | 4 | 81 | 976165 | 7919.4 | 587 | 571 | 123.2 |
| C | 1 | 241 | 460862 | 2547.22 | 651 | 643 | 180.7 |
| C | 12 | 2 | 195233 | 1077.02 | 651 | 643 | 180.7 |
| C | 13 | 3 | 68940 | 378.01 | 651 | 643 | 180.7 |
| D | 2 | 165 | 960105 | 5225.11 | 648 | 619 | 183.6 |
| D | 2 | 172 | 279701 | 1519.81 | 648 | 619 | 183.6 |
| D | 8 | 176 | 191854 | 1041.42 | 648 | 619 | 183.6 |
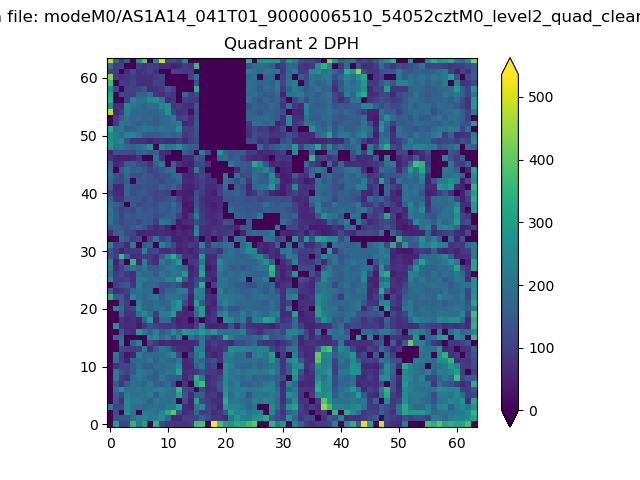
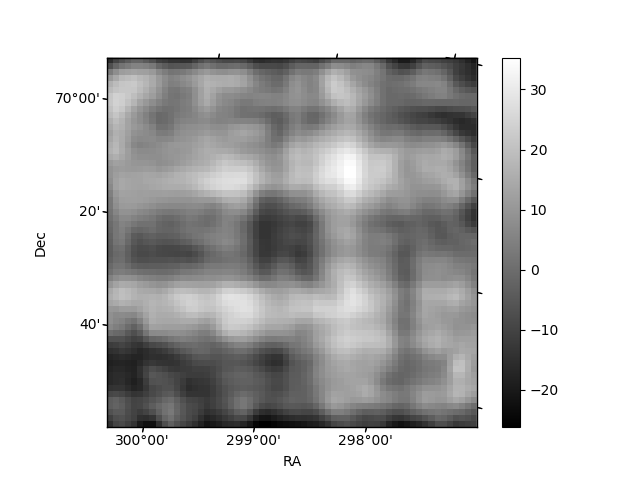
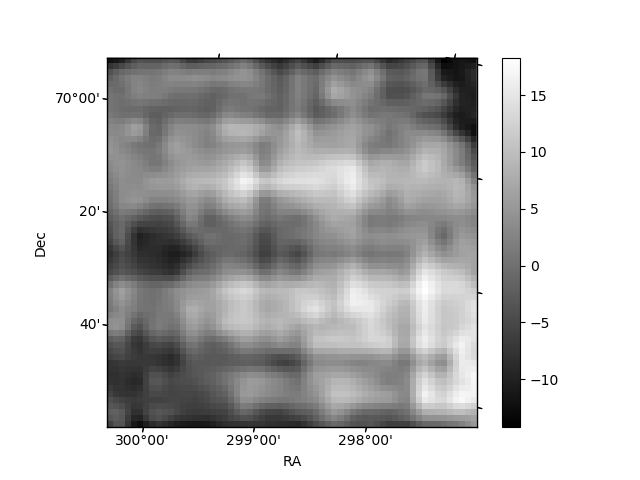
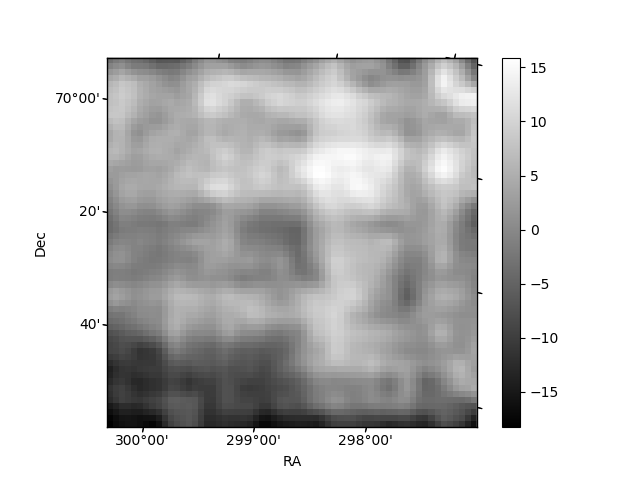
Histogram calculated using DETX and DETY for each event in the final _common_clean file
| Quadrant A | 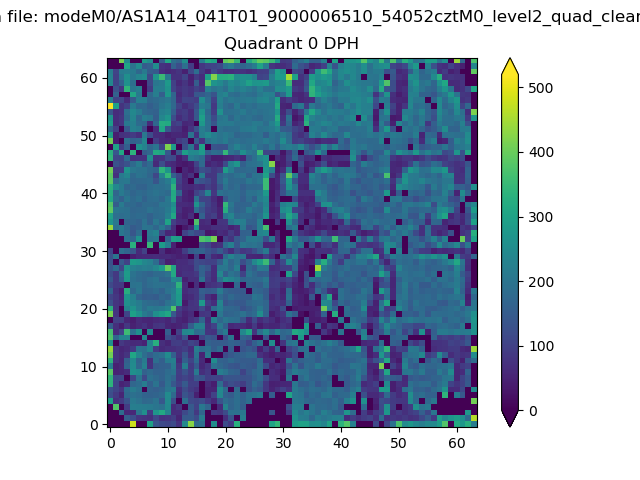 |
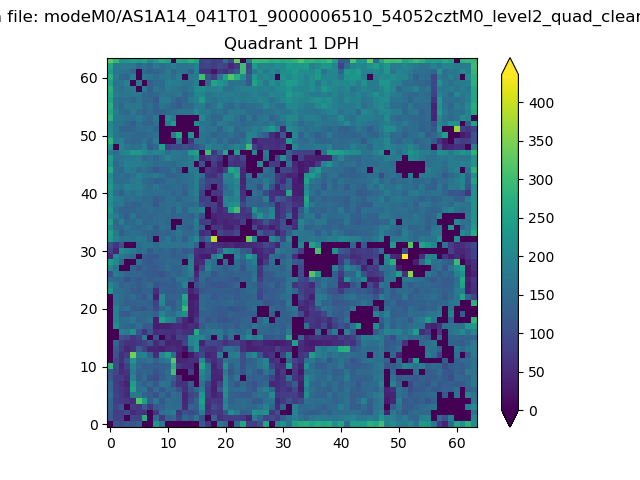 |
Quadrant B |
|---|---|---|---|
| Quadrant D | 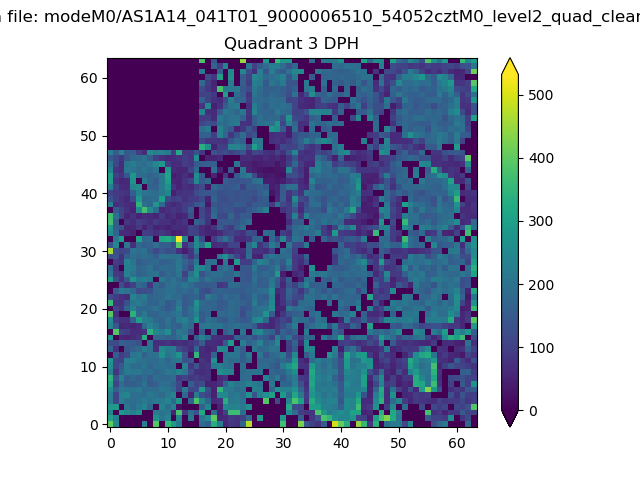 |
 |
Quadrant C |
| Plot type | Count rate plots | Images |
|---|---|---|
| Comparison with Poisson distribution Blue bars denote a histogram of data divided into 1 sec bins. Red curve is a Poisson curve with rate = median count rate of data. |
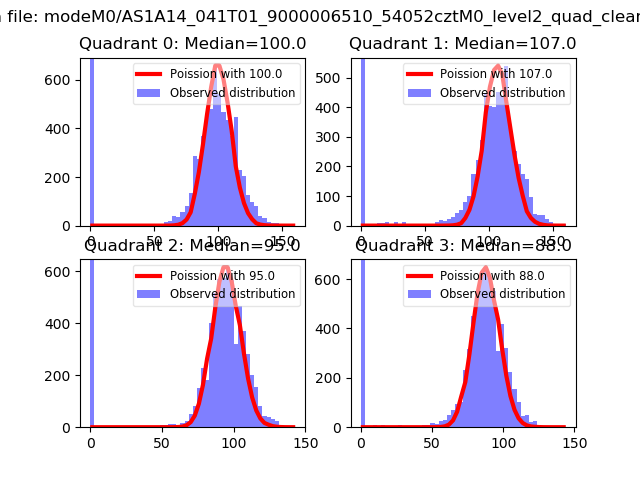 |
 |
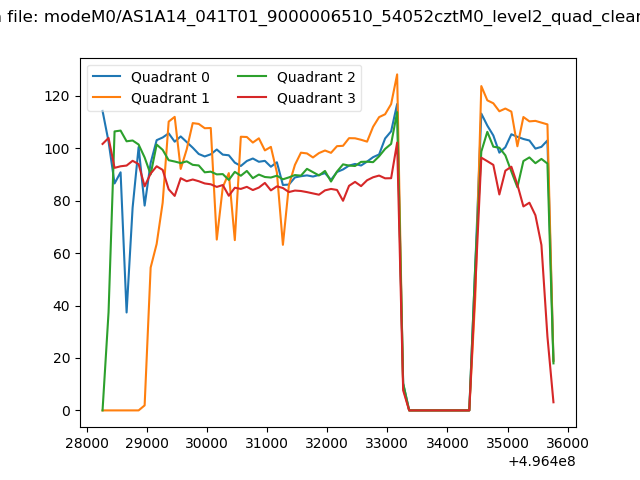
| Quadrant-wise count rates Data is divided into 100 sec bins |
 |
|
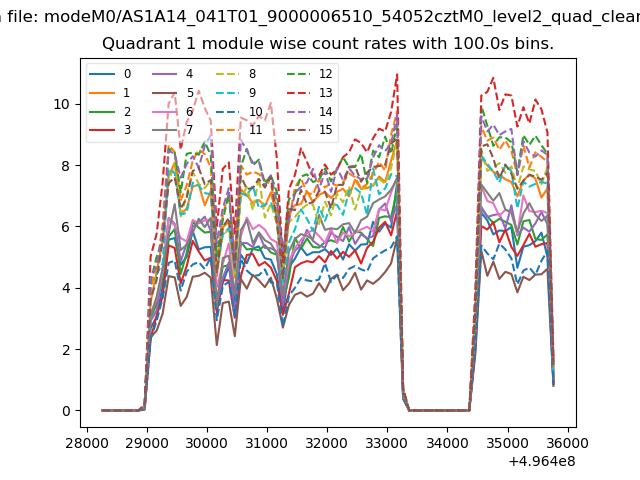
| Module-wise count rates for Quadrant A Data is divided into 100 sec bins |
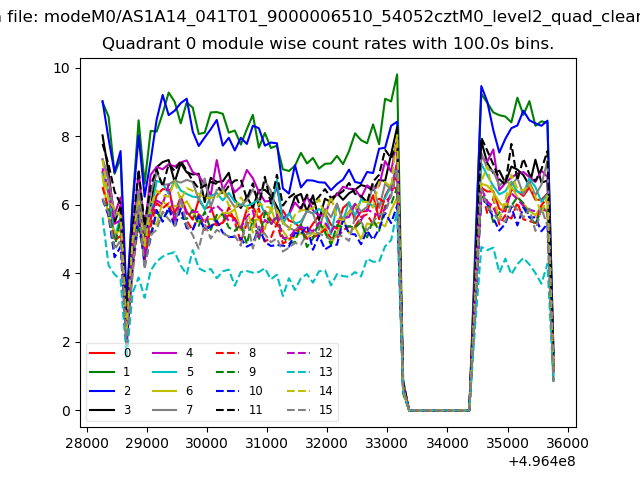 |
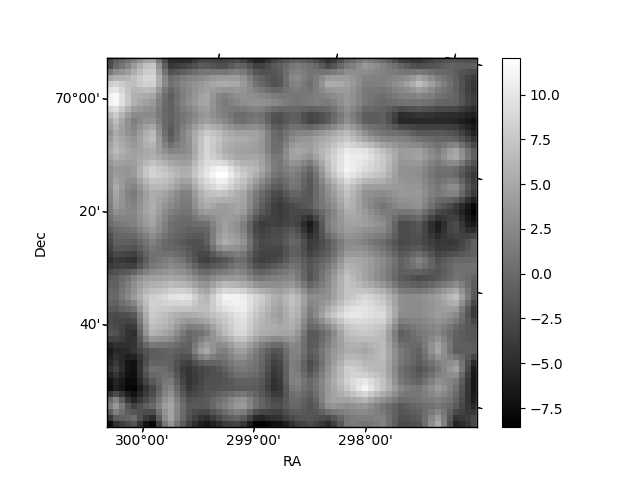 |
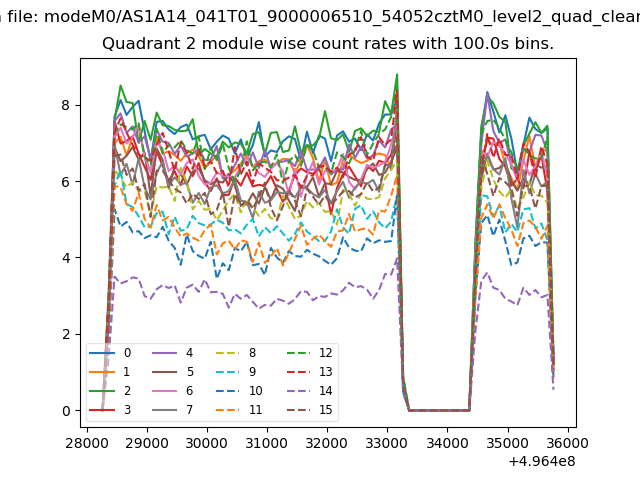
| Module-wise count rates for Quadrant B Data is divided into 100 sec bins |
 |
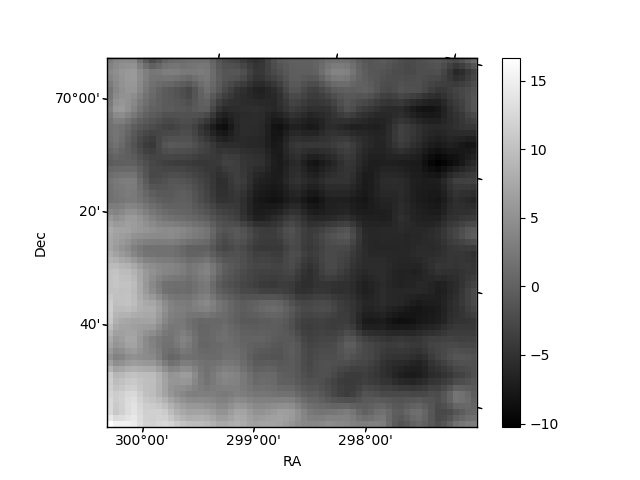 |
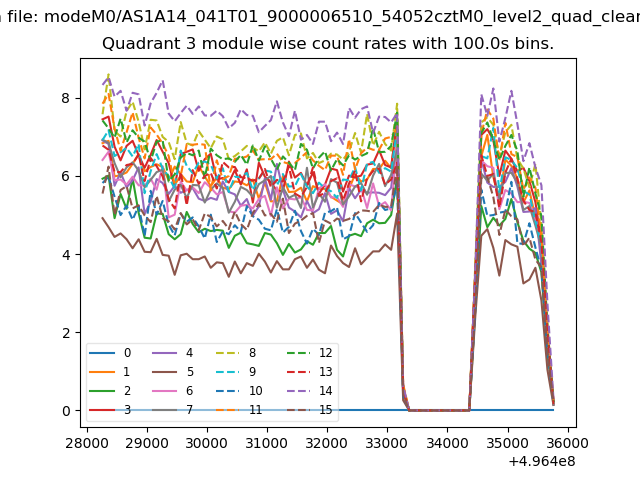
| Module-wise count rates for Quadrant C Data is divided into 100 sec bins |
 |
 |
| Module-wise count rates for Quadrant D Data is divided into 100 sec bins |
 |
 |
| Parameter | Plot |
|---|---|
| CZT HV Monitor | 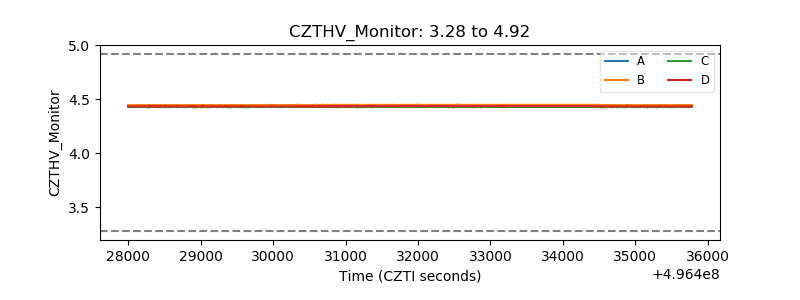 |
| D_VDD | 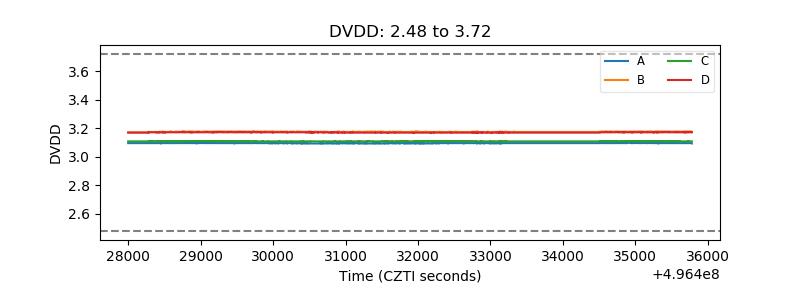 |
| Temperature 1 | 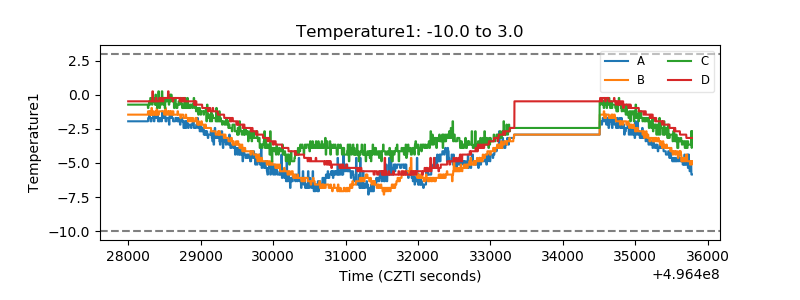 |
| Veto HV Monitor | 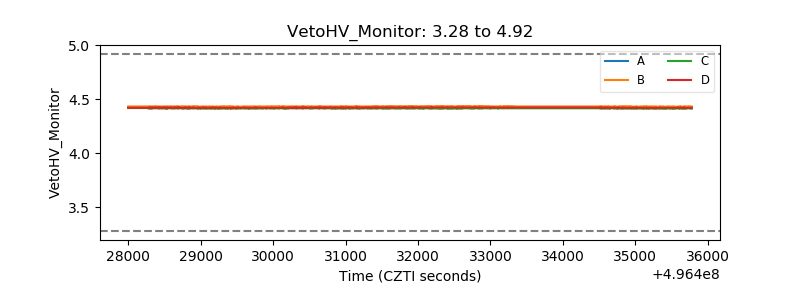 |
| Veto LLD | 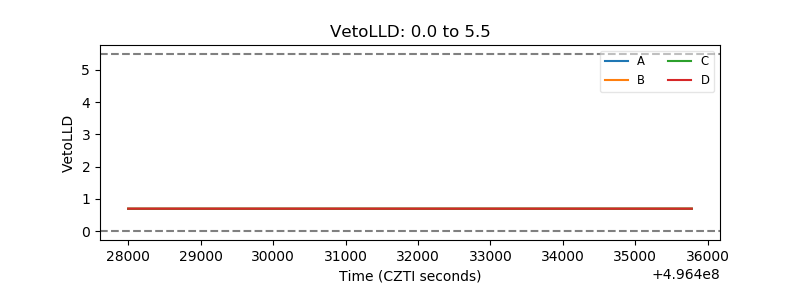 |
| Alpha Counter | 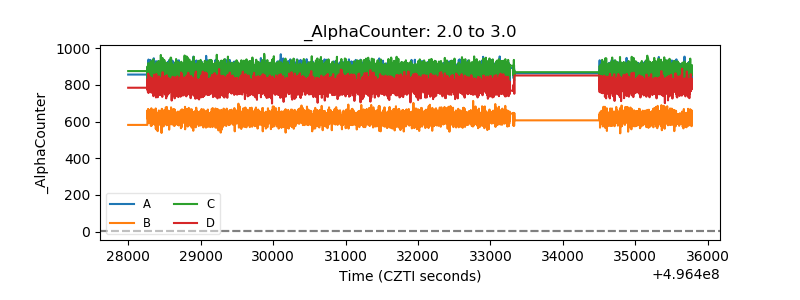 |
| _CPM_Rate | 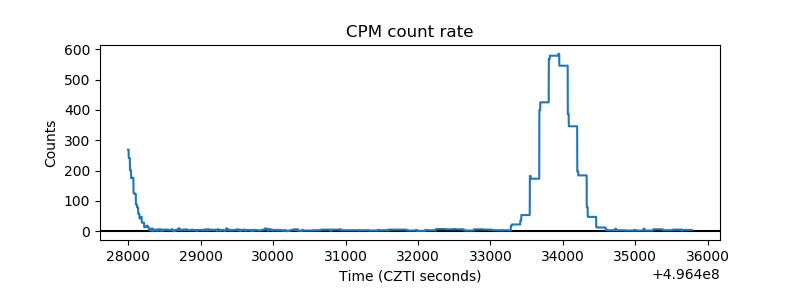 |
| CZT Counter | 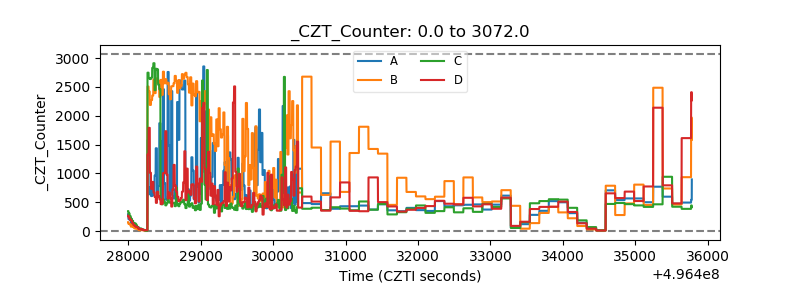 |
| +2.5 Volts monitor |  |
| +5 Volts monitor |  |
| _ROLL_ROT | 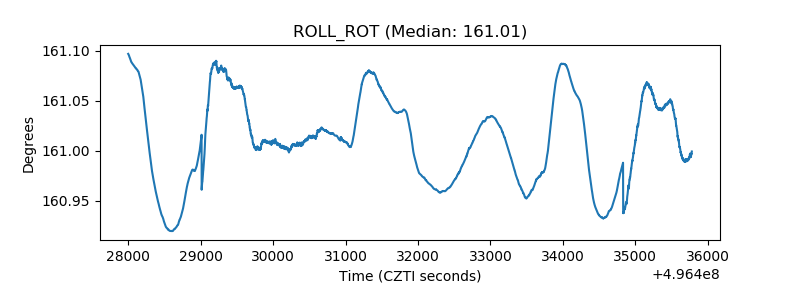 |
| _Roll_DEC | 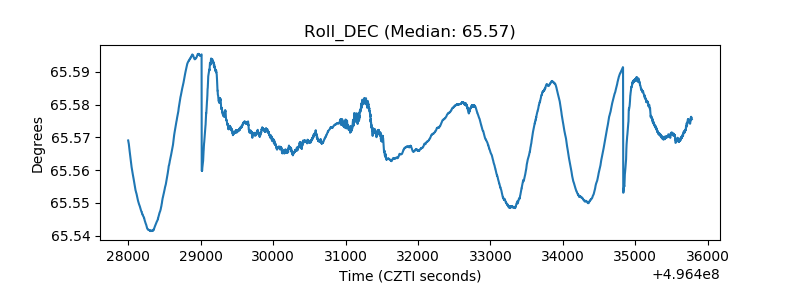 |
| _Roll_RA | 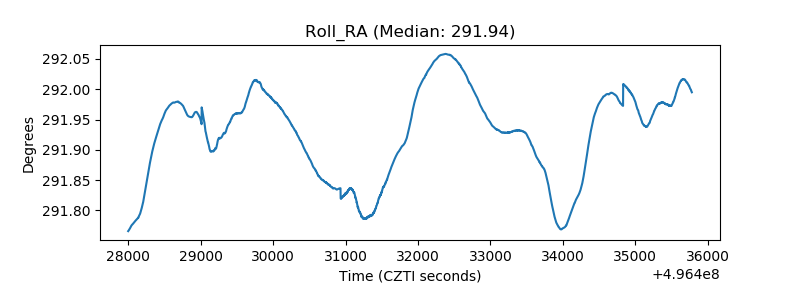 |
| Veto Counter | 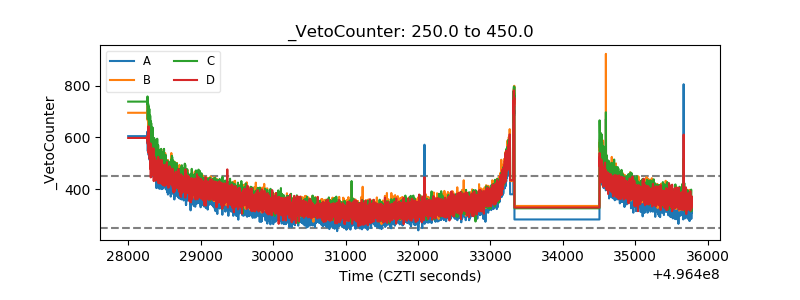 |