| Param | Original file | Final file |
|---|---|---|
| Filename | modeM0/AS1A14_041T01_9000006510_54057cztM0_level2.fits | modeM0/AS1A14_041T01_9000006510_54057cztM0_level2_quad_clean.evt |
| Size (bytes) | 571,461,120 | 126,239,040 |
| Size | 545.0 MB | 120.4 MB |
| Events in quadrant A | 5,771,666 | 779,877 |
| Events in quadrant B | 5,051,603 | 887,954 |
| Events in quadrant C | 4,144,676 | 801,702 |
| Events in quadrant D | 5,492,649 | 733,606 |
| Mode SS | |||
|---|---|---|---|
| Quadrant | BADHDUFLAG | Total packets | Discarded packets |
| A | 0 | 178 | 0 |
| B | 0 | 178 | 0 |
| C | 0 | 178 | 0 |
| D | 0 | 178 | 0 |
| Mode M0 | |||
|---|---|---|---|
| Quadrant | BADHDUFLAG | Total packets | Discarded packets |
| A | 0 | 23818 | 0 |
| B | 0 | 21541 | 0 |
| C | 0 | 19102 | 0 |
| D | 0 | 22764 | 0 |
| Quadrant | Total seconds | Saturated seconds | Saturation percentage |
|---|---|---|---|
| A | 8921 | 710 | 7.958749% |
| B | 8921 | 353 | 3.956955% |
| C | 8922 | 46 | 0.515579% |
| D | 8922 | 259 | 2.902937% |
Noise dominated data is calculated using 1-second bins in cleaned event files. If a bin has >2000 counts, and if more than 50% of those come from <1% of pixels, then it is considered to be noise-dominated and hence unusable.
| Quadrant | # 1 sec bins | Bins with >0 counts | Bins with >2000 counts | High rate bins dominated by noise | Noise dominated (total time) | Noise dominated (detector-on time) | Marked lightcurve |
|---|---|---|---|---|---|---|---|
| A | 8921 | 8921 | 466 | 466 | 5.22% | 5.22% | 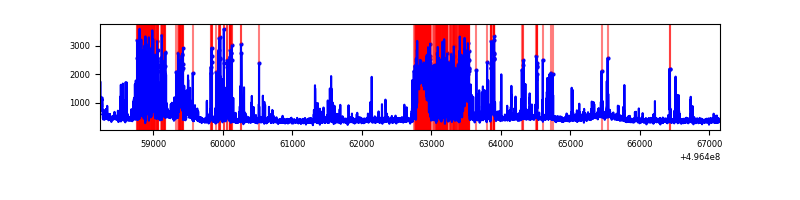 |
| B | 8921 | 8921 | 193 | 193 | 2.16% | 2.16% | 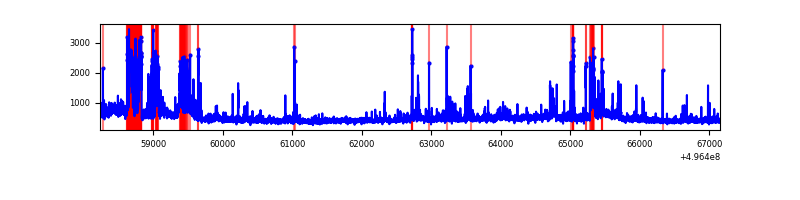 |
| C | 8922 | 8922 | 34 | 34 | 0.38% | 0.38% | 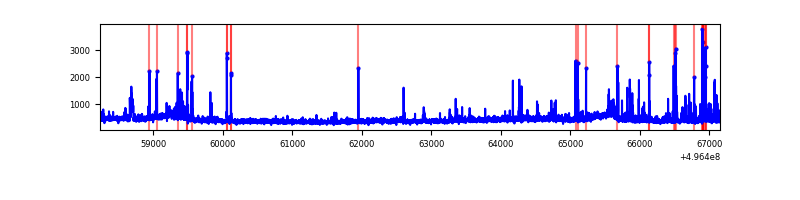 |
| D | 8922 | 8922 | 262 | 262 | 2.94% | 2.94% | 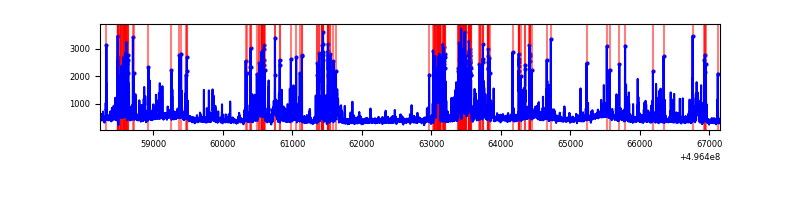 |
Top three noisy pixels from each quadrant. If the there are fewer than three noisy pixels in the level2.evt file, extra rows are filled as -1
| Pixel properties | Quadrant properties | ||||||
|---|---|---|---|---|---|---|---|
| Quadrant | DetID | PixID | Counts | Sigma | Mean | Median | Sigma |
| A | 12 | 15 | 1718707 | 7662.27 | 909 | 888 | 224.2 |
| A | 15 | 174 | 344921 | 1534.55 | 909 | 888 | 224.2 |
| A | 0 | 8 | 81315 | 358.74 | 909 | 888 | 224.2 |
| B | 2 | 249 | 461174 | 2301.9 | 936 | 901 | 200.0 |
| B | 7 | 252 | 265981 | 1325.71 | 936 | 901 | 200.0 |
| B | 0 | 213 | 135986 | 675.58 | 936 | 901 | 200.0 |
| C | 15 | 177 | 194051 | 755.36 | 934 | 925 | 255.7 |
| C | 12 | 252 | 61774 | 237.99 | 934 | 925 | 255.7 |
| C | 13 | 3 | 61460 | 236.77 | 934 | 925 | 255.7 |
| D | 3 | 12 | 923351 | 3600.89 | 908 | 867 | 256.2 |
| D | 8 | 176 | 421384 | 1641.48 | 908 | 867 | 256.2 |
| D | 14 | 52 | 264284 | 1028.24 | 908 | 867 | 256.2 |
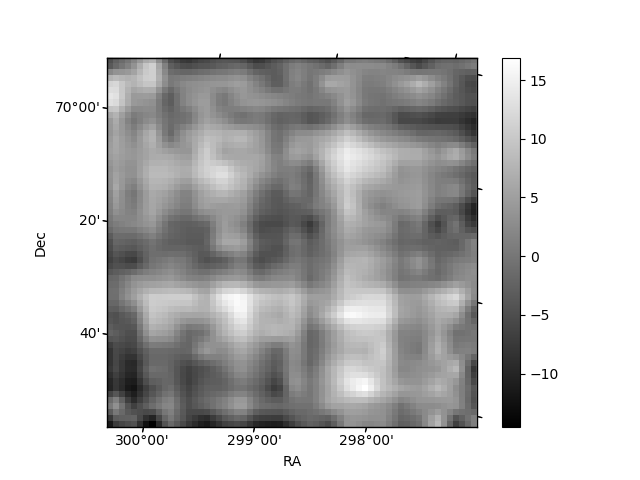
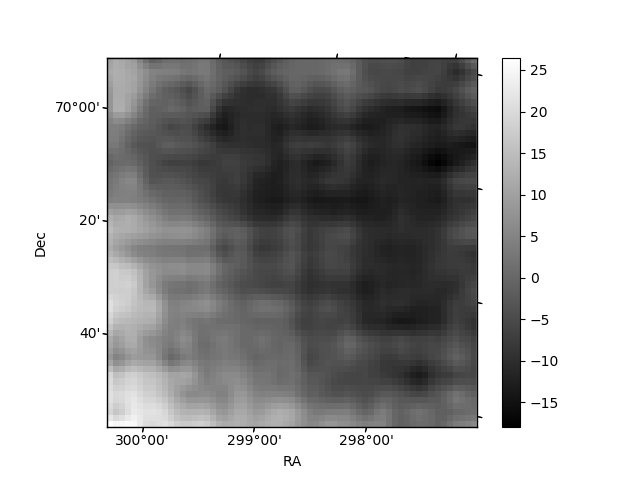
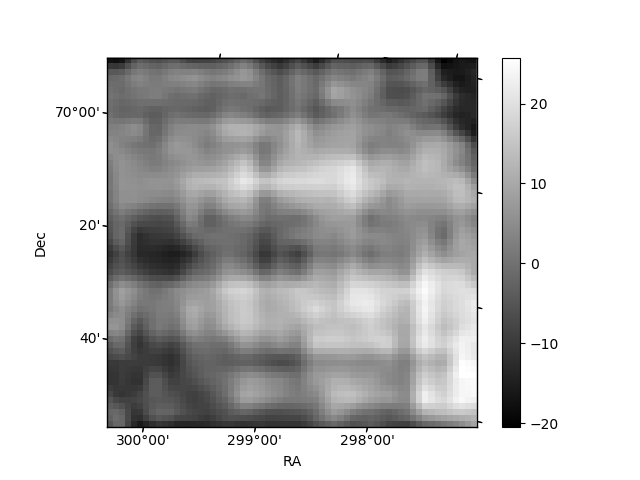
Histogram calculated using DETX and DETY for each event in the final _common_clean file
| Quadrant A | 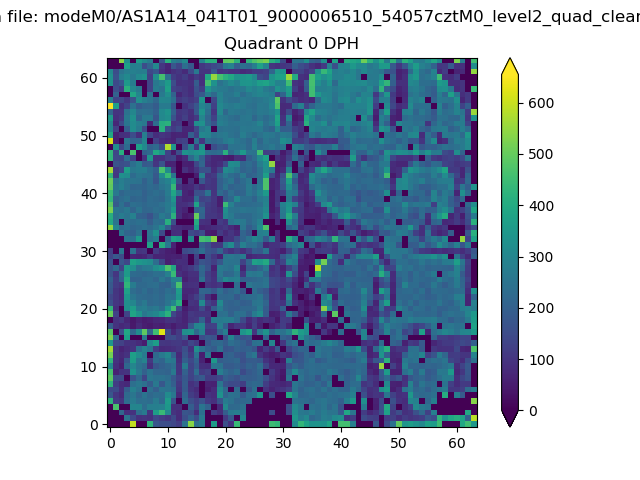 |
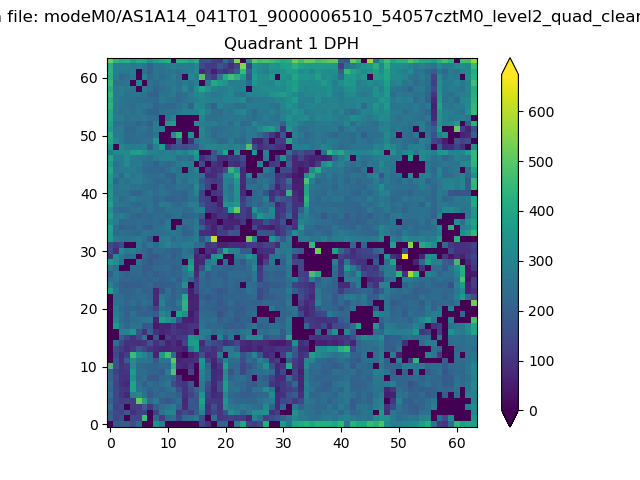 |
Quadrant B |
|---|---|---|---|
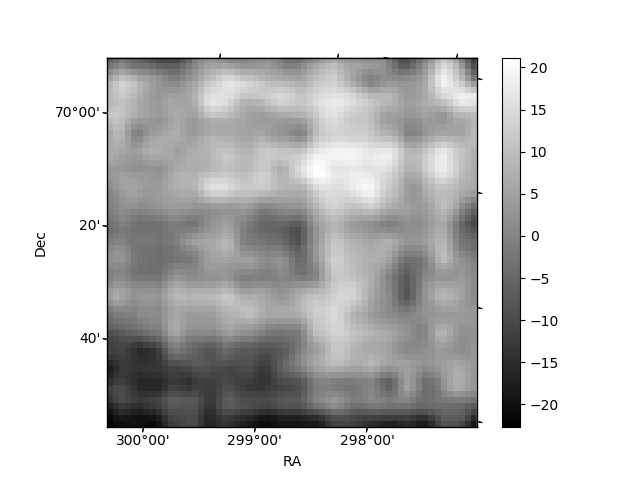
| Quadrant D | 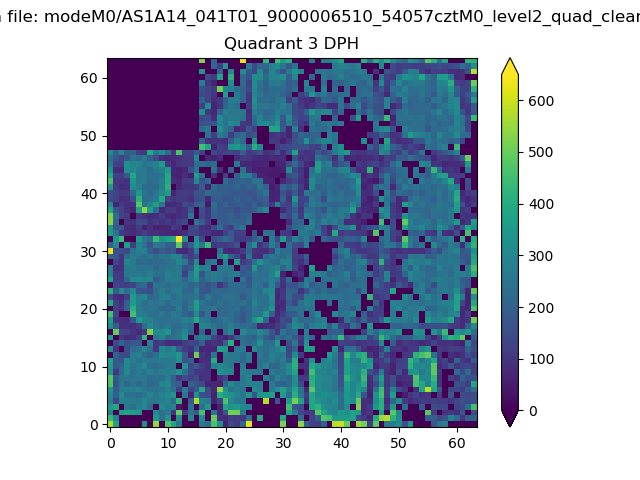 |
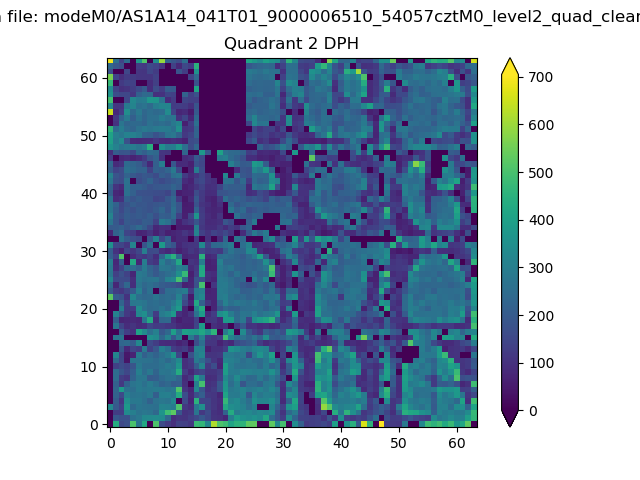 |
Quadrant C |
| Plot type | Count rate plots | Images |
|---|---|---|
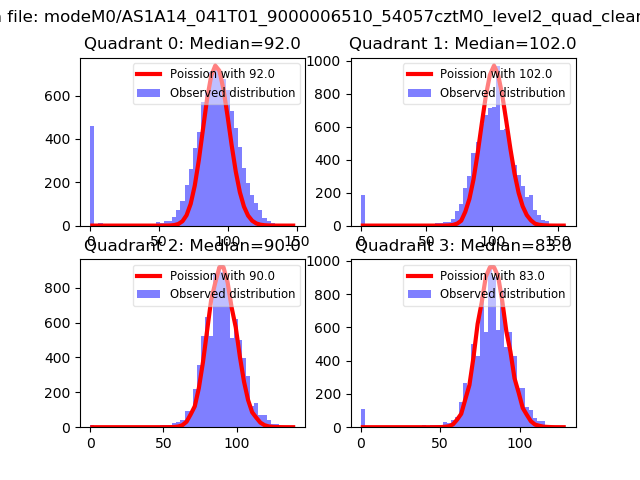
| Comparison with Poisson distribution Blue bars denote a histogram of data divided into 1 sec bins. Red curve is a Poisson curve with rate = median count rate of data. |
 |
 |
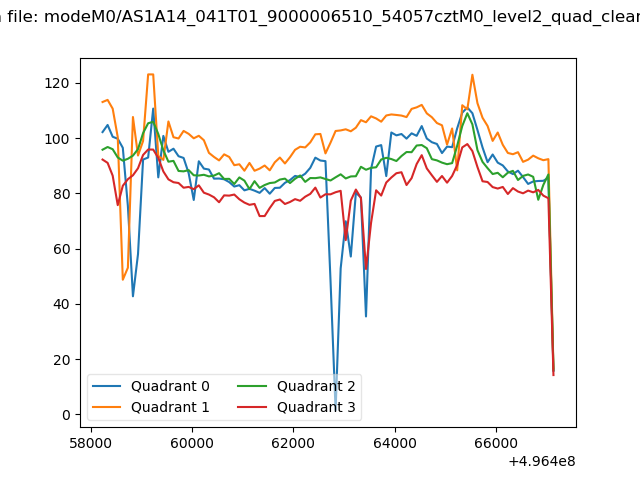
| Quadrant-wise count rates Data is divided into 100 sec bins |
 |
|
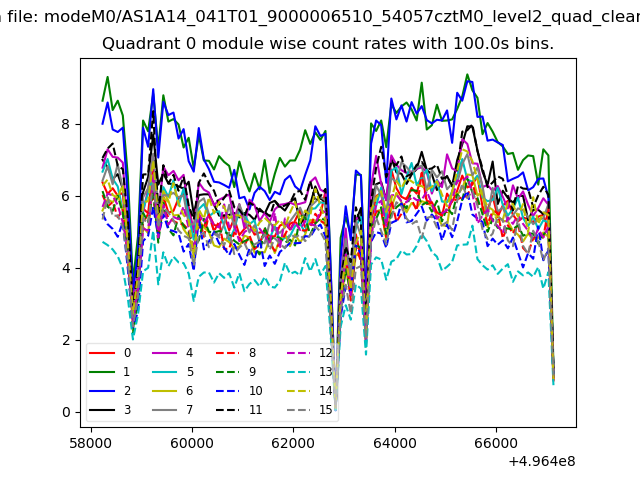
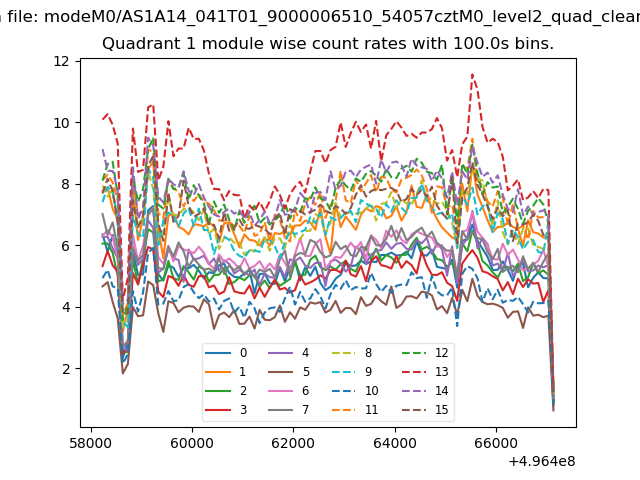
| Module-wise count rates for Quadrant A Data is divided into 100 sec bins |
 |
 |
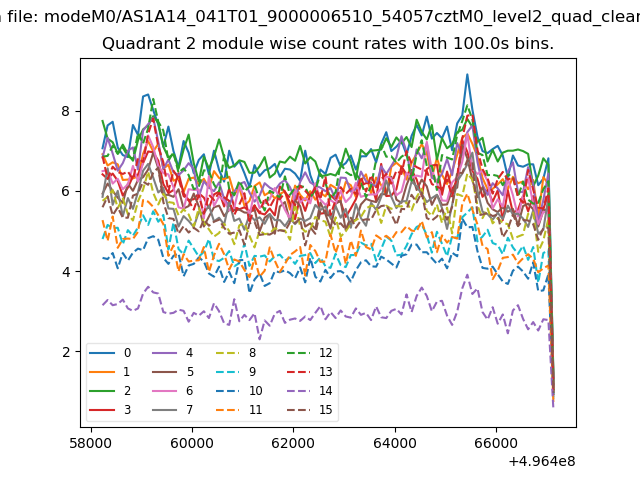
| Module-wise count rates for Quadrant B Data is divided into 100 sec bins |
 |
 |
| Module-wise count rates for Quadrant C Data is divided into 100 sec bins |
 |
 |
| Module-wise count rates for Quadrant D Data is divided into 100 sec bins |
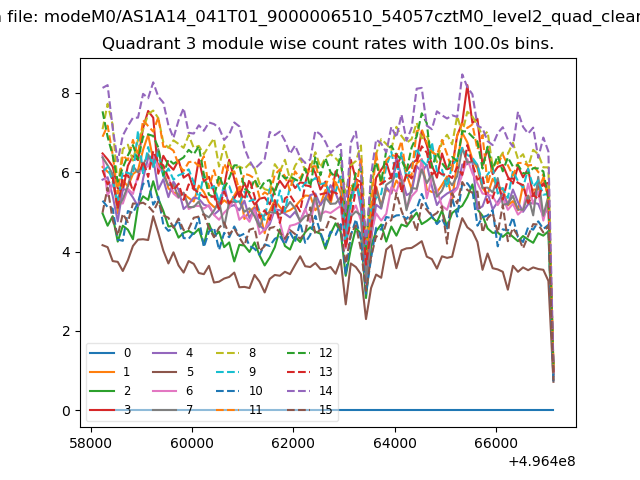 |
 |
| Parameter | Plot |
|---|---|
| CZT HV Monitor | 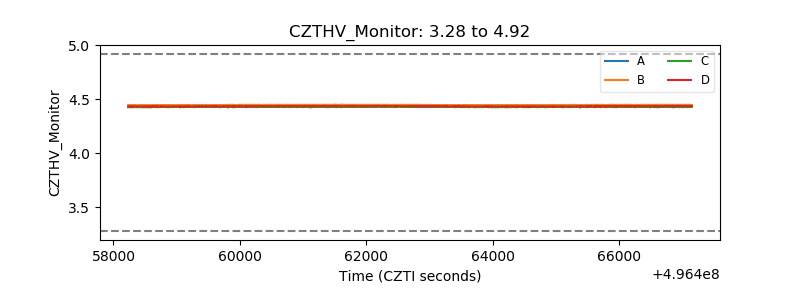 |
| D_VDD | 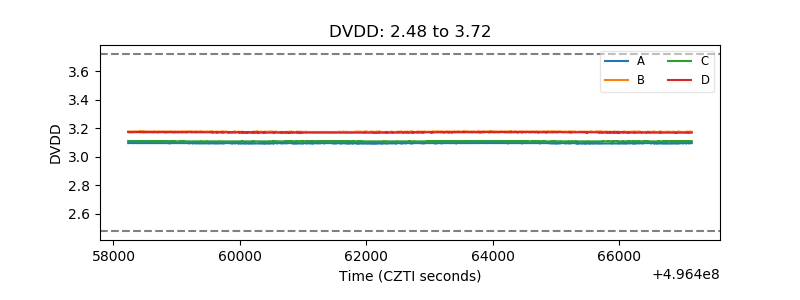 |
| Temperature 1 | 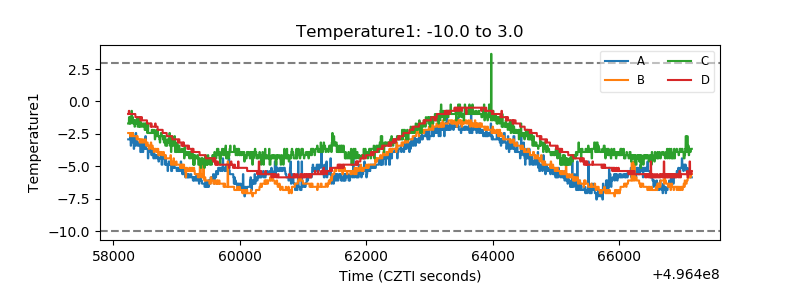 |
| Veto HV Monitor | 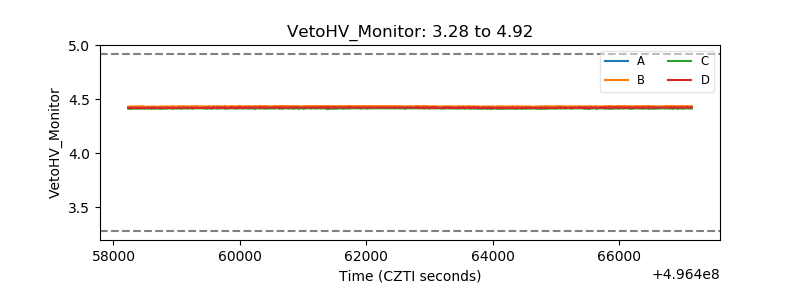 |
| Veto LLD | 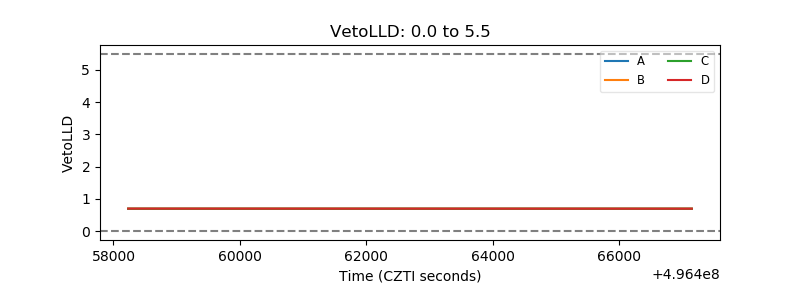 |
| Alpha Counter | 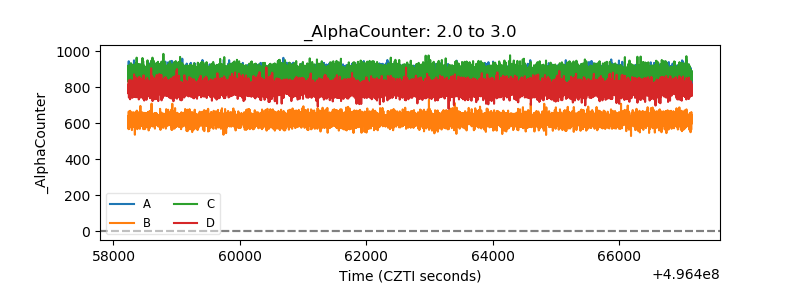 |
| _CPM_Rate | 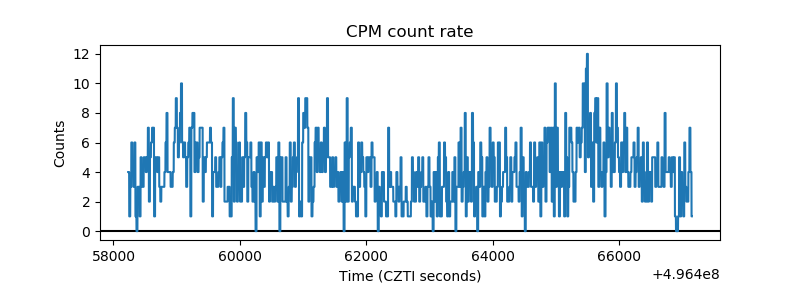 |
| CZT Counter | 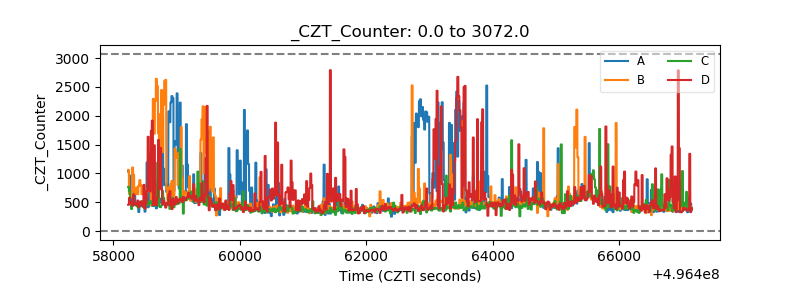 |
| +2.5 Volts monitor |  |
| +5 Volts monitor |  |
| _ROLL_ROT | 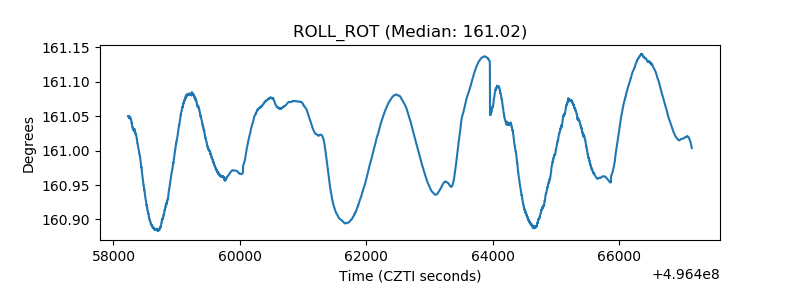 |
| _Roll_DEC | 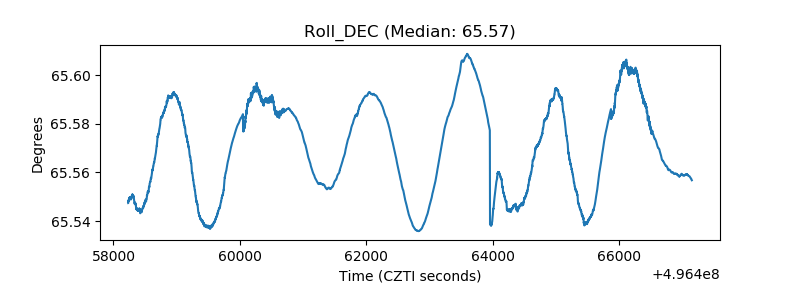 |
| _Roll_RA | 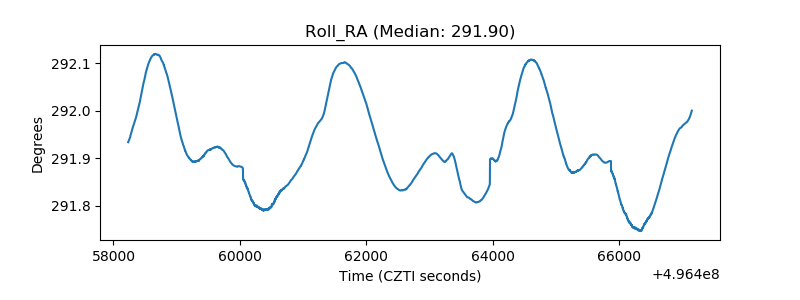 |
| Veto Counter | 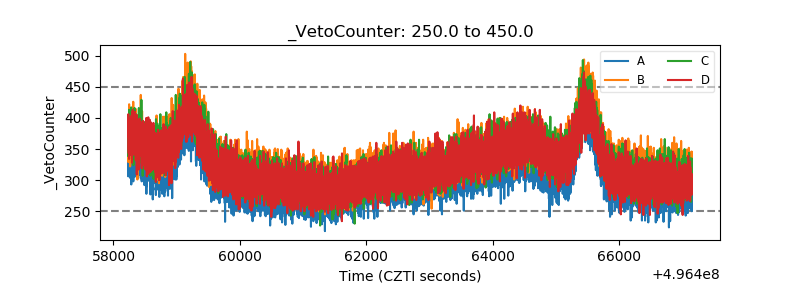 |