| Param | Original file | Final file |
|---|---|---|
| Filename | modeM0/AS1A14_041T01_9000006510_54061cztM0_level2.fits | modeM0/AS1A14_041T01_9000006510_54061cztM0_level2_quad_clean.evt |
| Size (bytes) | 531,175,680 | 87,652,800 |
| Size | 506.6 MB | 83.6 MB |
| Events in quadrant A | 3,616,710 | 579,458 |
| Events in quadrant B | 7,006,724 | 565,455 |
| Events in quadrant C | 4,149,384 | 547,455 |
| Events in quadrant D | 4,395,159 | 517,505 |
| Mode M9 | |||
|---|---|---|---|
| Quadrant | BADHDUFLAG | Total packets | Discarded packets |
| A | 0 | 8 | 0 |
| B | 0 | 8 | 0 |
| C | 0 | 8 | 0 |
| D | 0 | 8 | 0 |
| Mode SS | |||
|---|---|---|---|
| Quadrant | BADHDUFLAG | Total packets | Discarded packets |
| A | 0 | 128 | 0 |
| B | 0 | 128 | 0 |
| C | 0 | 128 | 0 |
| D | 0 | 128 | 0 |
| Mode M0 | |||
|---|---|---|---|
| Quadrant | BADHDUFLAG | Total packets | Discarded packets |
| A | 0 | 15396 | 1 |
| B | 0 | 25297 | 1 |
| C | 0 | 16888 | 1 |
| D | 0 | 17658 | 1 |
| Quadrant | Total seconds | Saturated seconds | Saturation percentage |
|---|---|---|---|
| A | 6369 | 273 | 4.286387% |
| B | 6369 | 1155 | 18.134715% |
| C | 6369 | 325 | 5.102842% |
| D | 6369 | 201 | 3.155911% |
Noise dominated data is calculated using 1-second bins in cleaned event files. If a bin has >2000 counts, and if more than 50% of those come from <1% of pixels, then it is considered to be noise-dominated and hence unusable.
| Quadrant | # 1 sec bins | Bins with >0 counts | Bins with >2000 counts | High rate bins dominated by noise | Noise dominated (total time) | Noise dominated (detector-on time) | Marked lightcurve |
|---|---|---|---|---|---|---|---|
| A | 7179 | 6369 | 175 | 175 | 2.44% | 2.75% | 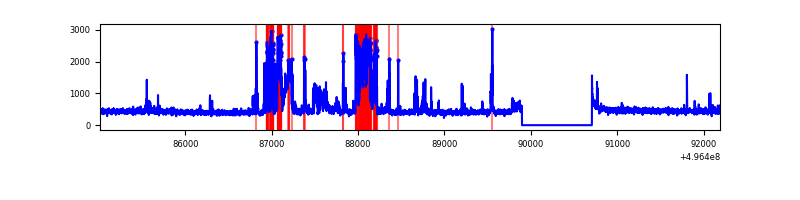 |
| B | 7179 | 6369 | 799 | 799 | 11.13% | 12.55% | 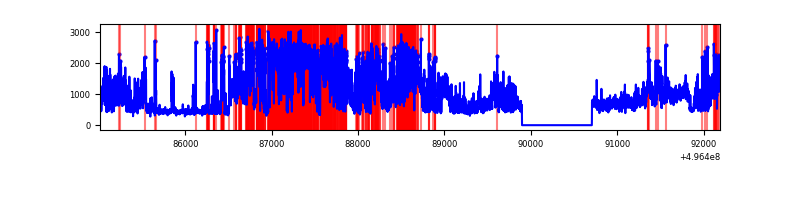 |
| C | 7179 | 6369 | 276 | 276 | 3.84% | 4.33% | 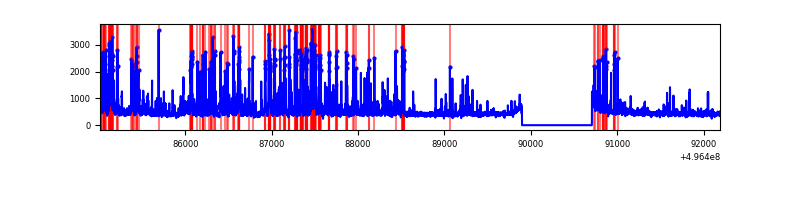 |
| D | 7179 | 6369 | 194 | 194 | 2.70% | 3.05% | 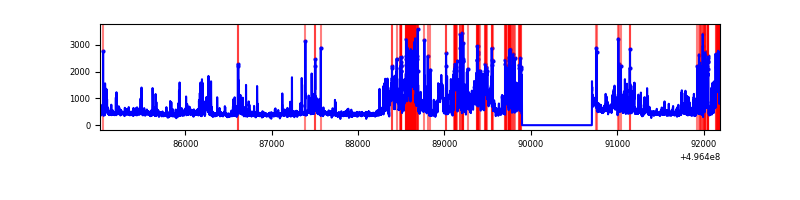 |
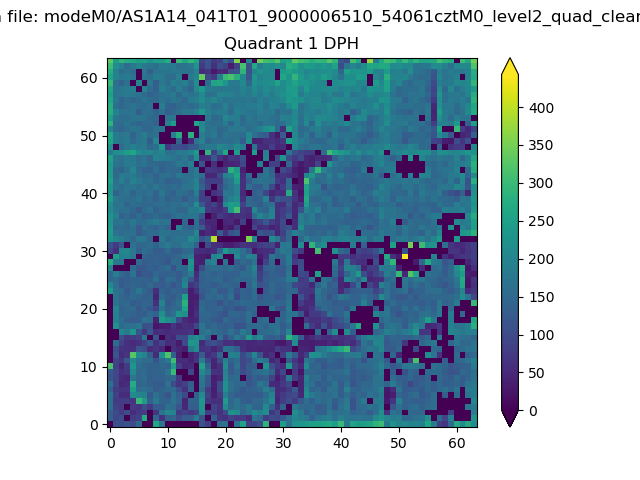
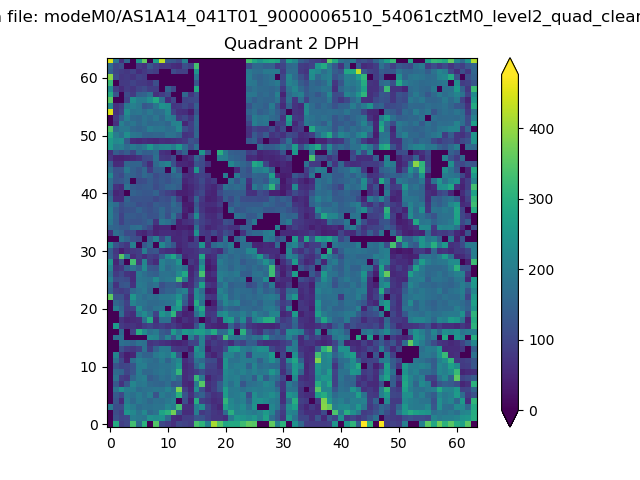
Top three noisy pixels from each quadrant. If the there are fewer than three noisy pixels in the level2.evt file, extra rows are filled as -1
| Pixel properties | Quadrant properties | ||||||
|---|---|---|---|---|---|---|---|
| Quadrant | DetID | PixID | Counts | Sigma | Mean | Median | Sigma |
| A | 15 | 174 | 868243 | 5225.3 | 667 | 649 | 166.0 |
| A | 0 | 8 | 67371 | 401.85 | 667 | 649 | 166.0 |
| A | 14 | 235 | 30836 | 181.81 | 667 | 649 | 166.0 |
| B | 15 | 20 | 3597135 | 26210.2 | 638 | 616 | 137.2 |
| B | 4 | 81 | 611704 | 4453.4 | 638 | 616 | 137.2 |
| B | 0 | 213 | 76790 | 555.13 | 638 | 616 | 137.2 |
| C | 15 | 177 | 1218639 | 6929.35 | 641 | 634 | 175.8 |
| C | 15 | 193 | 106616 | 602.94 | 641 | 634 | 175.8 |
| C | 12 | 252 | 61627 | 347.0 | 641 | 634 | 175.8 |
| D | 10 | 172 | 716302 | 3898.66 | 643 | 616 | 183.6 |
| D | 14 | 20 | 572679 | 3116.28 | 643 | 616 | 183.6 |
| D | 8 | 176 | 173202 | 940.15 | 643 | 616 | 183.6 |
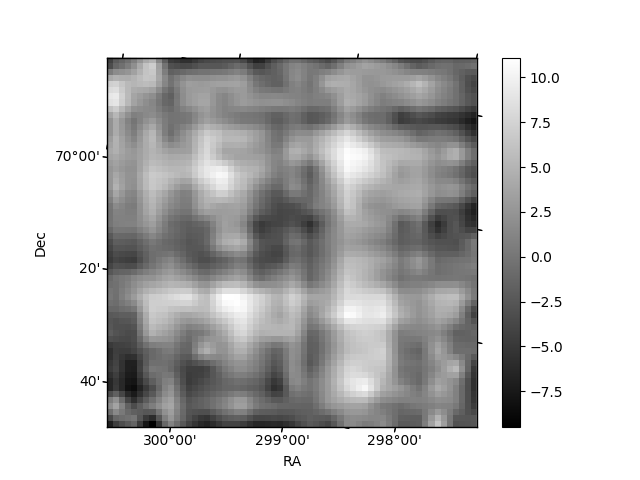
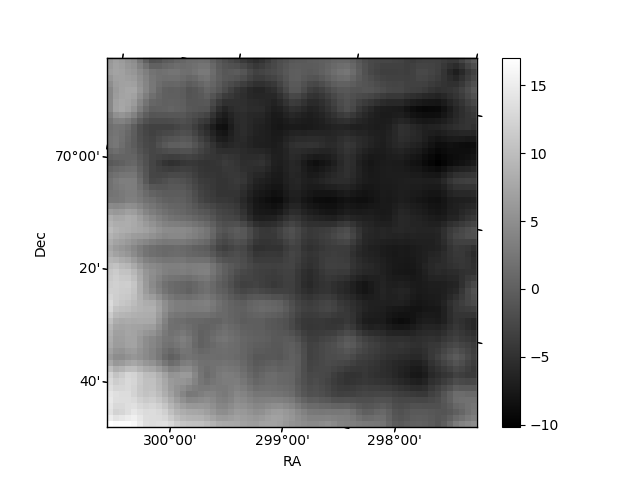
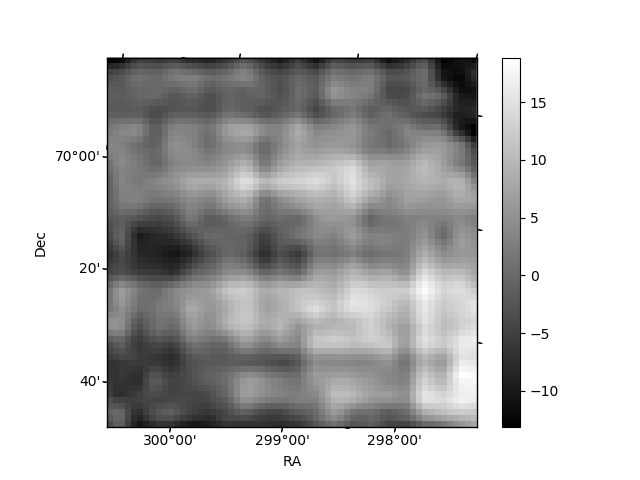
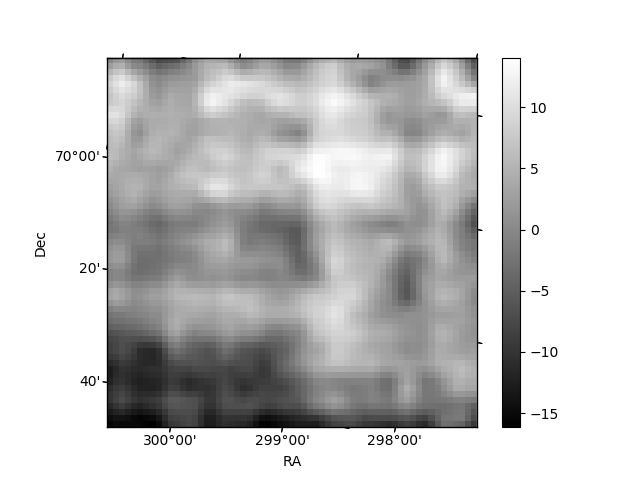
Histogram calculated using DETX and DETY for each event in the final _common_clean file
| Quadrant A | 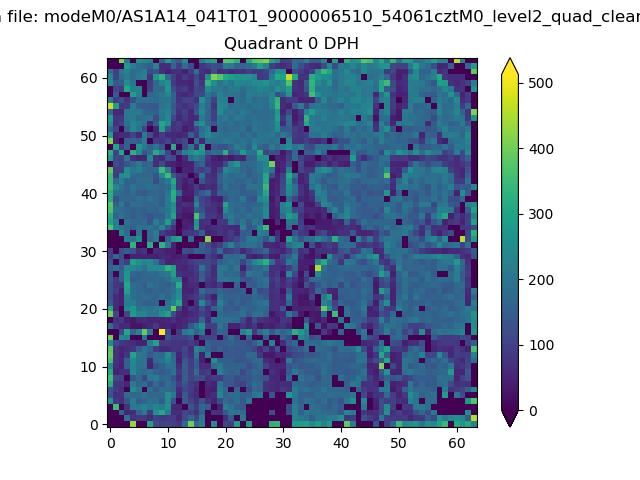 |
 |
Quadrant B |
|---|---|---|---|
| Quadrant D | 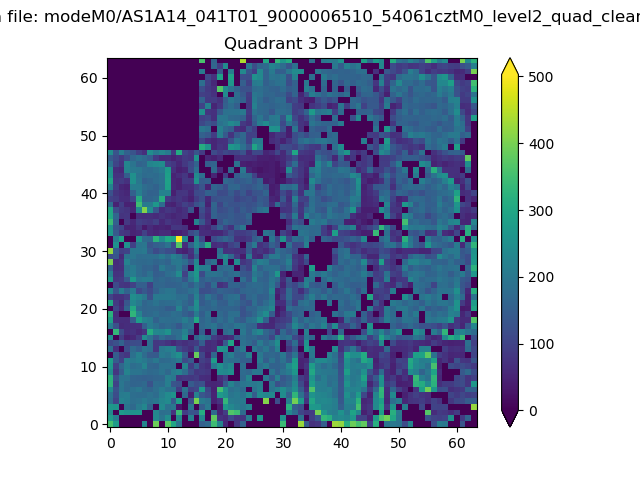 |
 |
Quadrant C |
| Plot type | Count rate plots | Images |
|---|---|---|
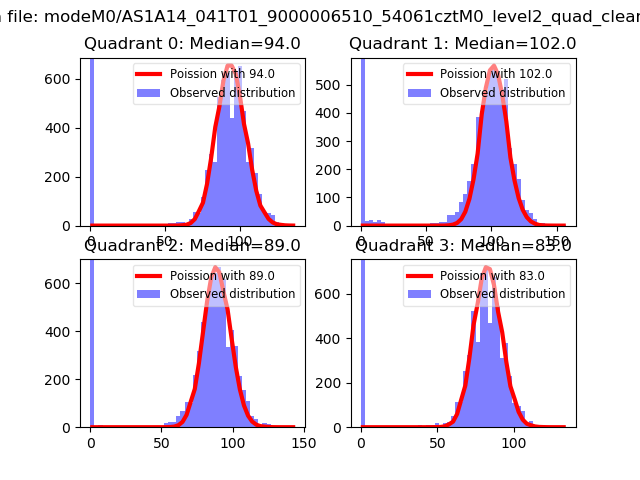
| Comparison with Poisson distribution Blue bars denote a histogram of data divided into 1 sec bins. Red curve is a Poisson curve with rate = median count rate of data. |
 |
 |
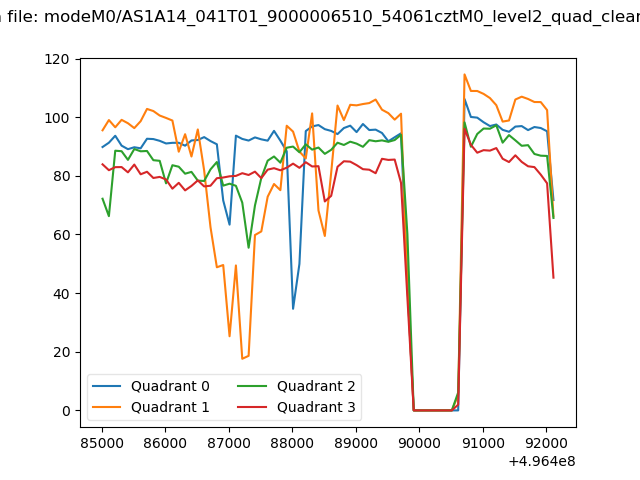
| Quadrant-wise count rates Data is divided into 100 sec bins |
 |
|
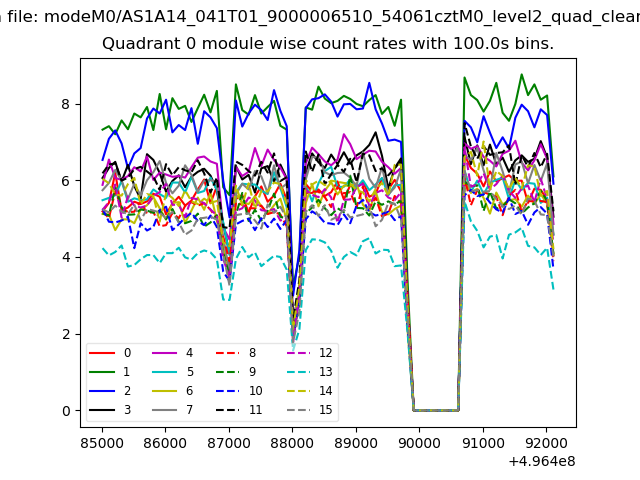
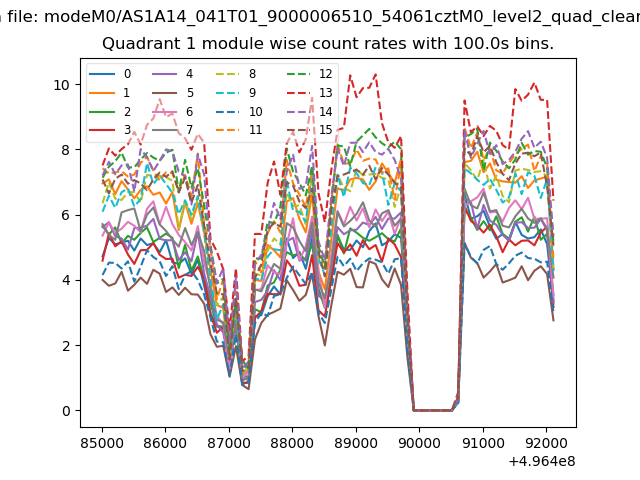
| Module-wise count rates for Quadrant A Data is divided into 100 sec bins |
 |
 |
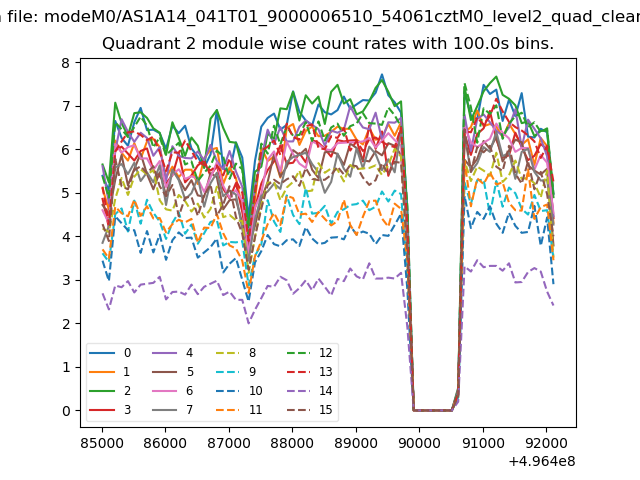
| Module-wise count rates for Quadrant B Data is divided into 100 sec bins |
 |
 |
| Module-wise count rates for Quadrant C Data is divided into 100 sec bins |
 |
 |
| Module-wise count rates for Quadrant D Data is divided into 100 sec bins |
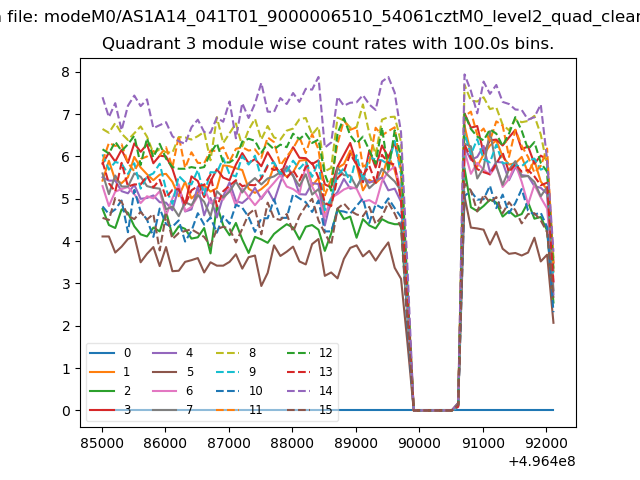 |
 |
| Parameter | Plot |
|---|---|
| CZT HV Monitor | 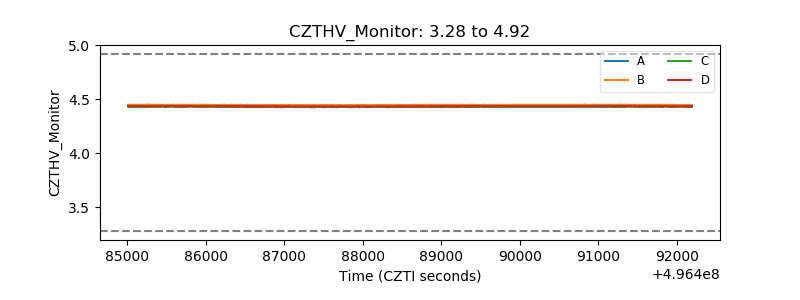 |
| D_VDD | 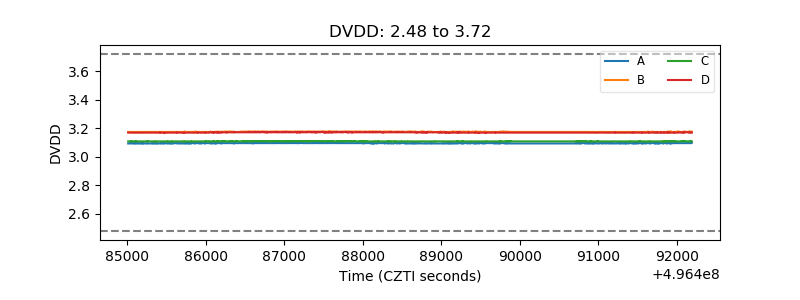 |
| Temperature 1 | 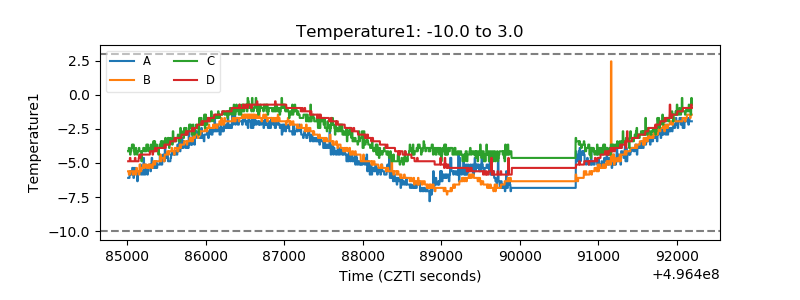 |
| Veto HV Monitor | 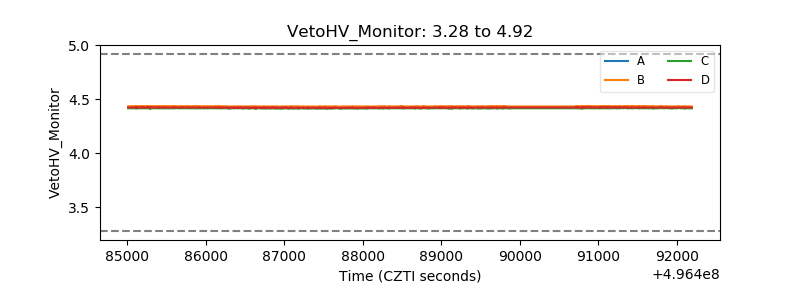 |
| Veto LLD | 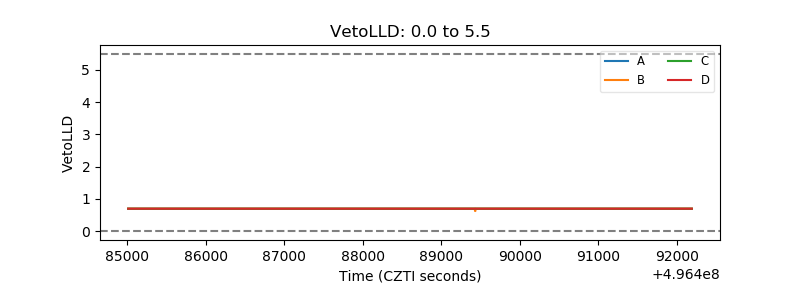 |
| Alpha Counter | 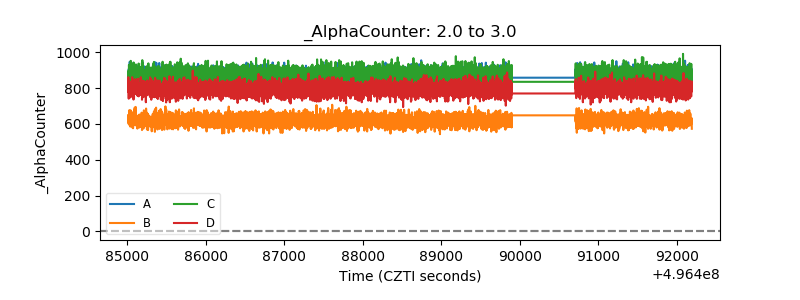 |
| _CPM_Rate | 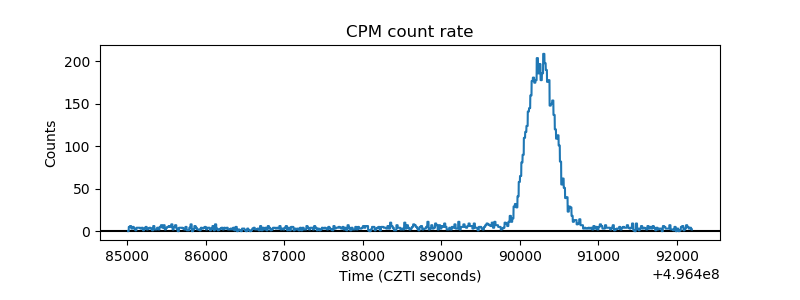 |
| CZT Counter | 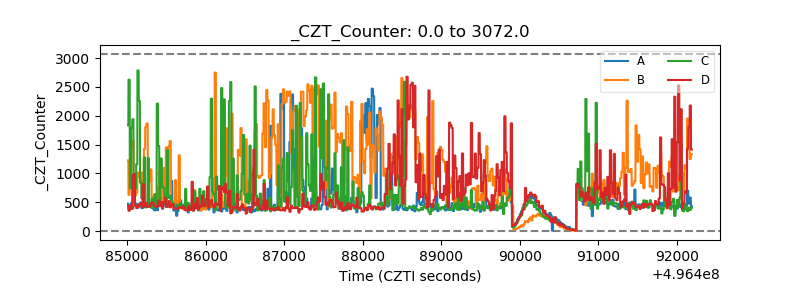 |
| +2.5 Volts monitor |  |
| +5 Volts monitor |  |
| _ROLL_ROT | 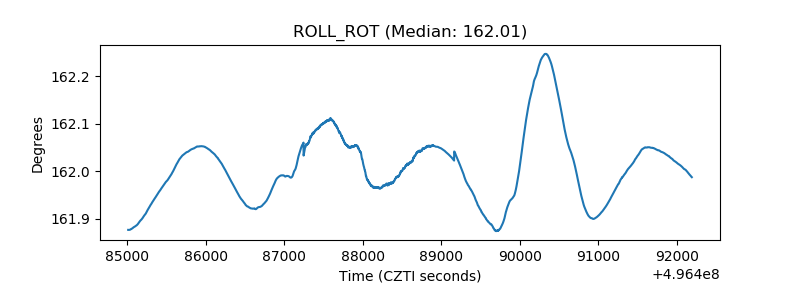 |
| _Roll_DEC | 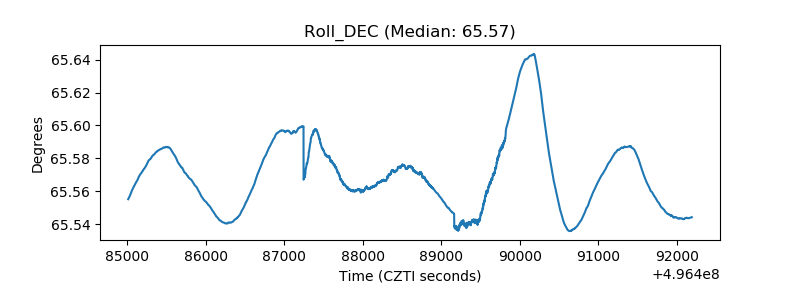 |
| _Roll_RA | 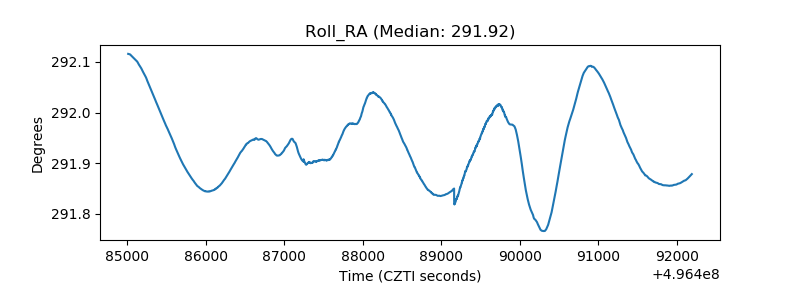 |
| Veto Counter | 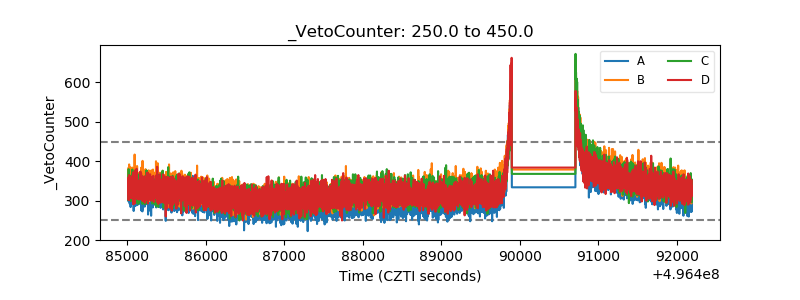 |