| Param | Original file | Final file |
|---|---|---|
| Filename | modeM0/AS1A14_041T01_9000006510_54064cztM0_level2.fits | modeM0/AS1A14_041T01_9000006510_54064cztM0_level2_quad_clean.evt |
| Size (bytes) | 511,482,240 | 88,410,240 |
| Size | 487.8 MB | 84.3 MB |
| Events in quadrant A | 3,544,163 | 591,214 |
| Events in quadrant B | 3,778,292 | 654,503 |
| Events in quadrant C | 4,485,795 | 550,401 |
| Events in quadrant D | 6,644,268 | 448,737 |
| Mode M9 | |||
|---|---|---|---|
| Quadrant | BADHDUFLAG | Total packets | Discarded packets |
| A | 0 | 11 | 0 |
| B | 0 | 11 | 0 |
| C | 0 | 11 | 0 |
| D | 0 | 11 | 0 |
| Mode SS | |||
|---|---|---|---|
| Quadrant | BADHDUFLAG | Total packets | Discarded packets |
| A | 0 | 126 | 0 |
| B | 0 | 126 | 0 |
| C | 0 | 126 | 0 |
| D | 0 | 126 | 0 |
| Mode M0 | |||
|---|---|---|---|
| Quadrant | BADHDUFLAG | Total packets | Discarded packets |
| A | 0 | 15001 | 5 |
| B | 0 | 15787 | 1 |
| C | 0 | 17715 | 1 |
| D | 0 | 24030 | 1 |
| Quadrant | Total seconds | Saturated seconds | Saturation percentage |
|---|---|---|---|
| A | 6187 | 318 | 5.139809% |
| B | 6188 | 196 | 3.167421% |
| C | 6188 | 352 | 5.688429% |
| D | 6188 | 1169 | 18.891403% |
Noise dominated data is calculated using 1-second bins in cleaned event files. If a bin has >2000 counts, and if more than 50% of those come from <1% of pixels, then it is considered to be noise-dominated and hence unusable.
| Quadrant | # 1 sec bins | Bins with >0 counts | Bins with >2000 counts | High rate bins dominated by noise | Noise dominated (total time) | Noise dominated (detector-on time) | Marked lightcurve |
|---|---|---|---|---|---|---|---|
| A | 7256 | 6186 | 238 | 238 | 3.28% | 3.85% | 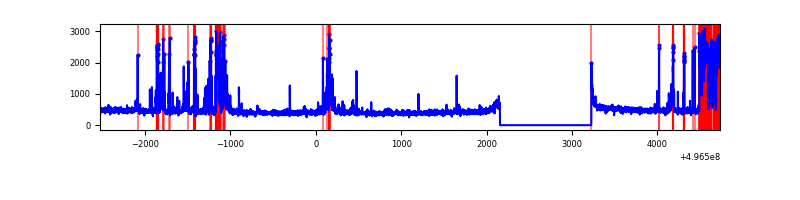 |
| B | 7258 | 6188 | 102 | 102 | 1.41% | 1.65% | 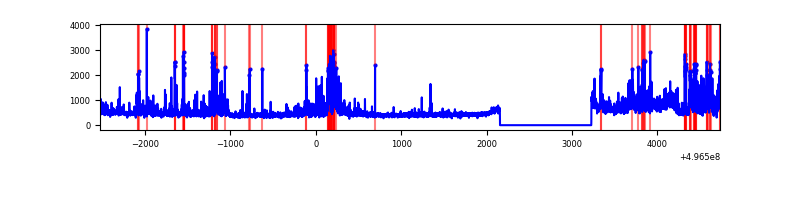 |
| C | 7258 | 6188 | 308 | 308 | 4.24% | 4.98% | 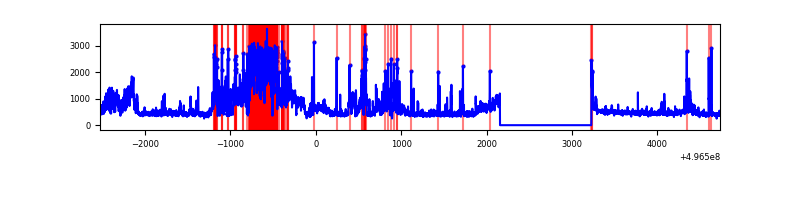 |
| D | 7258 | 6188 | 1113 | 1113 | 15.33% | 17.99% | 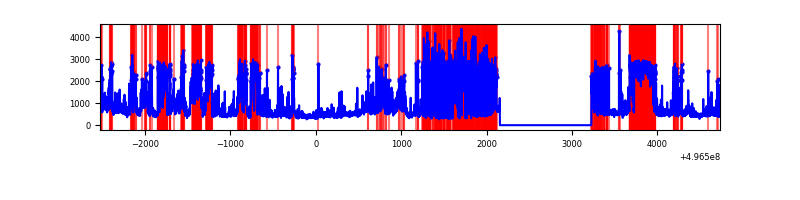 |
Top three noisy pixels from each quadrant. If the there are fewer than three noisy pixels in the level2.evt file, extra rows are filled as -1
| Pixel properties | Quadrant properties | ||||||
|---|---|---|---|---|---|---|---|
| Quadrant | DetID | PixID | Counts | Sigma | Mean | Median | Sigma |
| A | 15 | 174 | 854847 | 5252.59 | 653 | 636 | 162.6 |
| A | 3 | 94 | 44739 | 271.19 | 653 | 636 | 162.6 |
| A | 4 | 3 | 33338 | 201.09 | 653 | 636 | 162.6 |
| B | 15 | 20 | 600260 | 4298.37 | 654 | 633 | 139.5 |
| B | 7 | 252 | 138053 | 985.08 | 654 | 633 | 139.5 |
| B | 0 | 213 | 117842 | 840.2 | 654 | 633 | 139.5 |
| C | 9 | 53 | 982636 | 5694.01 | 630 | 624 | 172.5 |
| C | 15 | 157 | 639294 | 3703.21 | 630 | 624 | 172.5 |
| C | 12 | 250 | 159812 | 923.02 | 630 | 624 | 172.5 |
| D | 14 | 20 | 1284079 | 7661.71 | 585 | 558 | 167.5 |
| D | 8 | 176 | 1009175 | 6020.73 | 585 | 558 | 167.5 |
| D | 10 | 172 | 744709 | 4442.05 | 585 | 558 | 167.5 |
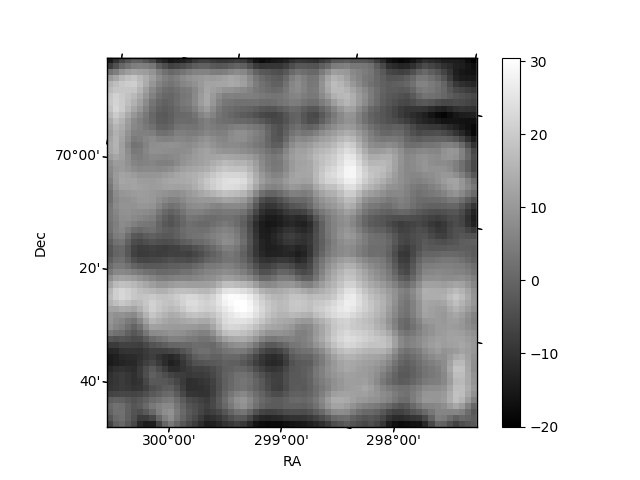
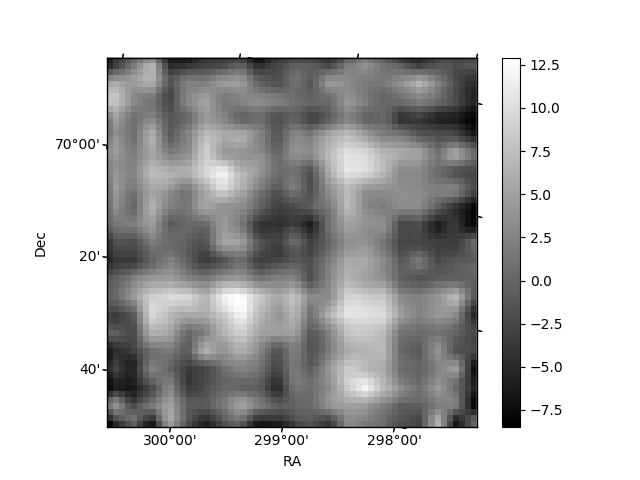
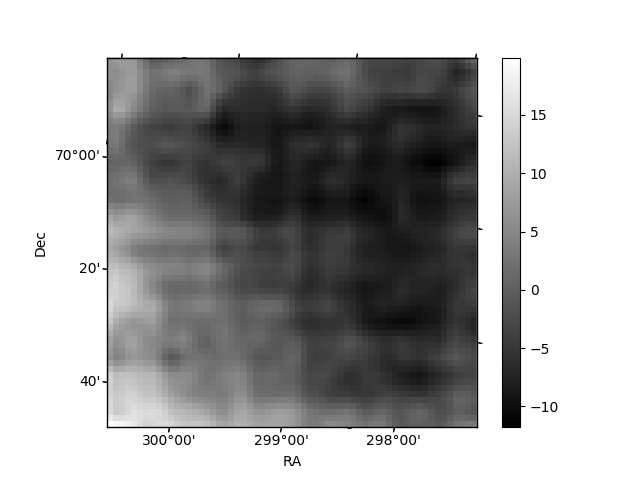
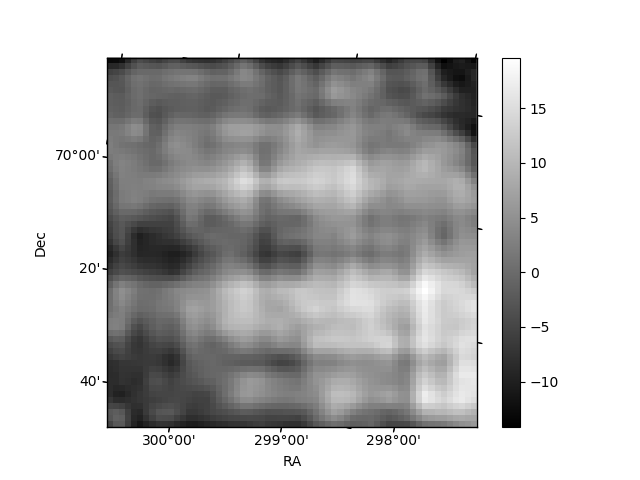
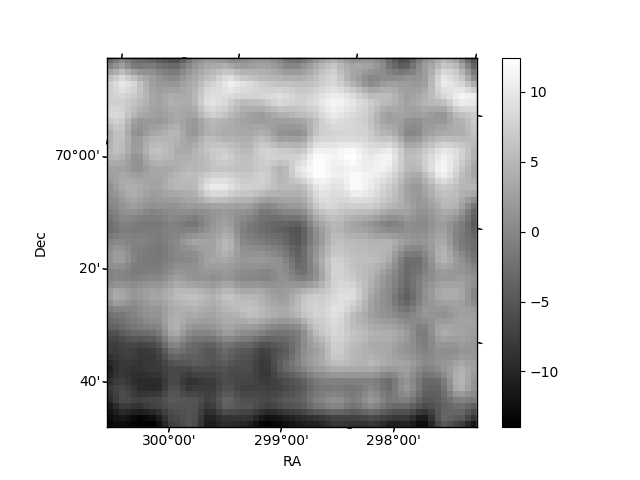
Histogram calculated using DETX and DETY for each event in the final _common_clean file
| Quadrant A | 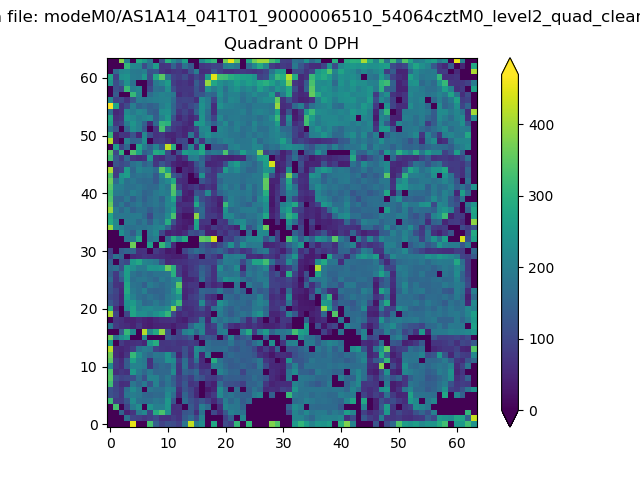 |
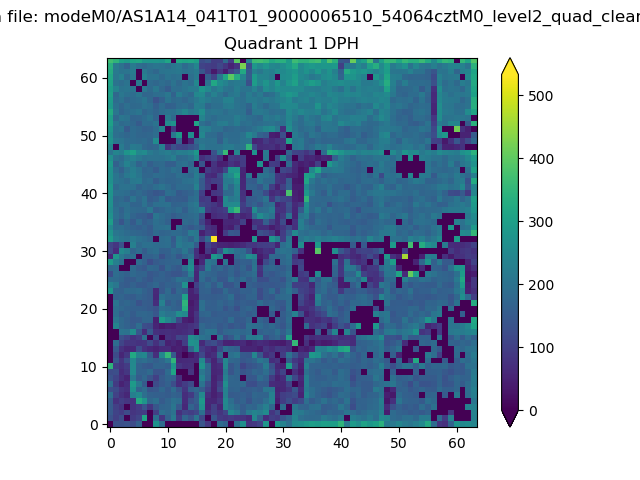 |
Quadrant B |
|---|---|---|---|
| Quadrant D | 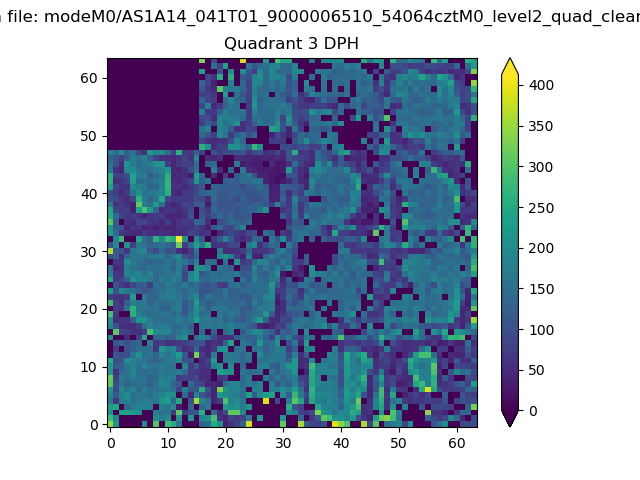 |
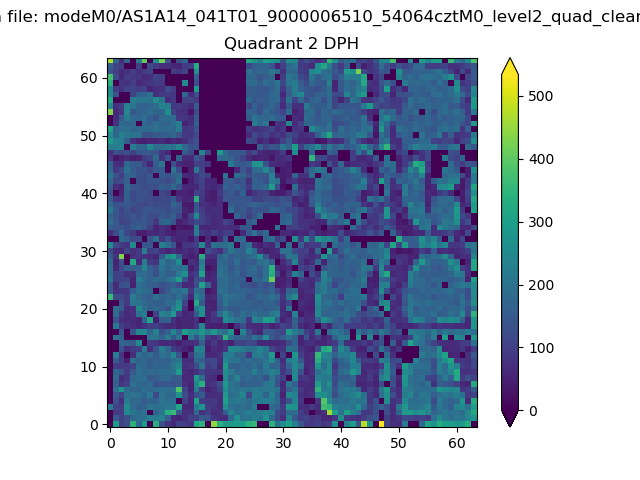 |
Quadrant C |
| Plot type | Count rate plots | Images |
|---|---|---|
| Comparison with Poisson distribution Blue bars denote a histogram of data divided into 1 sec bins. Red curve is a Poisson curve with rate = median count rate of data. |
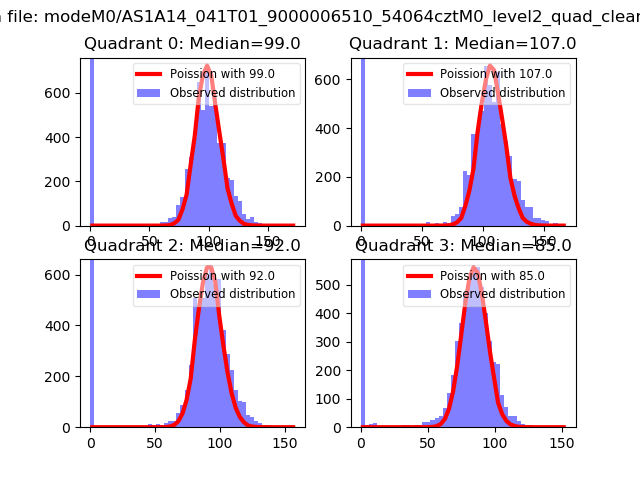 |
 |
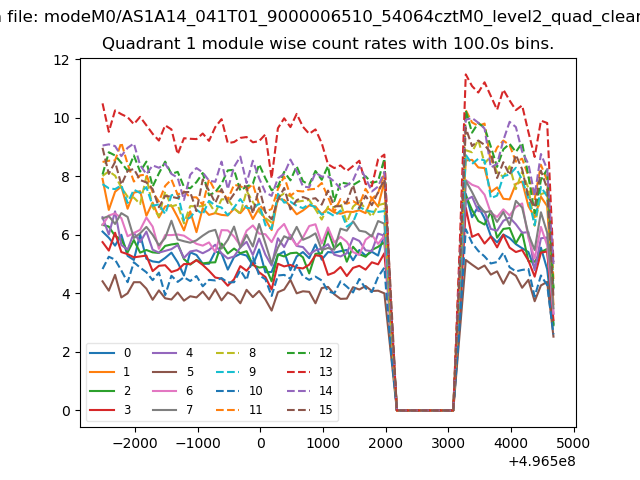
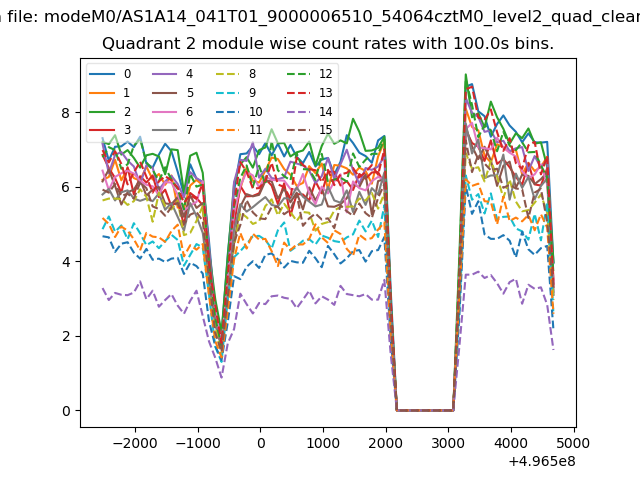
| Quadrant-wise count rates Data is divided into 100 sec bins |
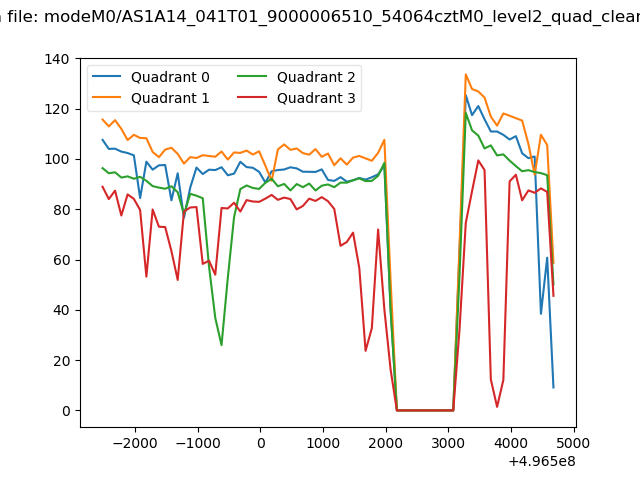 |
|
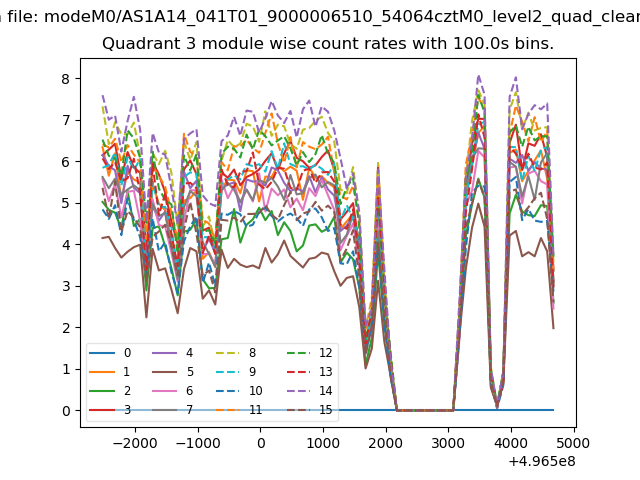
| Module-wise count rates for Quadrant A Data is divided into 100 sec bins |
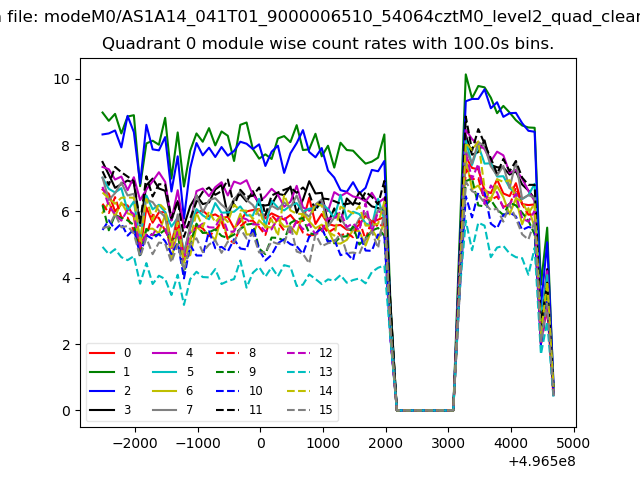 |
 |
| Module-wise count rates for Quadrant B Data is divided into 100 sec bins |
 |
 |
| Module-wise count rates for Quadrant C Data is divided into 100 sec bins |
 |
 |
| Module-wise count rates for Quadrant D Data is divided into 100 sec bins |
 |
 |
| Parameter | Plot |
|---|---|
| CZT HV Monitor | 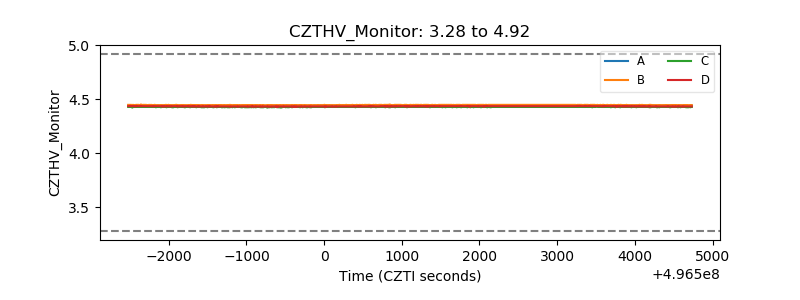 |
| D_VDD | 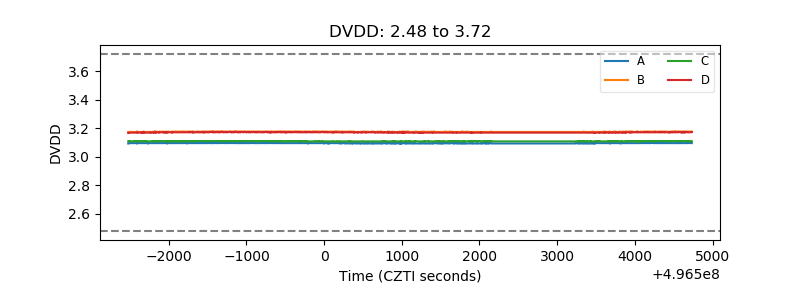 |
| Temperature 1 | 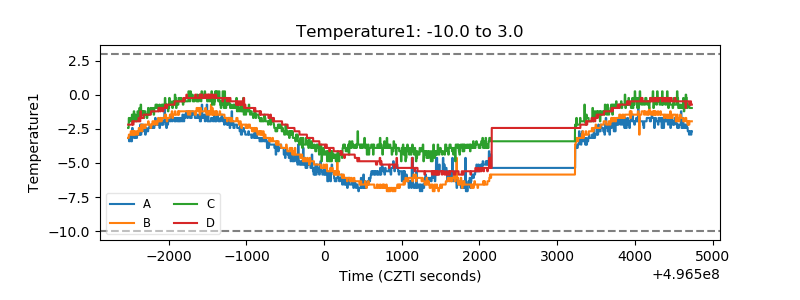 |
| Veto HV Monitor | 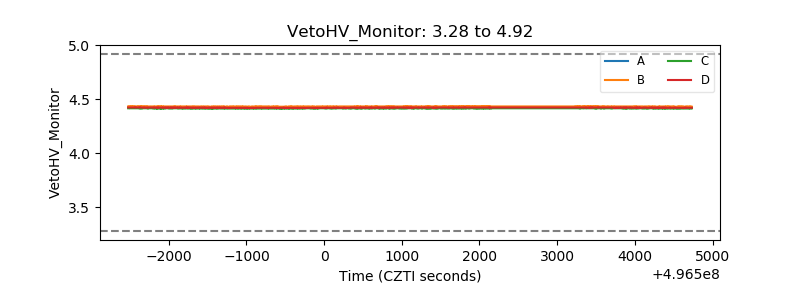 |
| Veto LLD | 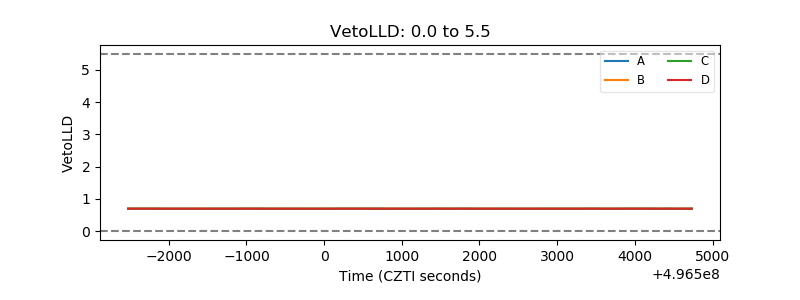 |
| Alpha Counter | 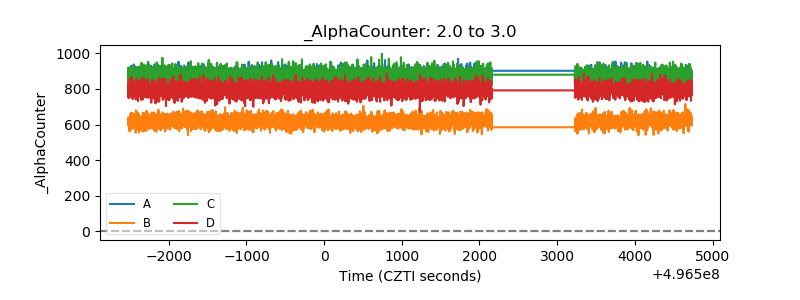 |
| _CPM_Rate | 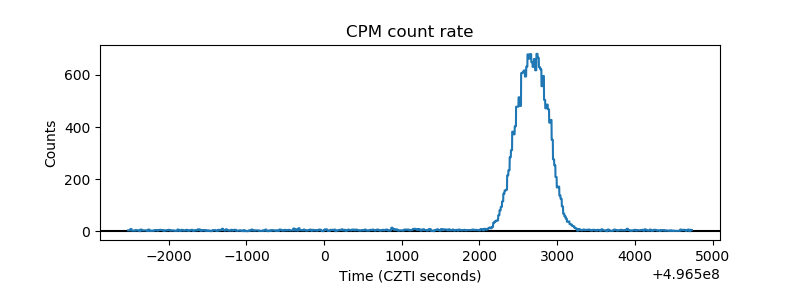 |
| CZT Counter | 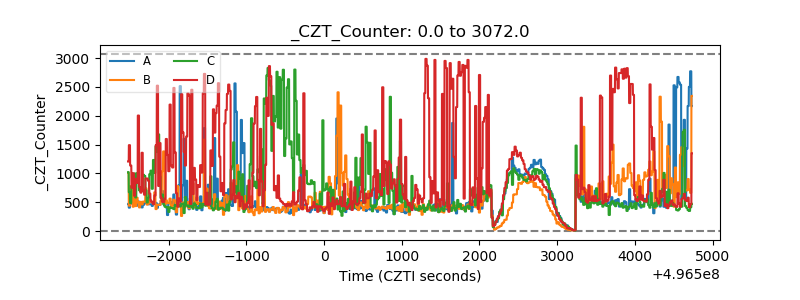 |
| +2.5 Volts monitor |  |
| +5 Volts monitor |  |
| _ROLL_ROT | 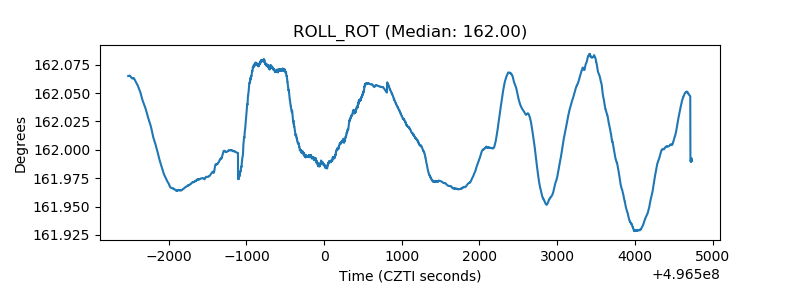 |
| _Roll_DEC | 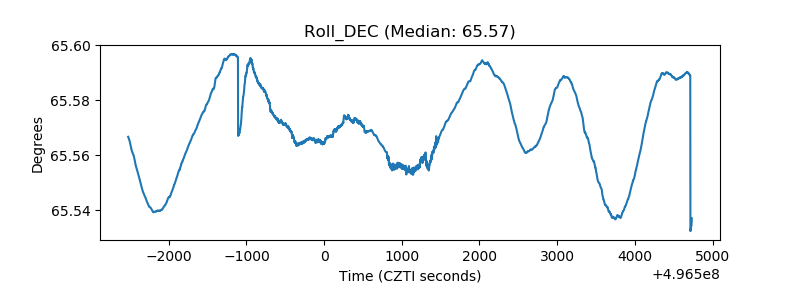 |
| _Roll_RA | 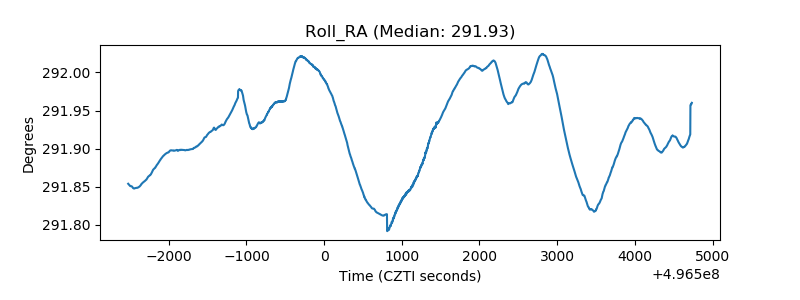 |
| Veto Counter | 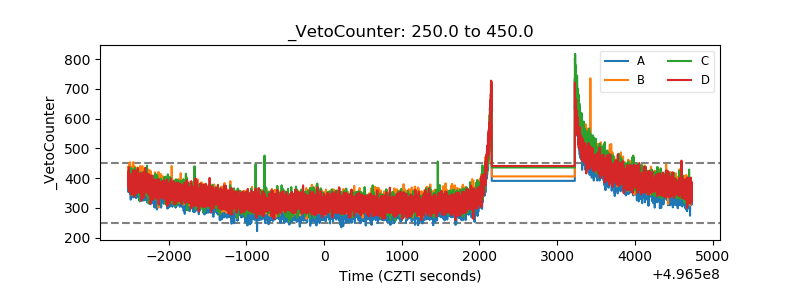 |