| Param | Original file | Final file |
|---|---|---|
| Filename | modeM0/AS1A14_041T01_9000006510_54066cztM0_level2.fits | modeM0/AS1A14_041T01_9000006510_54066cztM0_level2_quad_clean.evt |
| Size (bytes) | 488,053,440 | 95,999,040 |
| Size | 465.4 MB | 91.6 MB |
| Events in quadrant A | 3,244,186 | 645,179 |
| Events in quadrant B | 5,887,735 | 677,429 |
| Events in quadrant C | 3,754,471 | 597,938 |
| Events in quadrant D | 4,684,599 | 540,892 |
| Mode M9 | |||
|---|---|---|---|
| Quadrant | BADHDUFLAG | Total packets | Discarded packets |
| A | 0 | 11 | 0 |
| B | 0 | 11 | 0 |
| C | 0 | 11 | 0 |
| D | 0 | 11 | 0 |
| Mode SS | |||
|---|---|---|---|
| Quadrant | BADHDUFLAG | Total packets | Discarded packets |
| A | 0 | 132 | 0 |
| B | 0 | 132 | 0 |
| C | 0 | 132 | 0 |
| D | 0 | 132 | 0 |
| Mode M0 | |||
|---|---|---|---|
| Quadrant | BADHDUFLAG | Total packets | Discarded packets |
| A | 0 | 14220 | 1 |
| B | 0 | 21949 | 1 |
| C | 0 | 15790 | 1 |
| D | 0 | 18561 | 1 |
| Quadrant | Total seconds | Saturated seconds | Saturation percentage |
|---|---|---|---|
| A | 6376 | 135 | 2.117315% |
| B | 6376 | 418 | 6.555834% |
| C | 6376 | 283 | 4.438519% |
| D | 6376 | 434 | 6.806775% |
Noise dominated data is calculated using 1-second bins in cleaned event files. If a bin has >2000 counts, and if more than 50% of those come from <1% of pixels, then it is considered to be noise-dominated and hence unusable.
| Quadrant | # 1 sec bins | Bins with >0 counts | Bins with >2000 counts | High rate bins dominated by noise | Noise dominated (total time) | Noise dominated (detector-on time) | Marked lightcurve |
|---|---|---|---|---|---|---|---|
| A | 7546 | 6376 | 63 | 63 | 0.83% | 0.99% | 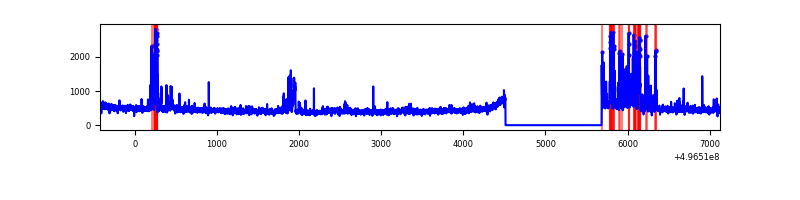 |
| B | 7546 | 6376 | 250 | 250 | 3.31% | 3.92% | 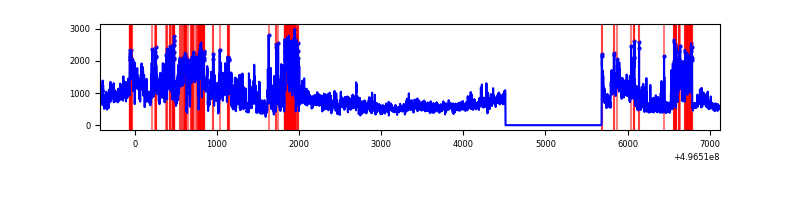 |
| C | 7546 | 6376 | 213 | 213 | 2.82% | 3.34% | 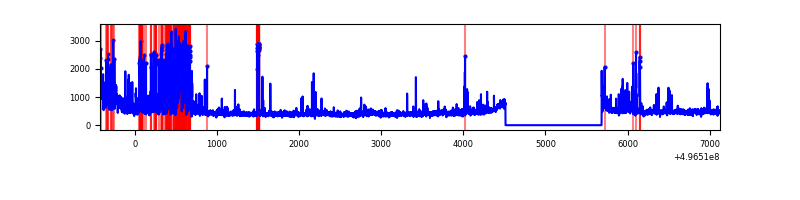 |
| D | 7546 | 6377 | 393 | 393 | 5.21% | 6.16% | 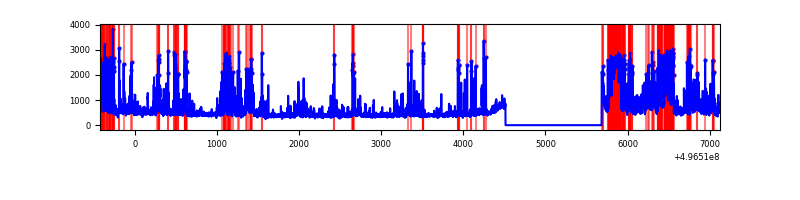 |
Top three noisy pixels from each quadrant. If the there are fewer than three noisy pixels in the level2.evt file, extra rows are filled as -1
| Pixel properties | Quadrant properties | ||||||
|---|---|---|---|---|---|---|---|
| Quadrant | DetID | PixID | Counts | Sigma | Mean | Median | Sigma |
| A | 15 | 174 | 275690 | 1589.81 | 692 | 673 | 173.0 |
| A | 0 | 8 | 89801 | 515.23 | 692 | 673 | 173.0 |
| A | 4 | 3 | 59325 | 339.05 | 692 | 673 | 173.0 |
| B | 15 | 20 | 2242455 | 15570.0 | 678 | 656 | 144.0 |
| B | 5 | 236 | 412835 | 2862.71 | 678 | 656 | 144.0 |
| B | 7 | 252 | 222651 | 1541.82 | 678 | 656 | 144.0 |
| C | 15 | 157 | 487338 | 2647.97 | 669 | 661 | 183.8 |
| C | 13 | 3 | 359121 | 1950.35 | 669 | 661 | 183.8 |
| C | 9 | 53 | 100239 | 541.8 | 669 | 661 | 183.8 |
| D | 3 | 12 | 610507 | 3297.84 | 657 | 627 | 184.9 |
| D | 8 | 176 | 446216 | 2409.46 | 657 | 627 | 184.9 |
| D | 14 | 52 | 431145 | 2327.97 | 657 | 627 | 184.9 |
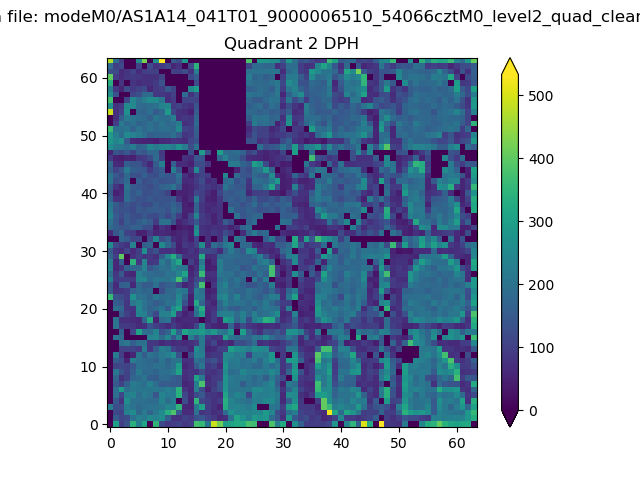
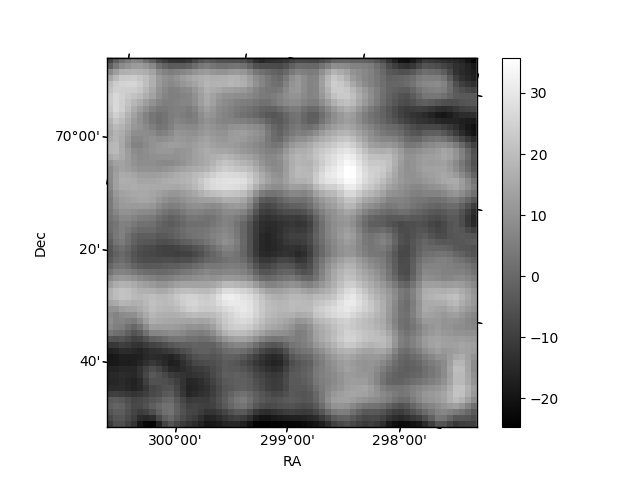
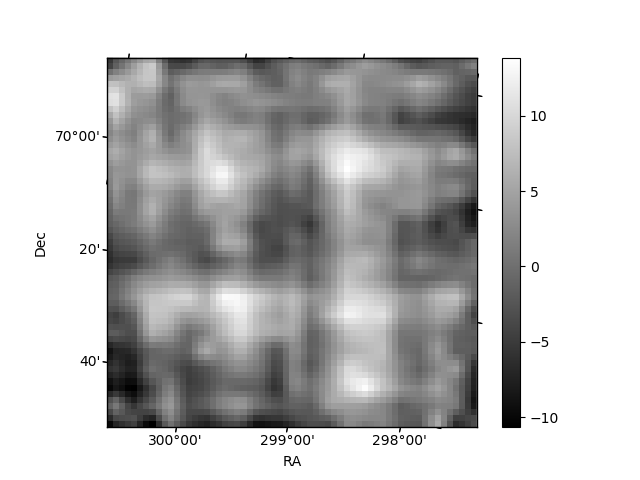
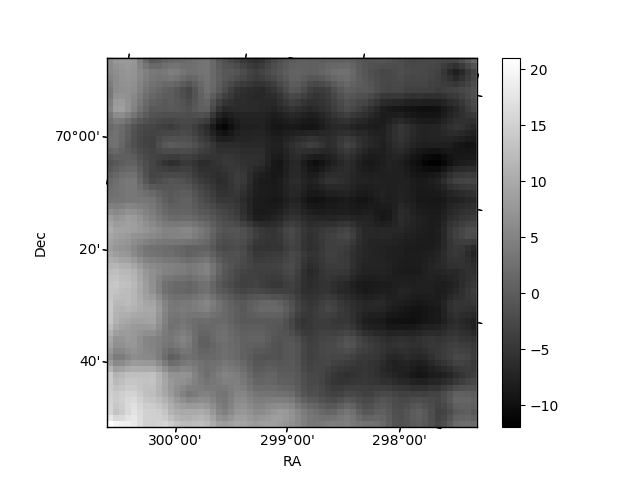
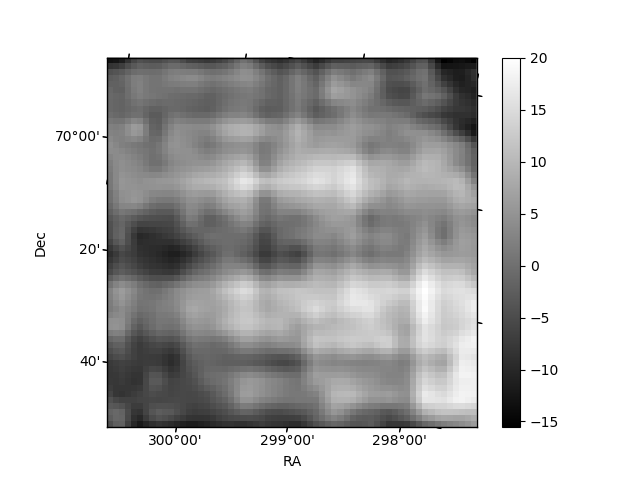
Histogram calculated using DETX and DETY for each event in the final _common_clean file
| Quadrant A | 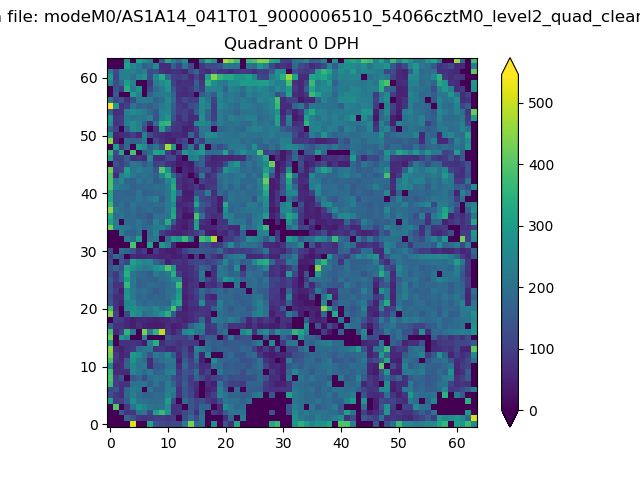 |
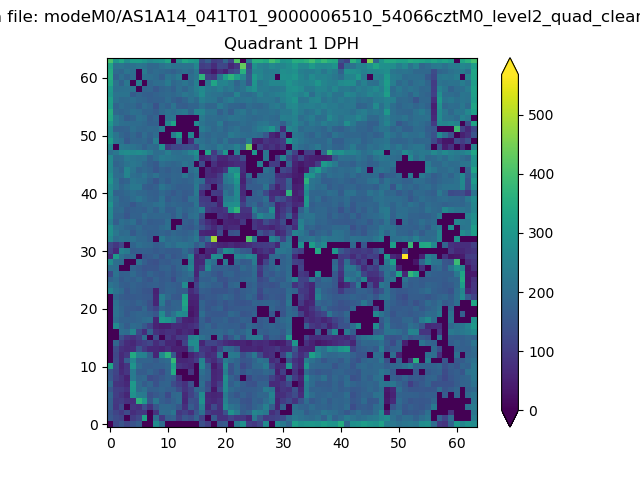 |
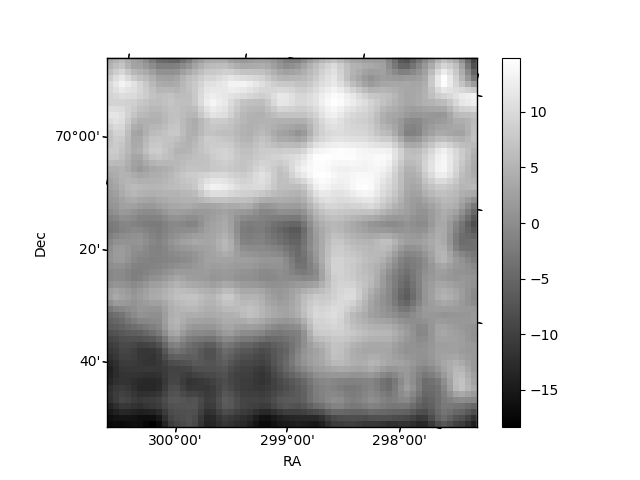
Quadrant B |
|---|---|---|---|
| Quadrant D | 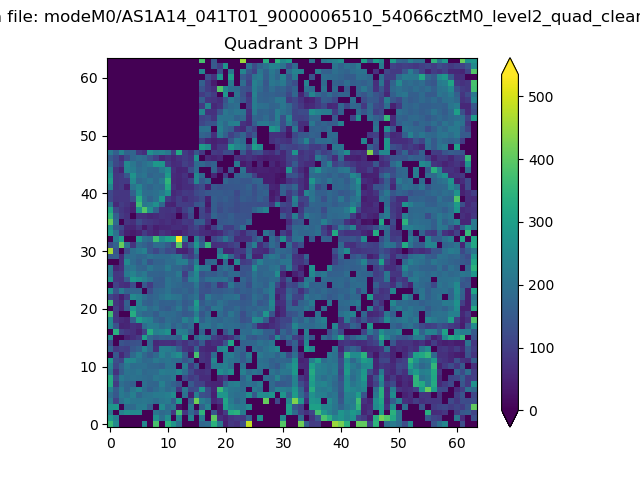 |
 |
Quadrant C |
| Plot type | Count rate plots | Images |
|---|---|---|
| Comparison with Poisson distribution Blue bars denote a histogram of data divided into 1 sec bins. Red curve is a Poisson curve with rate = median count rate of data. |
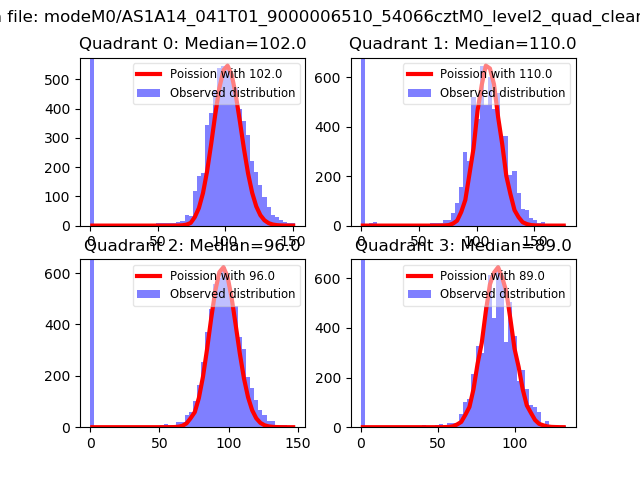 |
 |
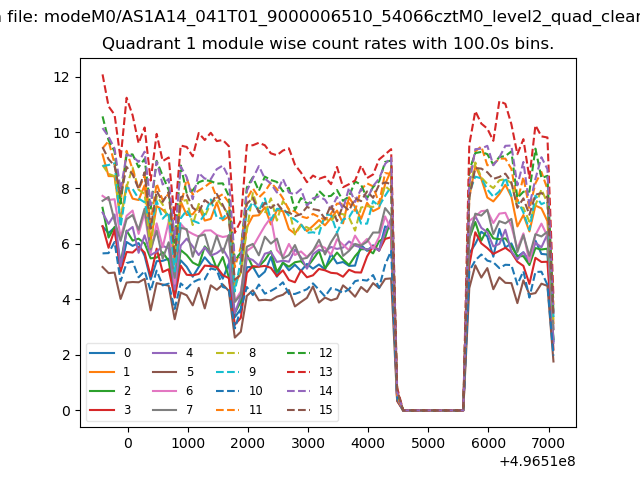
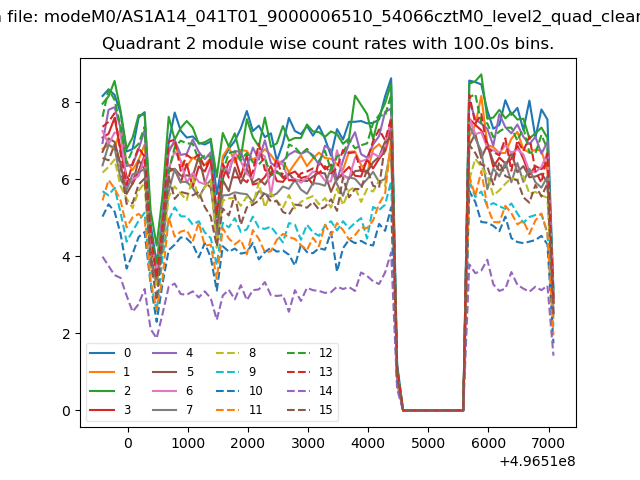
| Quadrant-wise count rates Data is divided into 100 sec bins |
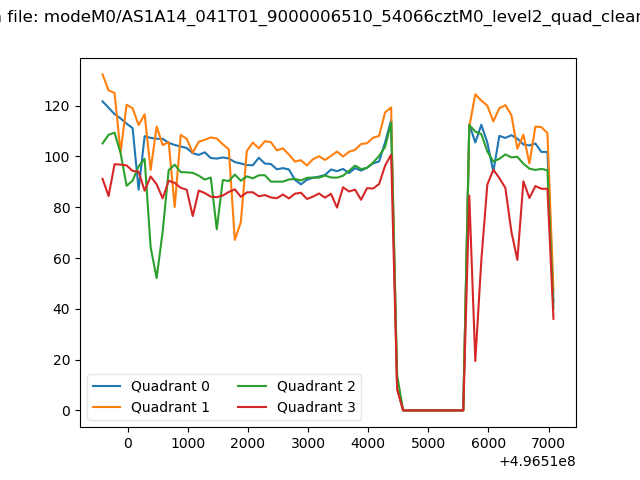 |
|
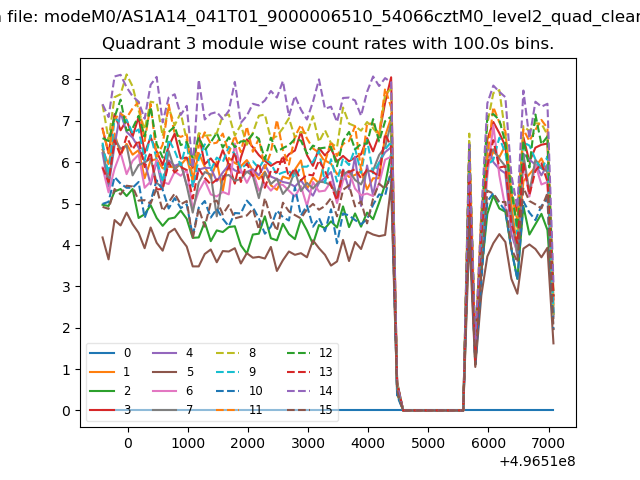
| Module-wise count rates for Quadrant A Data is divided into 100 sec bins |
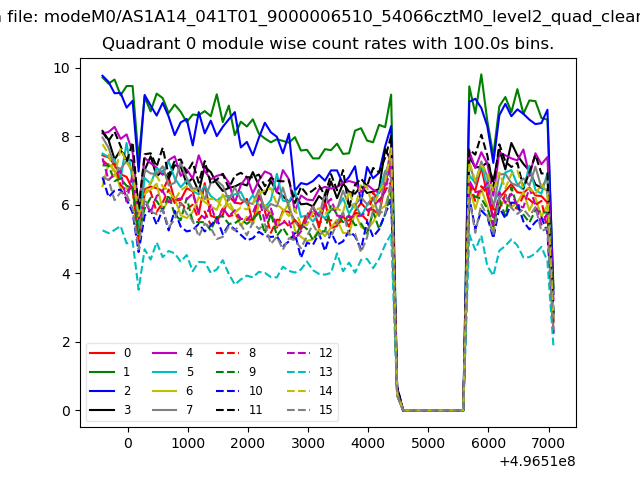 |
 |
| Module-wise count rates for Quadrant B Data is divided into 100 sec bins |
 |
 |
| Module-wise count rates for Quadrant C Data is divided into 100 sec bins |
 |
 |
| Module-wise count rates for Quadrant D Data is divided into 100 sec bins |
 |
 |
| Parameter | Plot |
|---|---|
| CZT HV Monitor | 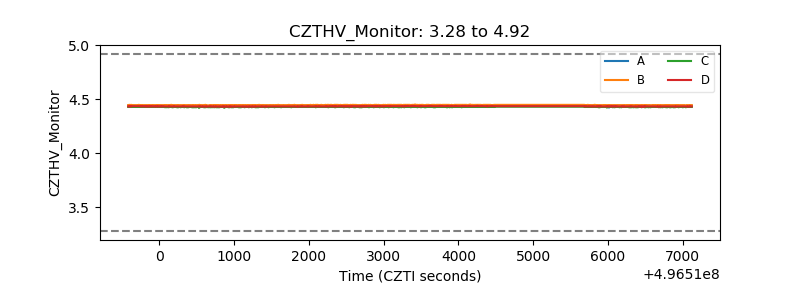 |
| D_VDD | 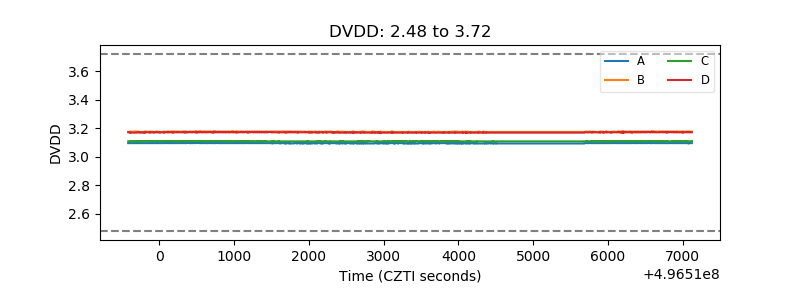 |
| Temperature 1 | 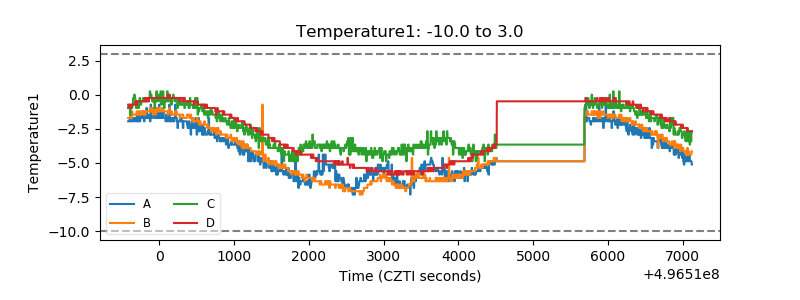 |
| Veto HV Monitor | 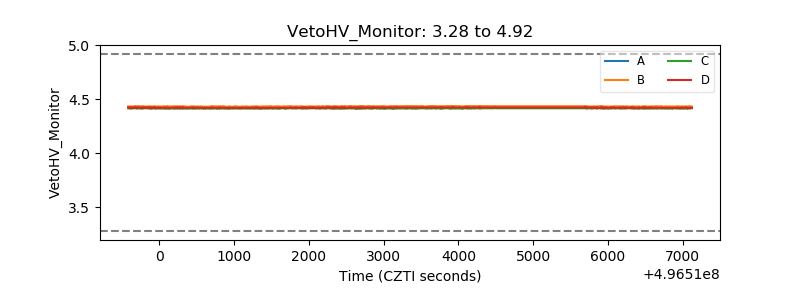 |
| Veto LLD | 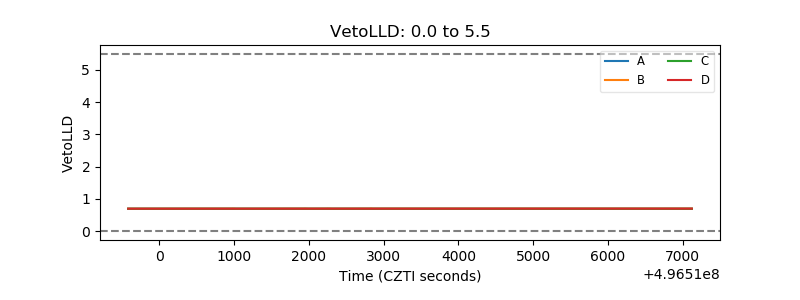 |
| Alpha Counter | 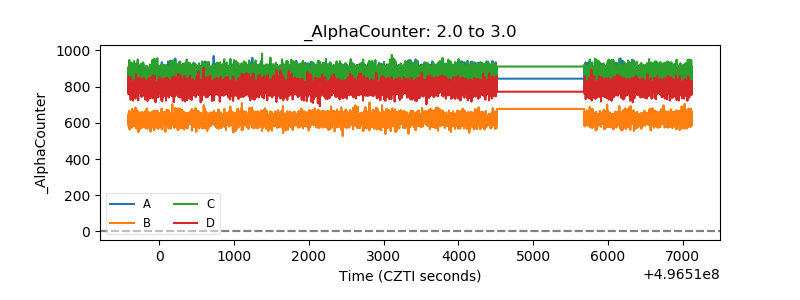 |
| _CPM_Rate | 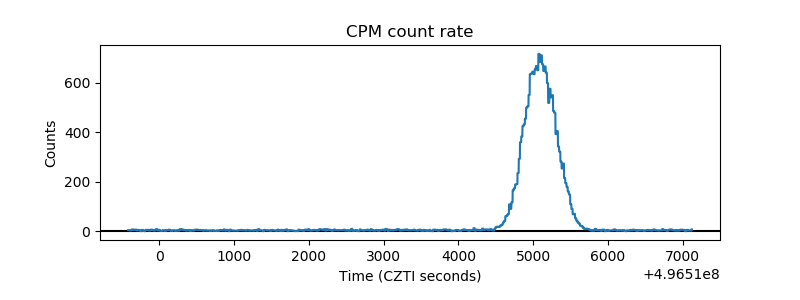 |
| CZT Counter | 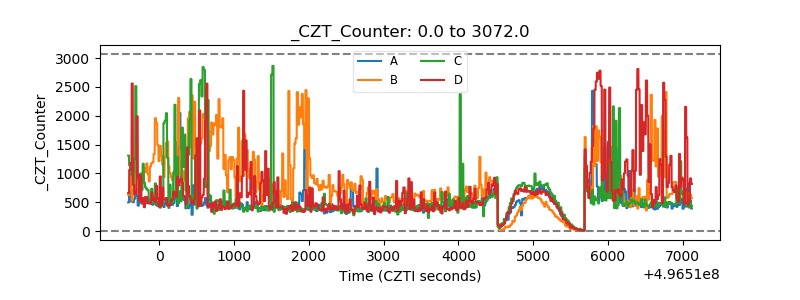 |
| +2.5 Volts monitor |  |
| +5 Volts monitor |  |
| _ROLL_ROT | 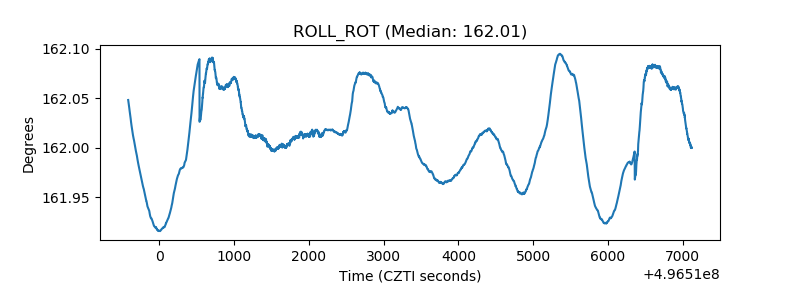 |
| _Roll_DEC | 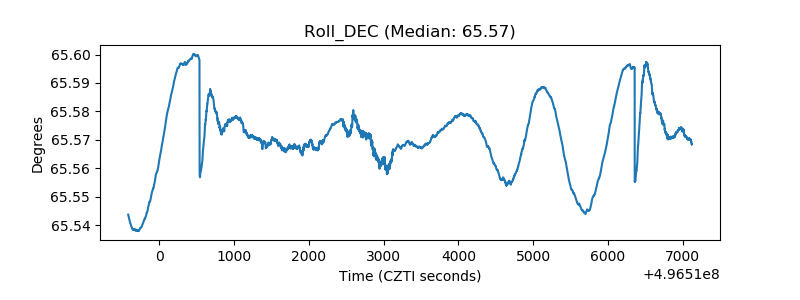 |
| _Roll_RA | 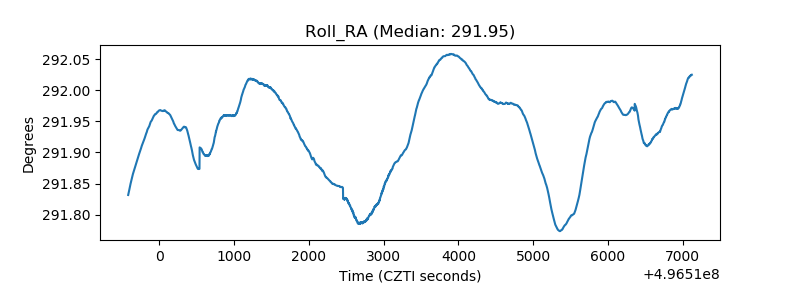 |
| Veto Counter | 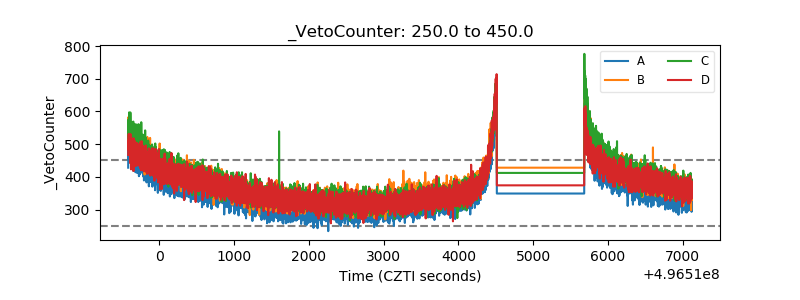 |