| Param | Original file | Final file |
|---|---|---|
| Filename | modeM0/AS1A14_041T01_9000006510_54068cztM0_level2.fits | modeM0/AS1A14_041T01_9000006510_54068cztM0_level2_quad_clean.evt |
| Size (bytes) | 569,473,920 | 93,450,240 |
| Size | 543.1 MB | 89.1 MB |
| Events in quadrant A | 3,674,539 | 639,800 |
| Events in quadrant B | 4,674,909 | 686,932 |
| Events in quadrant C | 6,469,030 | 532,388 |
| Events in quadrant D | 5,743,738 | 504,967 |
| Mode M9 | |||
|---|---|---|---|
| Quadrant | BADHDUFLAG | Total packets | Discarded packets |
| A | 0 | 9 | 0 |
| B | 0 | 9 | 0 |
| C | 0 | 9 | 0 |
| D | 0 | 9 | 0 |
| Mode SS | |||
|---|---|---|---|
| Quadrant | BADHDUFLAG | Total packets | Discarded packets |
| A | 0 | 136 | 0 |
| B | 0 | 136 | 0 |
| C | 0 | 136 | 0 |
| D | 0 | 136 | 0 |
| Mode M0 | |||
|---|---|---|---|
| Quadrant | BADHDUFLAG | Total packets | Discarded packets |
| A | 0 | 15778 | 1 |
| B | 0 | 18453 | 1 |
| C | 0 | 23924 | 5 |
| D | 0 | 21835 | 1 |
| Quadrant | Total seconds | Saturated seconds | Saturation percentage |
|---|---|---|---|
| A | 6673 | 138 | 2.068035% |
| B | 6673 | 224 | 3.356811% |
| C | 6672 | 1044 | 15.647482% |
| D | 6673 | 835 | 12.513113% |
Noise dominated data is calculated using 1-second bins in cleaned event files. If a bin has >2000 counts, and if more than 50% of those come from <1% of pixels, then it is considered to be noise-dominated and hence unusable.
| Quadrant | # 1 sec bins | Bins with >0 counts | Bins with >2000 counts | High rate bins dominated by noise | Noise dominated (total time) | Noise dominated (detector-on time) | Marked lightcurve |
|---|---|---|---|---|---|---|---|
| A | 7628 | 6674 | 142 | 142 | 1.86% | 2.13% | 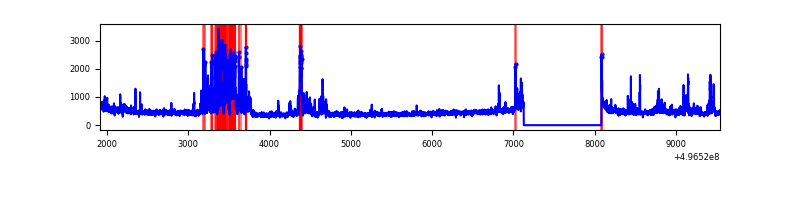 |
| B | 7628 | 6673 | 132 | 132 | 1.73% | 1.98% | 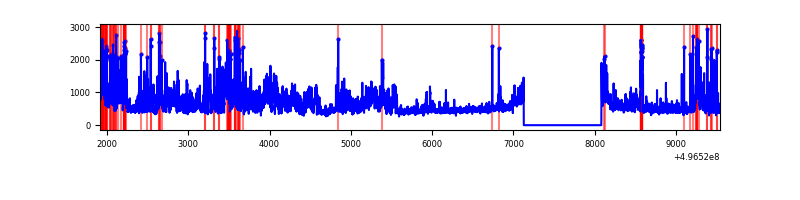 |
| C | 7627 | 6672 | 984 | 984 | 12.90% | 14.75% | 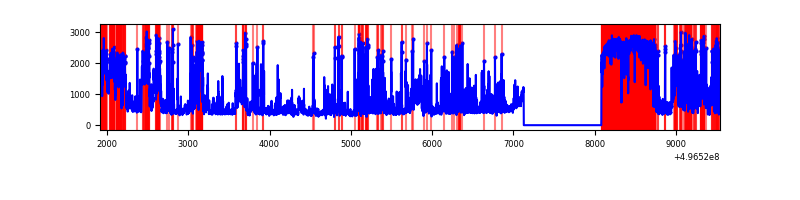 |
| D | 7628 | 6674 | 777 | 777 | 10.19% | 11.64% | 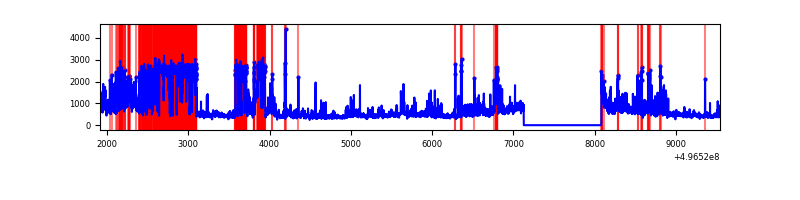 |
Top three noisy pixels from each quadrant. If the there are fewer than three noisy pixels in the level2.evt file, extra rows are filled as -1
| Pixel properties | Quadrant properties | ||||||
|---|---|---|---|---|---|---|---|
| Quadrant | DetID | PixID | Counts | Sigma | Mean | Median | Sigma |
| A | 15 | 174 | 505387 | 2921.7 | 695 | 677 | 172.7 |
| A | 12 | 115 | 259030 | 1495.57 | 695 | 677 | 172.7 |
| A | 4 | 3 | 61090 | 349.72 | 695 | 677 | 172.7 |
| B | 15 | 20 | 1155294 | 7879.61 | 693 | 667 | 146.5 |
| B | 5 | 236 | 379858 | 2587.74 | 693 | 667 | 146.5 |
| B | 7 | 252 | 129995 | 882.58 | 693 | 667 | 146.5 |
| C | 15 | 233 | 2030207 | 11670.32 | 626 | 619 | 173.9 |
| C | 9 | 53 | 747349 | 4293.77 | 626 | 619 | 173.9 |
| C | 4 | 5 | 427653 | 2455.48 | 626 | 619 | 173.9 |
| D | 2 | 172 | 1938155 | 10679.8 | 636 | 607 | 181.4 |
| D | 8 | 176 | 409476 | 2253.69 | 636 | 607 | 181.4 |
| D | 7 | 70 | 289175 | 1590.59 | 636 | 607 | 181.4 |
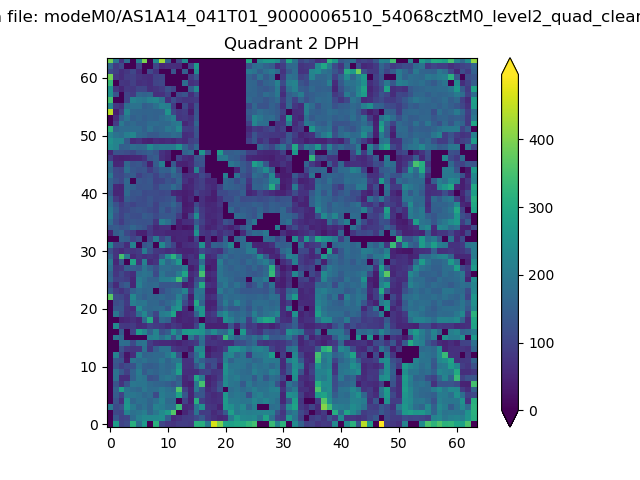
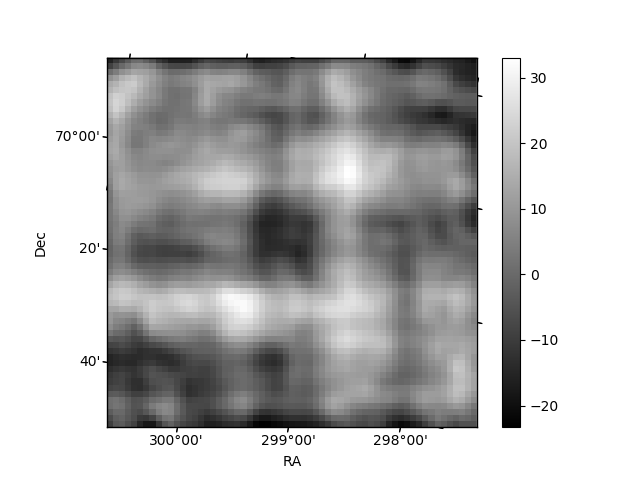
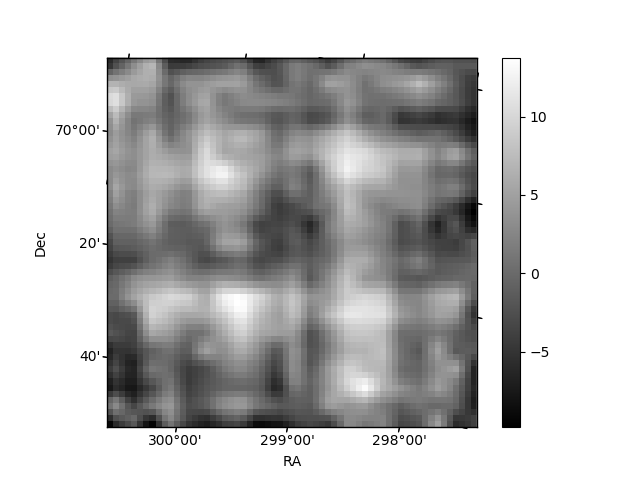
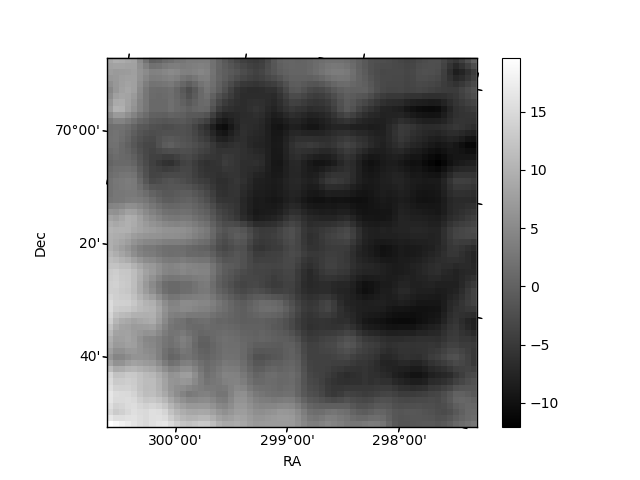
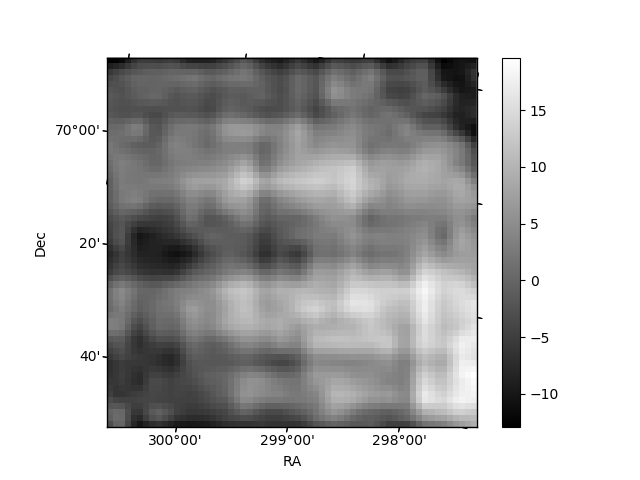
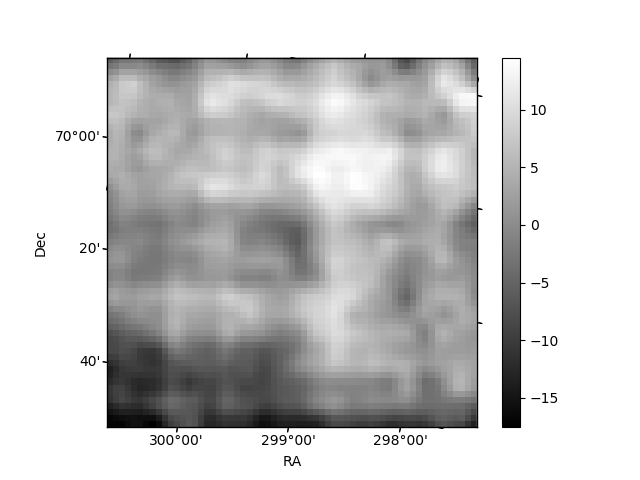
Histogram calculated using DETX and DETY for each event in the final _common_clean file
| Quadrant A | 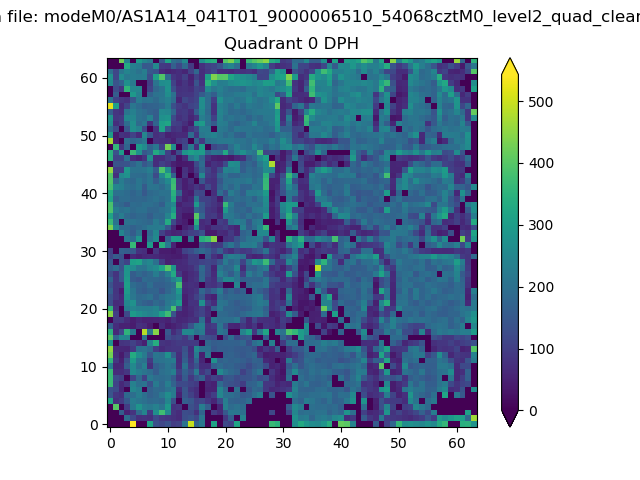 |
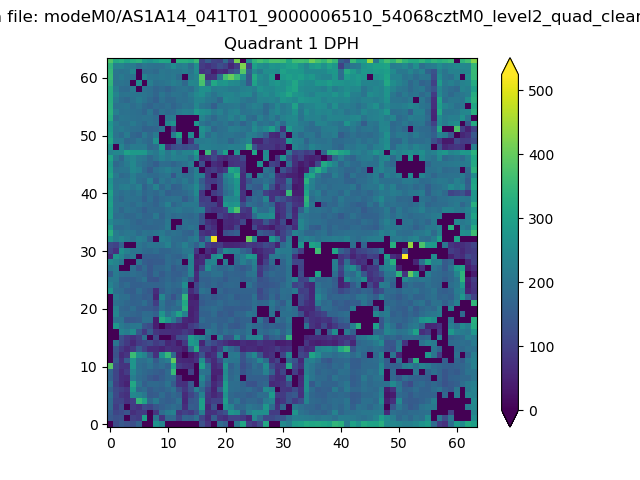 |
Quadrant B |
|---|---|---|---|
| Quadrant D | 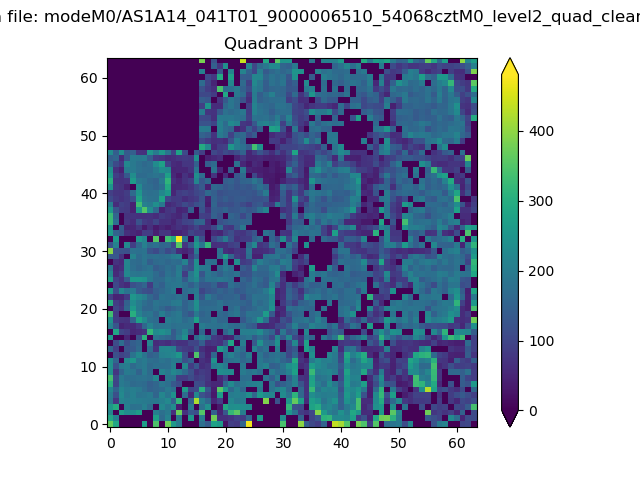 |
 |
Quadrant C |
| Plot type | Count rate plots | Images |
|---|---|---|
| Comparison with Poisson distribution Blue bars denote a histogram of data divided into 1 sec bins. Red curve is a Poisson curve with rate = median count rate of data. |
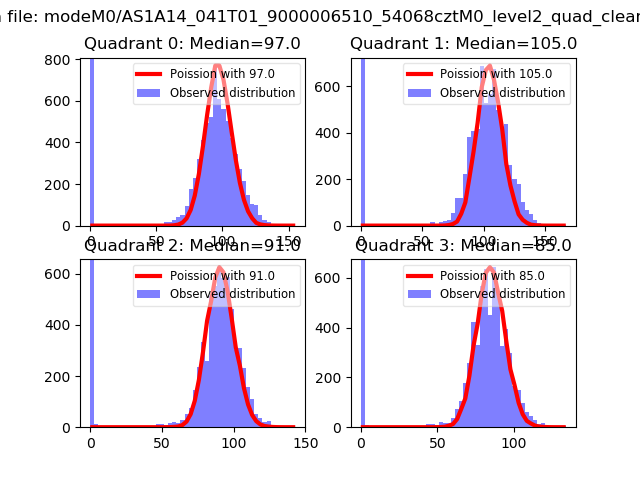 |
 |
| Quadrant-wise count rates Data is divided into 100 sec bins |
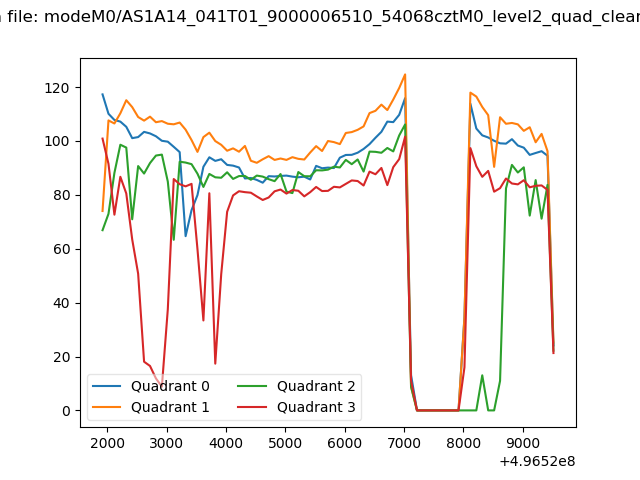 |
|
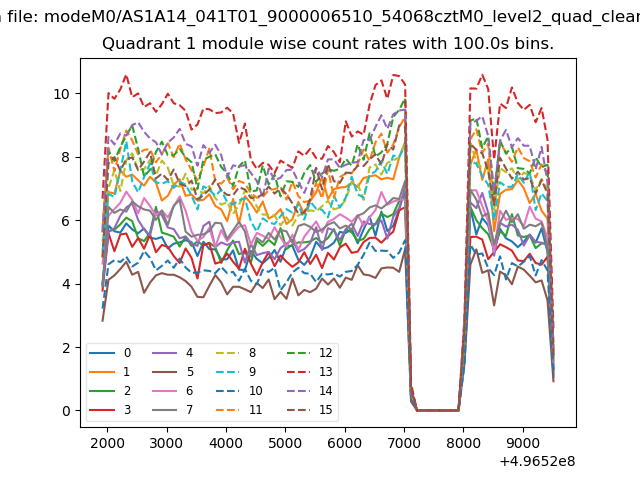
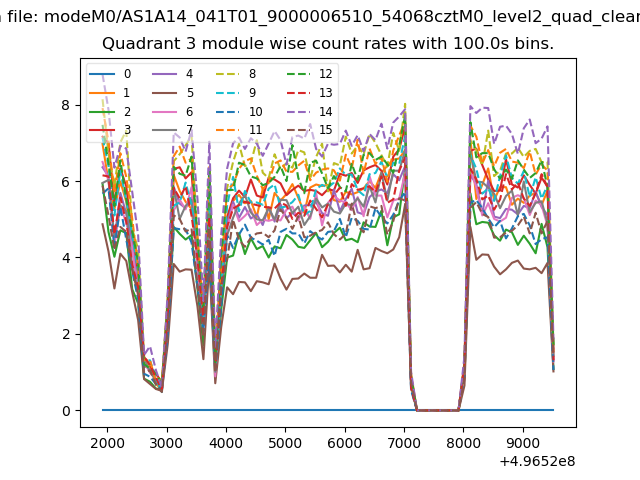
| Module-wise count rates for Quadrant A Data is divided into 100 sec bins |
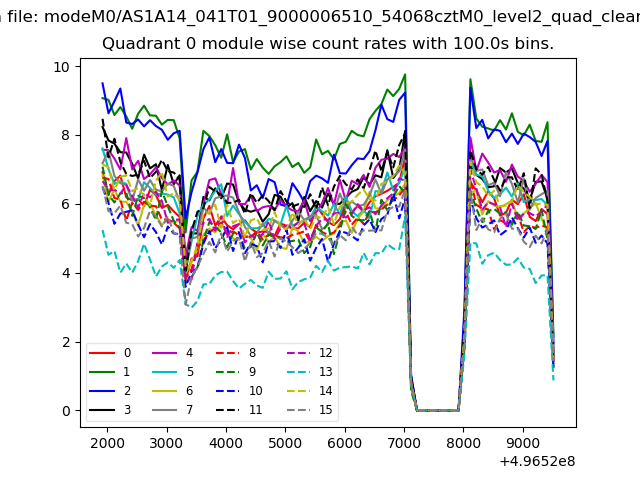 |
 |
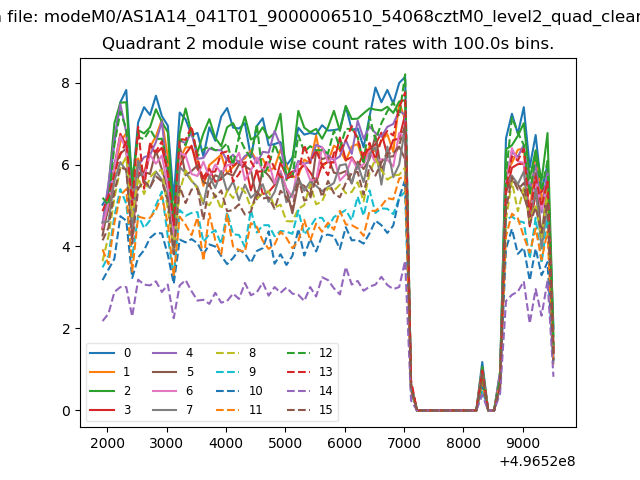
| Module-wise count rates for Quadrant B Data is divided into 100 sec bins |
 |
 |
| Module-wise count rates for Quadrant C Data is divided into 100 sec bins |
 |
 |
| Module-wise count rates for Quadrant D Data is divided into 100 sec bins |
 |
 |
| Parameter | Plot |
|---|---|
| CZT HV Monitor | 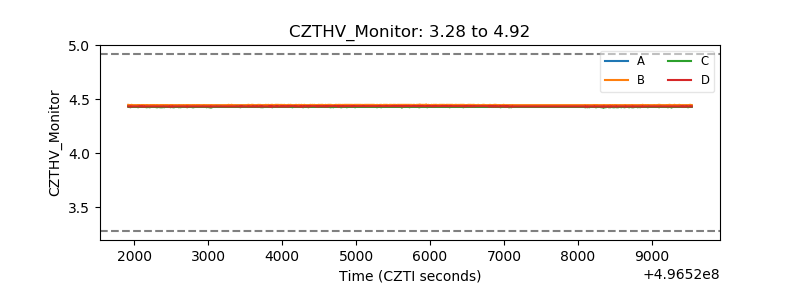 |
| D_VDD | 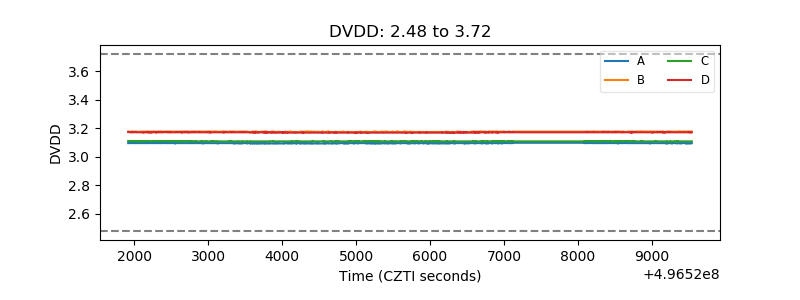 |
| Temperature 1 | 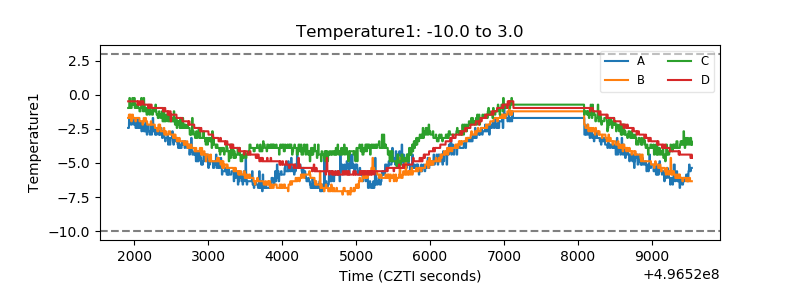 |
| Veto HV Monitor | 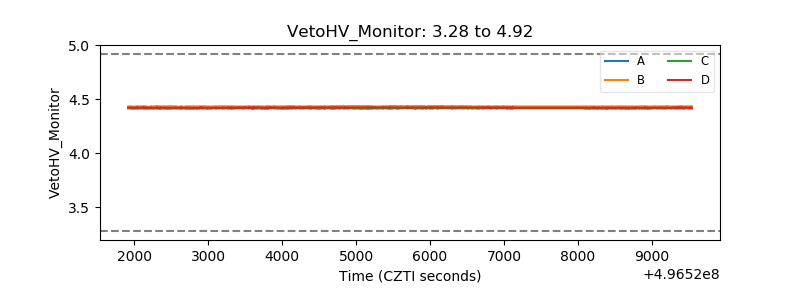 |
| Veto LLD | 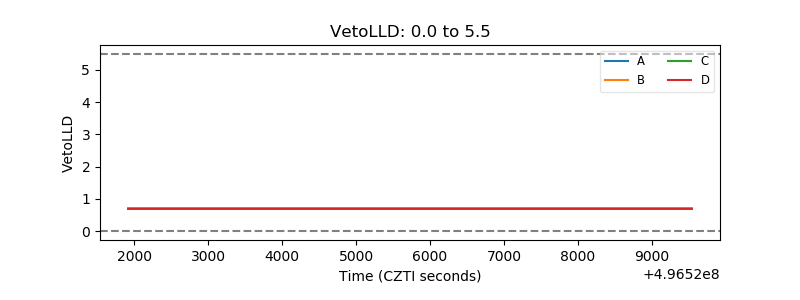 |
| Alpha Counter | 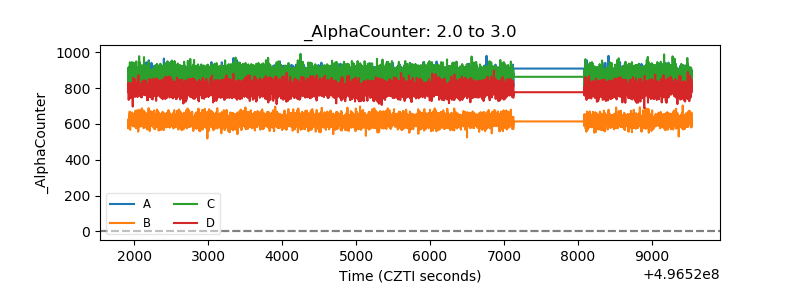 |
| _CPM_Rate | 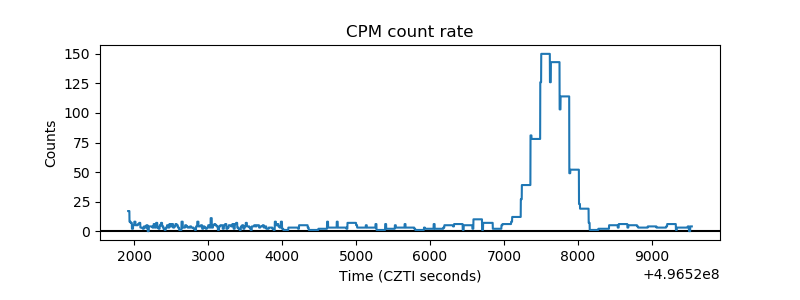 |
| CZT Counter | 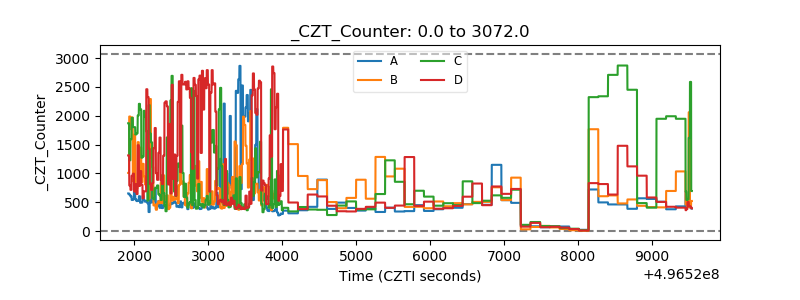 |
| +2.5 Volts monitor |  |
| +5 Volts monitor |  |
| _ROLL_ROT | 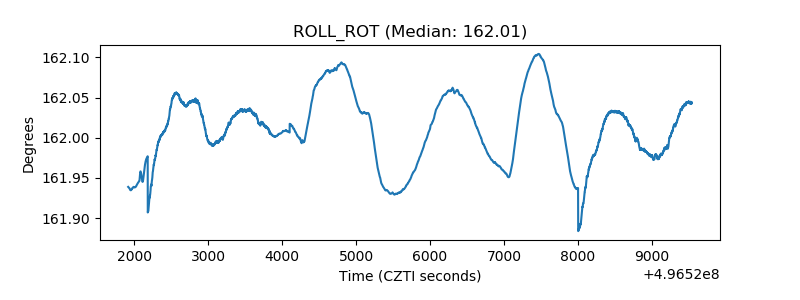 |
| _Roll_DEC | 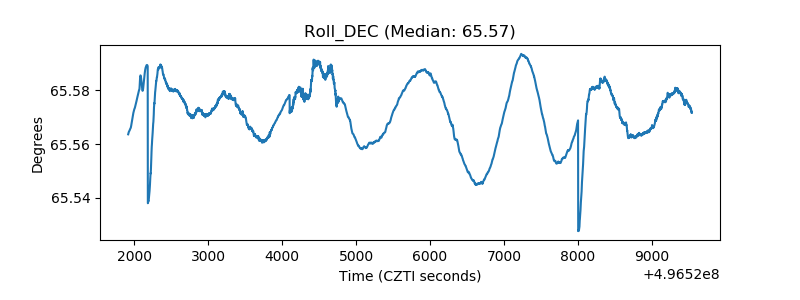 |
| _Roll_RA | 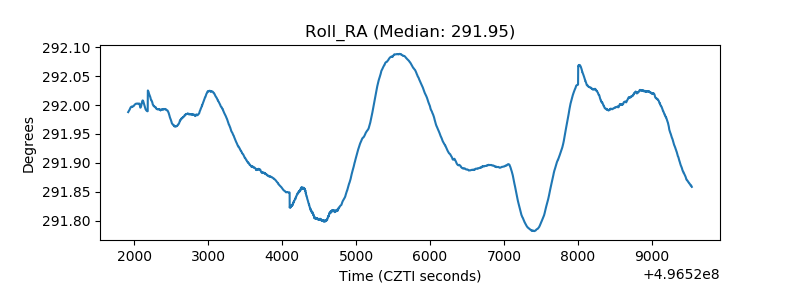 |
| Veto Counter | 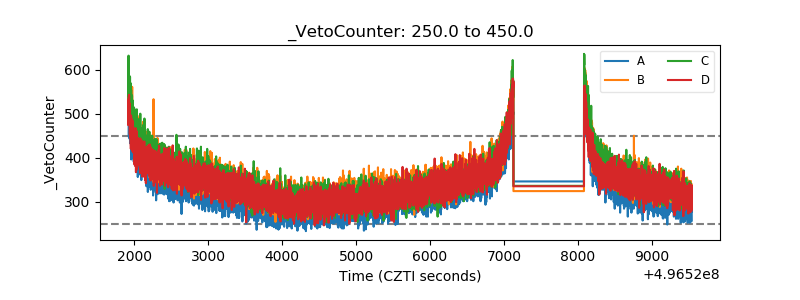 |