| Param | Original file | Final file |
|---|---|---|
| Filename | modeM0/AS1A14_041T01_9000006510_54069cztM0_level2.fits | modeM0/AS1A14_041T01_9000006510_54069cztM0_level2_quad_clean.evt |
| Size (bytes) | 537,059,520 | 101,226,240 |
| Size | 512.2 MB | 96.5 MB |
| Events in quadrant A | 3,723,044 | 682,503 |
| Events in quadrant B | 4,090,909 | 735,627 |
| Events in quadrant C | 6,435,944 | 567,983 |
| Events in quadrant D | 5,071,260 | 577,358 |
| Mode M9 | |||
|---|---|---|---|
| Quadrant | BADHDUFLAG | Total packets | Discarded packets |
| A | 0 | 6 | 0 |
| B | 0 | 7 | 0 |
| C | 0 | 7 | 0 |
| D | 0 | 7 | 0 |
| Mode SS | |||
|---|---|---|---|
| Quadrant | BADHDUFLAG | Total packets | Discarded packets |
| A | 0 | 148 | 0 |
| B | 0 | 148 | 0 |
| C | 0 | 148 | 0 |
| D | 0 | 148 | 0 |
| Mode M0 | |||
|---|---|---|---|
| Quadrant | BADHDUFLAG | Total packets | Discarded packets |
| A | 0 | 16455 | 3 |
| B | 0 | 17385 | 3 |
| C | 0 | 24240 | 3 |
| D | 0 | 20370 | 3 |
| Quadrant | Total seconds | Saturated seconds | Saturation percentage |
|---|---|---|---|
| A | 7194 | 114 | 1.584654% |
| B | 7194 | 222 | 3.085905% |
| C | 7193 | 1029 | 14.305575% |
| D | 7193 | 481 | 6.687057% |
Noise dominated data is calculated using 1-second bins in cleaned event files. If a bin has >2000 counts, and if more than 50% of those come from <1% of pixels, then it is considered to be noise-dominated and hence unusable.
| Quadrant | # 1 sec bins | Bins with >0 counts | Bins with >2000 counts | High rate bins dominated by noise | Noise dominated (total time) | Noise dominated (detector-on time) | Marked lightcurve |
|---|---|---|---|---|---|---|---|
| A | 7684 | 7195 | 68 | 68 | 0.88% | 0.95% | 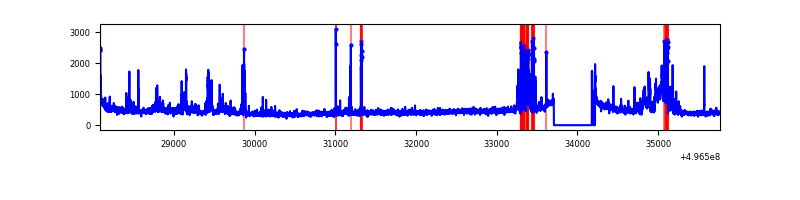 |
| B | 7684 | 7194 | 103 | 103 | 1.34% | 1.43% | 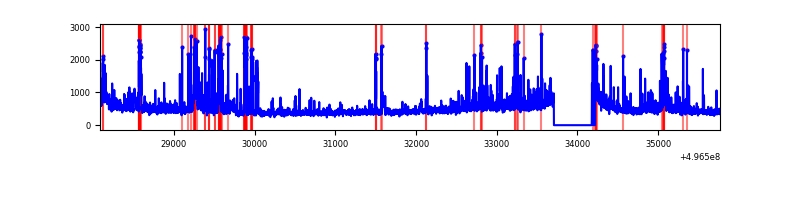 |
| C | 7683 | 7194 | 971 | 971 | 12.64% | 13.50% | 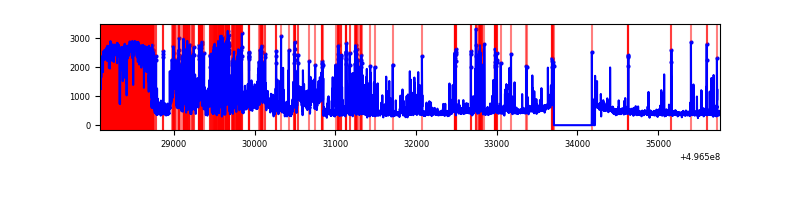 |
| D | 7683 | 7195 | 439 | 439 | 5.71% | 6.10% | 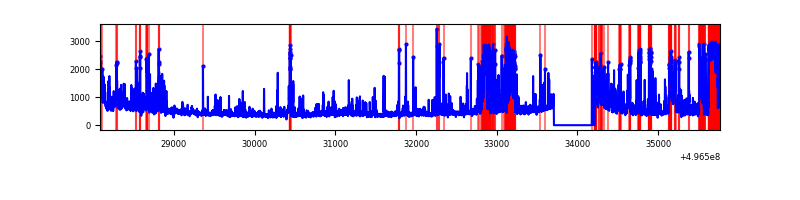 |
Top three noisy pixels from each quadrant. If the there are fewer than three noisy pixels in the level2.evt file, extra rows are filled as -1
| Pixel properties | Quadrant properties | ||||||
|---|---|---|---|---|---|---|---|
| Quadrant | DetID | PixID | Counts | Sigma | Mean | Median | Sigma |
| A | 15 | 174 | 309105 | 1649.49 | 753 | 735 | 186.9 |
| A | 12 | 115 | 214262 | 1142.17 | 753 | 735 | 186.9 |
| A | 4 | 3 | 67478 | 357.01 | 753 | 735 | 186.9 |
| B | 5 | 236 | 426401 | 2649.83 | 754 | 728 | 160.6 |
| B | 7 | 252 | 198531 | 1231.33 | 754 | 728 | 160.6 |
| B | 15 | 20 | 149261 | 924.62 | 754 | 728 | 160.6 |
| C | 15 | 233 | 2508624 | 13394.15 | 678 | 672 | 187.2 |
| C | 4 | 5 | 846703 | 4518.37 | 678 | 672 | 187.2 |
| C | 13 | 3 | 177038 | 941.91 | 678 | 672 | 187.2 |
| D | 8 | 176 | 929698 | 4580.9 | 716 | 683 | 202.8 |
| D | 2 | 172 | 353069 | 1737.59 | 716 | 683 | 202.8 |
| D | 14 | 20 | 324542 | 1596.92 | 716 | 683 | 202.8 |
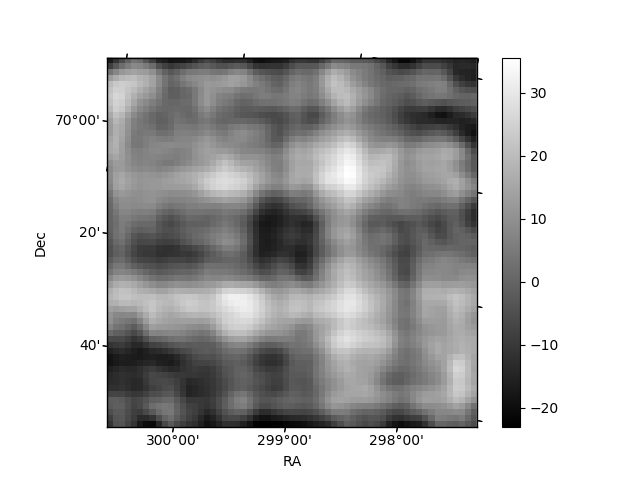
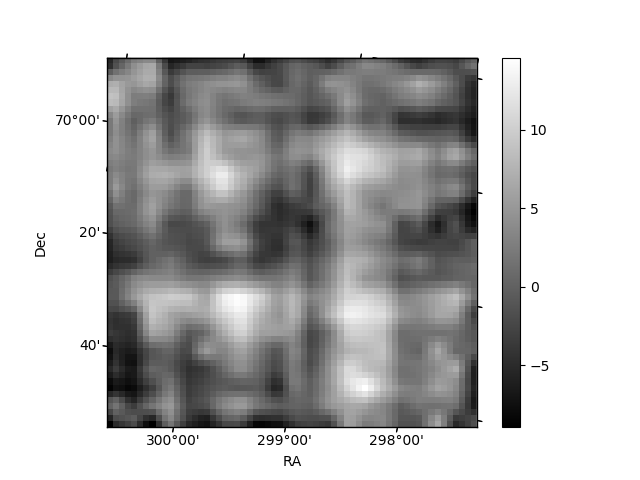
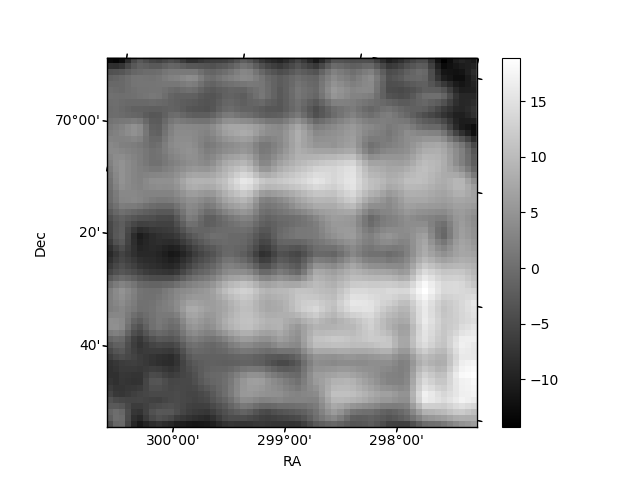
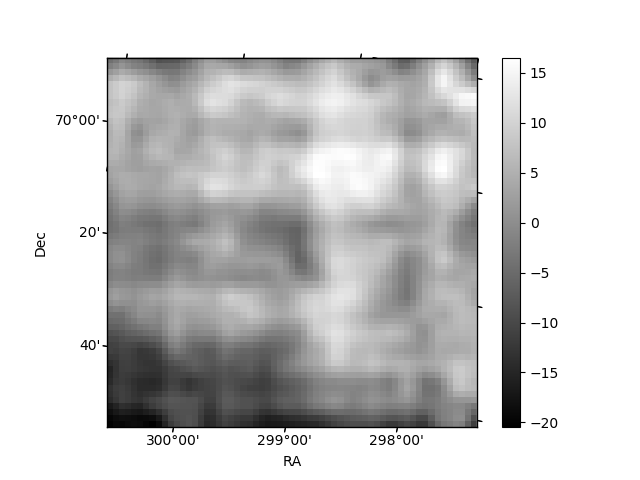
Histogram calculated using DETX and DETY for each event in the final _common_clean file
| Quadrant A | 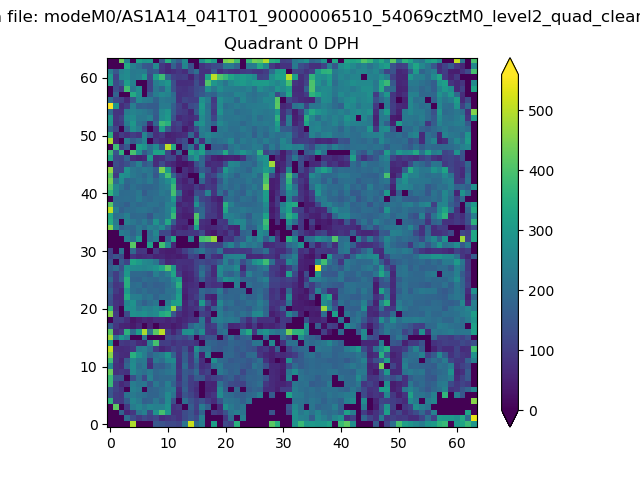 |
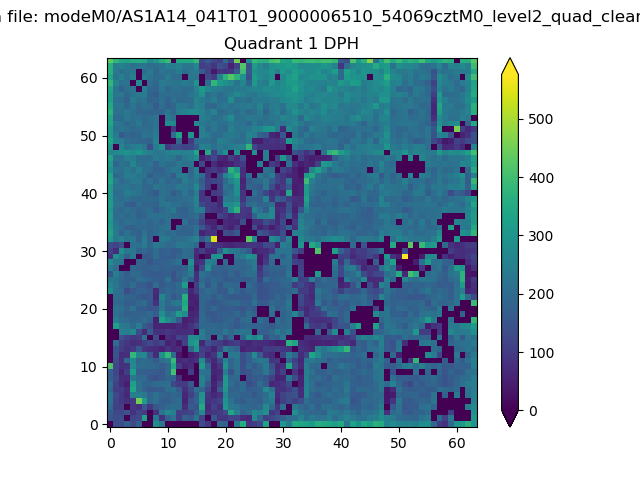 |
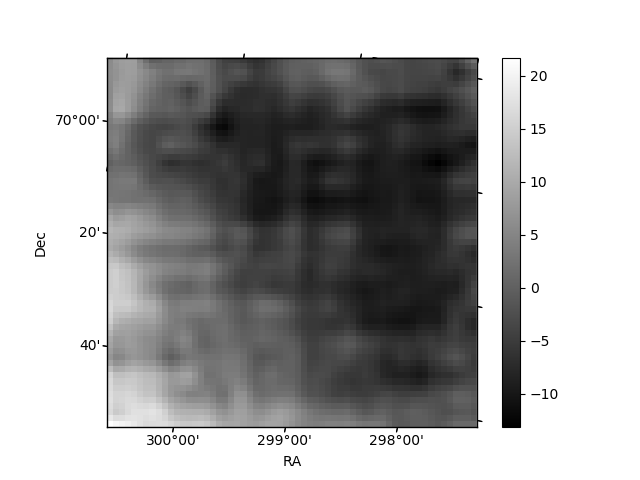
Quadrant B |
|---|---|---|---|
| Quadrant D | 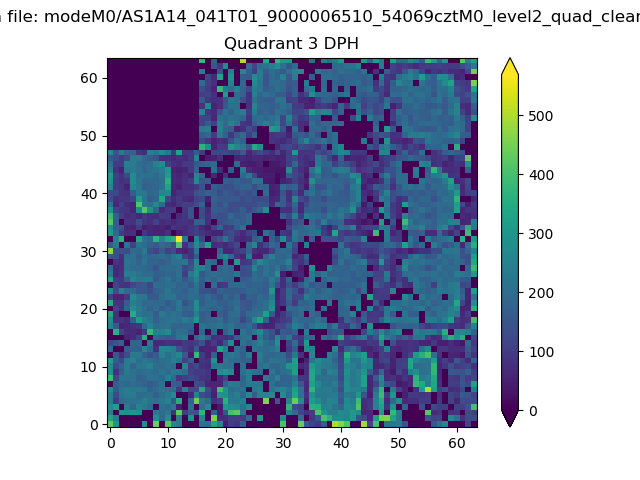 |
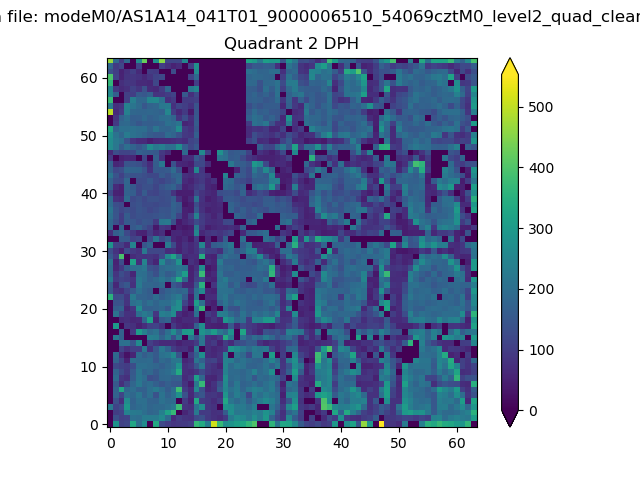 |
Quadrant C |
| Plot type | Count rate plots | Images |
|---|---|---|
| Comparison with Poisson distribution Blue bars denote a histogram of data divided into 1 sec bins. Red curve is a Poisson curve with rate = median count rate of data. |
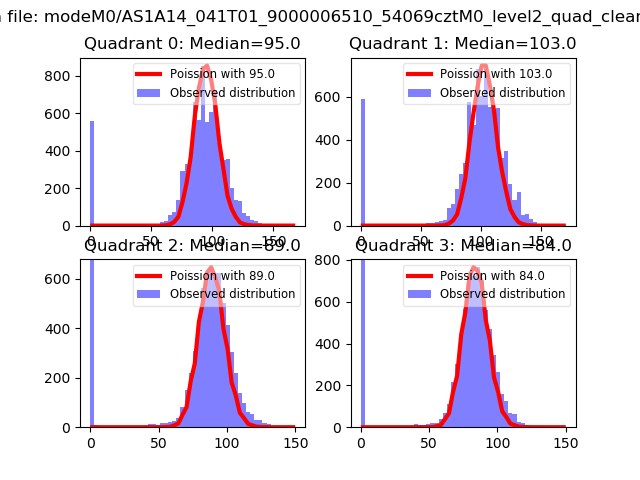 |
 |
| Quadrant-wise count rates Data is divided into 100 sec bins |
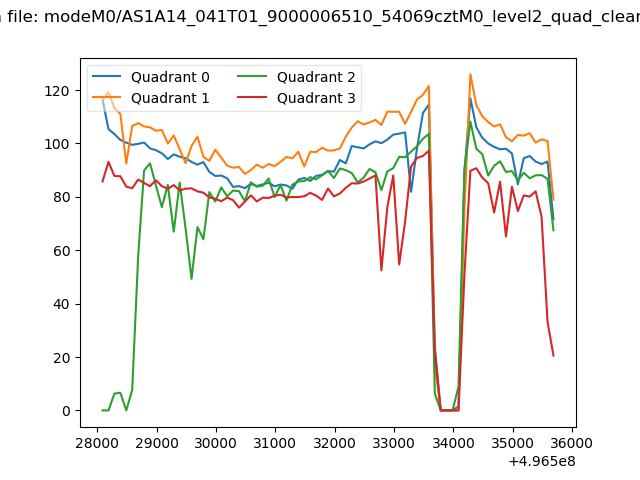 |
|
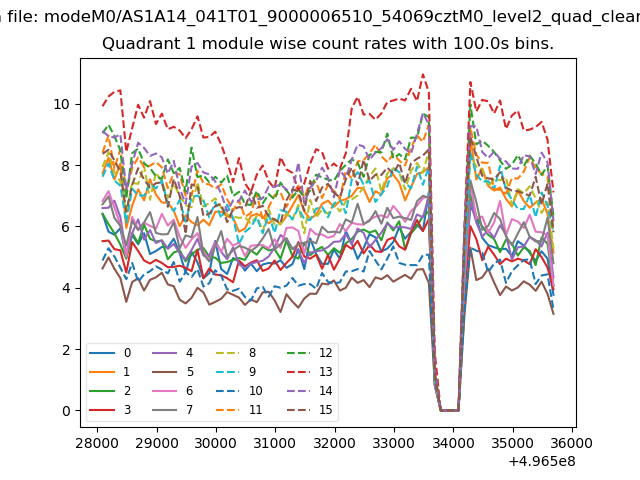
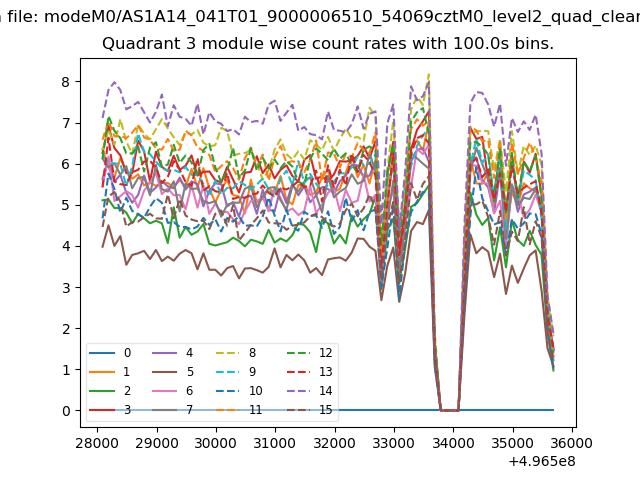
| Module-wise count rates for Quadrant A Data is divided into 100 sec bins |
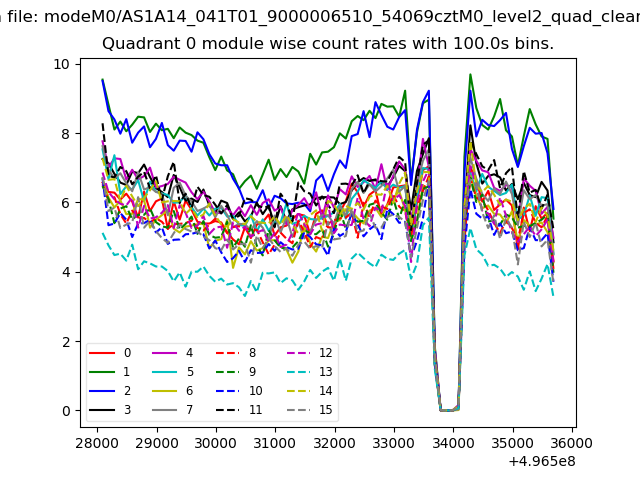 |
 |
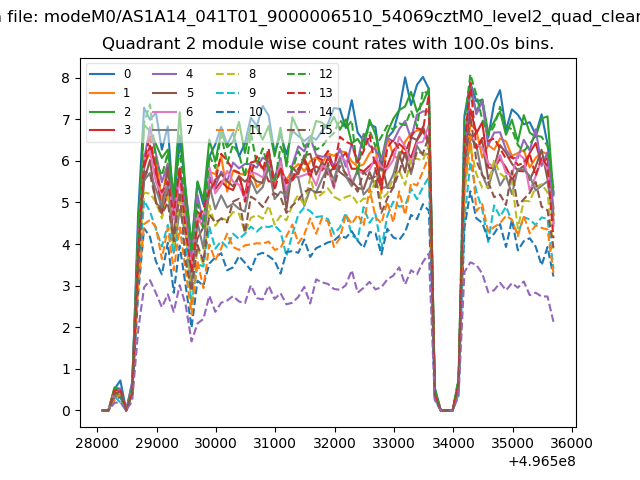
| Module-wise count rates for Quadrant B Data is divided into 100 sec bins |
 |
 |
| Module-wise count rates for Quadrant C Data is divided into 100 sec bins |
 |
 |
| Module-wise count rates for Quadrant D Data is divided into 100 sec bins |
 |
 |
| Parameter | Plot |
|---|---|
| CZT HV Monitor | 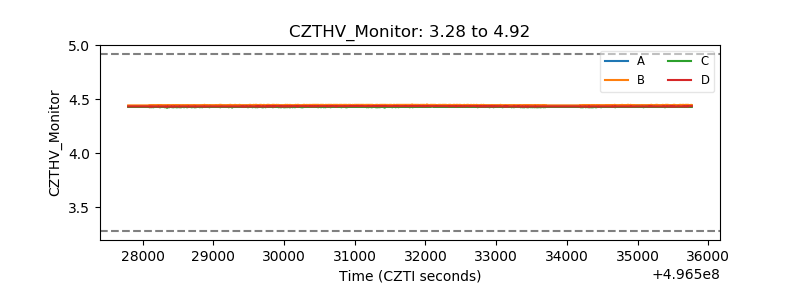 |
| D_VDD | 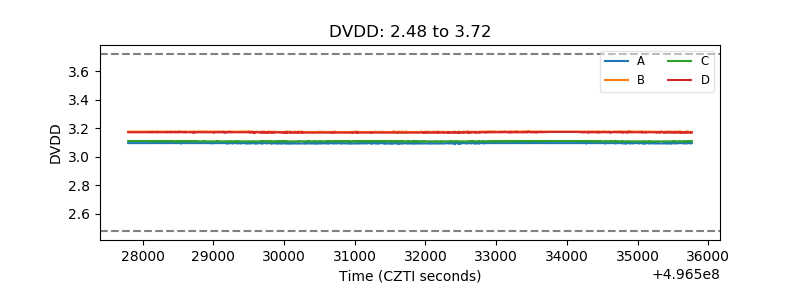 |
| Temperature 1 | 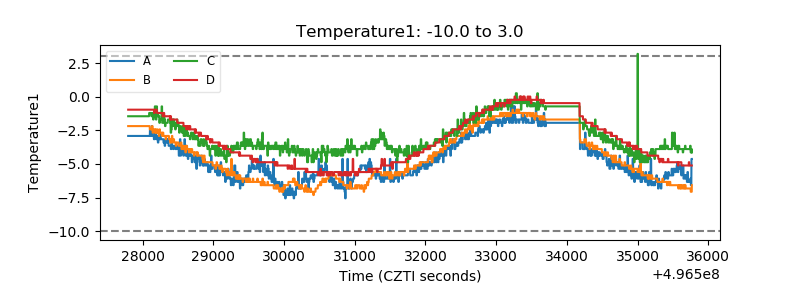 |
| Veto HV Monitor | 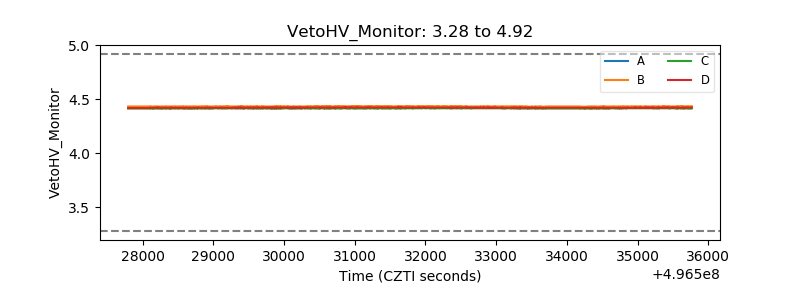 |
| Veto LLD | 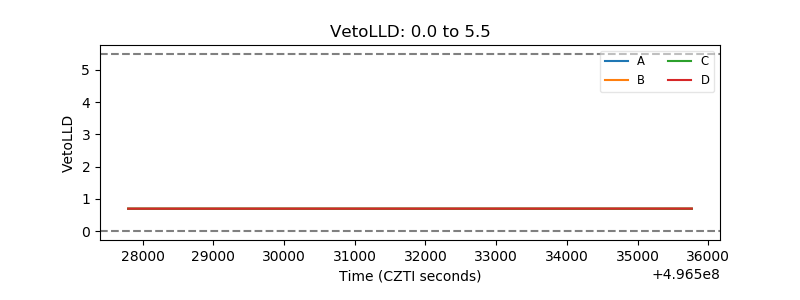 |
| Alpha Counter | 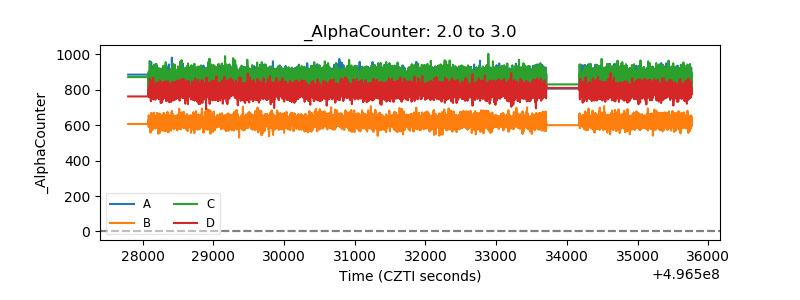 |
| _CPM_Rate | 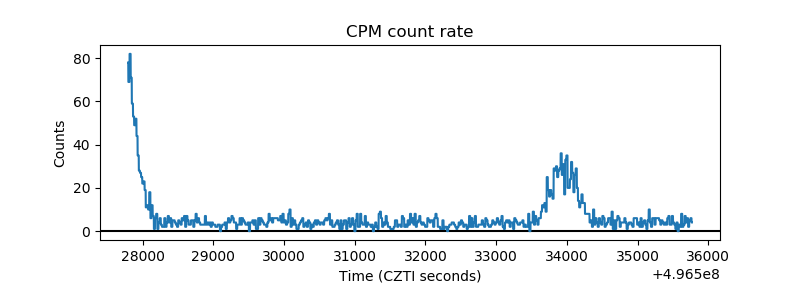 |
| CZT Counter | 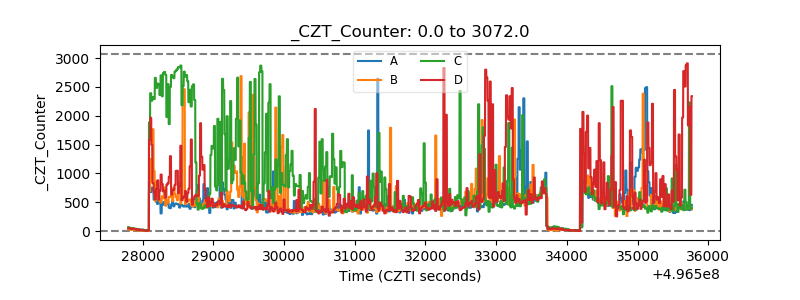 |
| +2.5 Volts monitor |  |
| +5 Volts monitor |  |
| _ROLL_ROT | 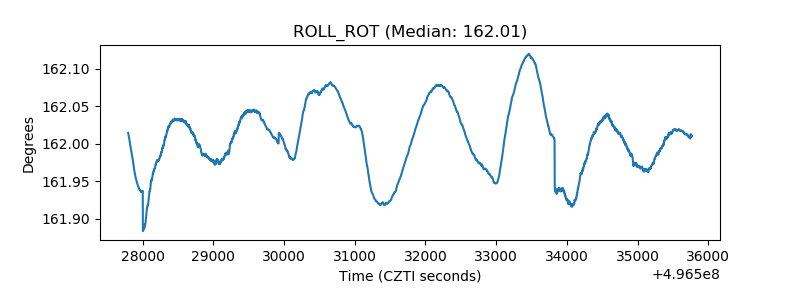 |
| _Roll_DEC | 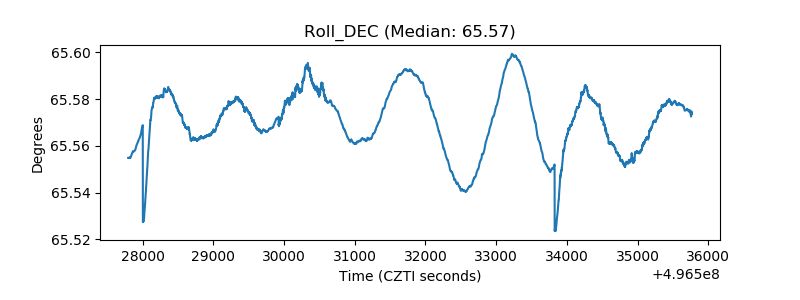 |
| _Roll_RA | 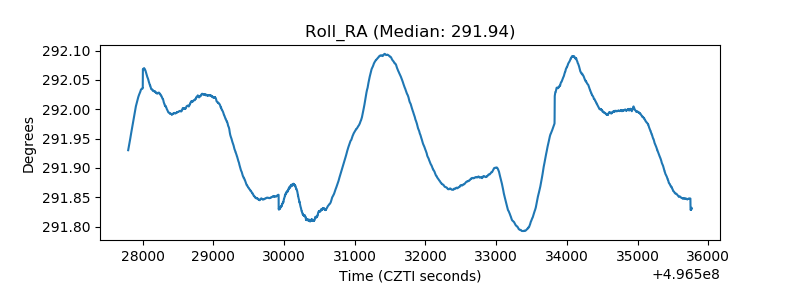 |
| Veto Counter | 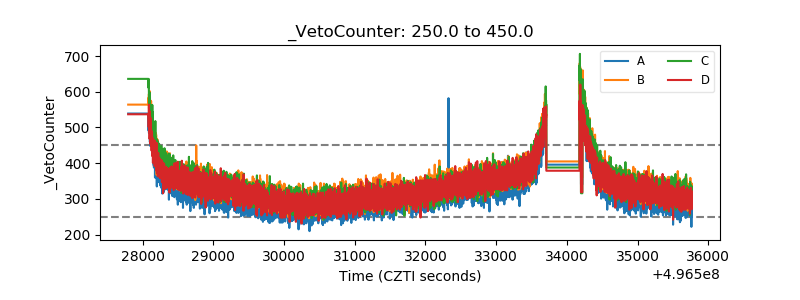 |