| Param | Original file | Final file |
|---|---|---|
| Filename | modeM0/AS1A14_041T01_9000006510_54070cztM0_level2.fits | modeM0/AS1A14_041T01_9000006510_54070cztM0_level2_quad_clean.evt |
| Size (bytes) | 546,500,160 | 113,535,360 |
| Size | 521.2 MB | 108.3 MB |
| Events in quadrant A | 4,119,256 | 751,491 |
| Events in quadrant B | 4,406,643 | 810,741 |
| Events in quadrant C | 4,088,970 | 717,055 |
| Events in quadrant D | 6,994,642 | 602,913 |
| Mode M9 | |||
|---|---|---|---|
| Quadrant | BADHDUFLAG | Total packets | Discarded packets |
| A | 0 | 4 | 0 |
| B | 0 | 4 | 0 |
| C | 0 | 4 | 0 |
| D | 0 | 4 | 0 |
| Mode SS | |||
|---|---|---|---|
| Quadrant | BADHDUFLAG | Total packets | Discarded packets |
| A | 0 | 164 | 0 |
| B | 0 | 164 | 0 |
| C | 0 | 164 | 0 |
| D | 0 | 164 | 0 |
| Mode M0 | |||
|---|---|---|---|
| Quadrant | BADHDUFLAG | Total packets | Discarded packets |
| A | 0 | 18325 | 3 |
| B | 0 | 19076 | 2 |
| C | 0 | 18199 | 2 |
| D | 0 | 26644 | 2 |
| Quadrant | Total seconds | Saturated seconds | Saturation percentage |
|---|---|---|---|
| A | 7981 | 119 | 1.491041% |
| B | 7981 | 231 | 2.894374% |
| C | 7982 | 146 | 1.829116% |
| D | 7982 | 902 | 11.300426% |
Noise dominated data is calculated using 1-second bins in cleaned event files. If a bin has >2000 counts, and if more than 50% of those come from <1% of pixels, then it is considered to be noise-dominated and hence unusable.
| Quadrant | # 1 sec bins | Bins with >0 counts | Bins with >2000 counts | High rate bins dominated by noise | Noise dominated (total time) | Noise dominated (detector-on time) | Marked lightcurve |
|---|---|---|---|---|---|---|---|
| A | 8471 | 7982 | 76 | 76 | 0.90% | 0.95% | 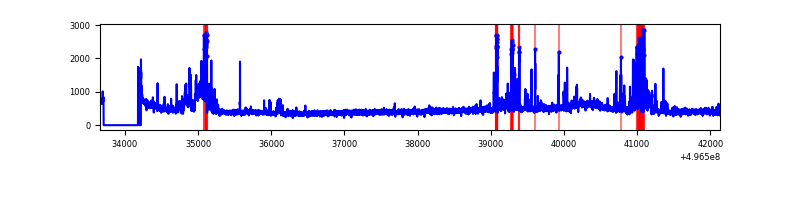 |
| B | 8471 | 7981 | 121 | 121 | 1.43% | 1.52% | 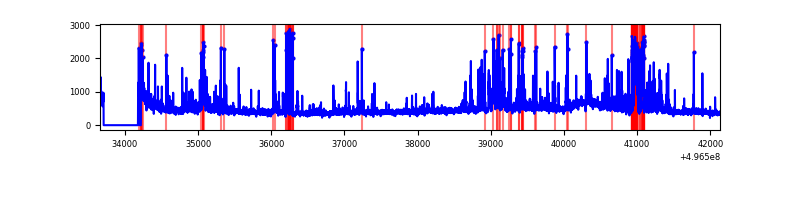 |
| C | 8472 | 7983 | 118 | 118 | 1.39% | 1.48% | 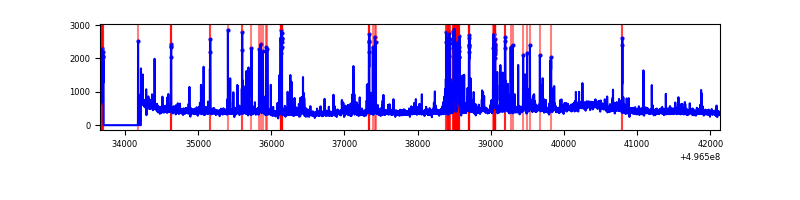 |
| D | 8472 | 7984 | 912 | 912 | 10.76% | 11.42% | 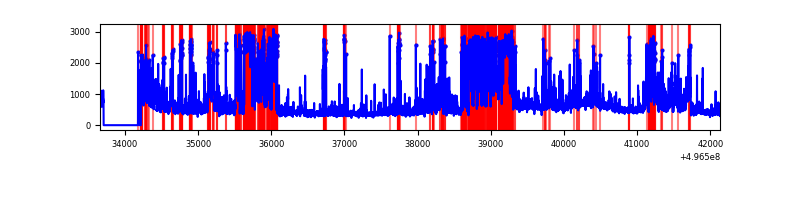 |
Top three noisy pixels from each quadrant. If the there are fewer than three noisy pixels in the level2.evt file, extra rows are filled as -1
| Pixel properties | Quadrant properties | ||||||
|---|---|---|---|---|---|---|---|
| Quadrant | DetID | PixID | Counts | Sigma | Mean | Median | Sigma |
| A | 15 | 174 | 402749 | 1927.64 | 843 | 822 | 208.5 |
| A | 12 | 115 | 158433 | 755.9 | 843 | 822 | 208.5 |
| A | 14 | 235 | 56066 | 264.95 | 843 | 822 | 208.5 |
| B | 5 | 236 | 425333 | 2370.05 | 843 | 811 | 179.1 |
| B | 7 | 252 | 259164 | 1442.35 | 843 | 811 | 179.1 |
| B | 0 | 213 | 94199 | 521.37 | 843 | 811 | 179.1 |
| C | 15 | 233 | 578264 | 2521.21 | 833 | 824 | 229.0 |
| C | 14 | 254 | 58462 | 251.66 | 833 | 824 | 229.0 |
| C | 9 | 53 | 43979 | 188.42 | 833 | 824 | 229.0 |
| D | 8 | 176 | 2220875 | 9977.19 | 781 | 746 | 222.5 |
| D | 2 | 172 | 498853 | 2238.48 | 781 | 746 | 222.5 |
| D | 14 | 20 | 306382 | 1373.52 | 781 | 746 | 222.5 |
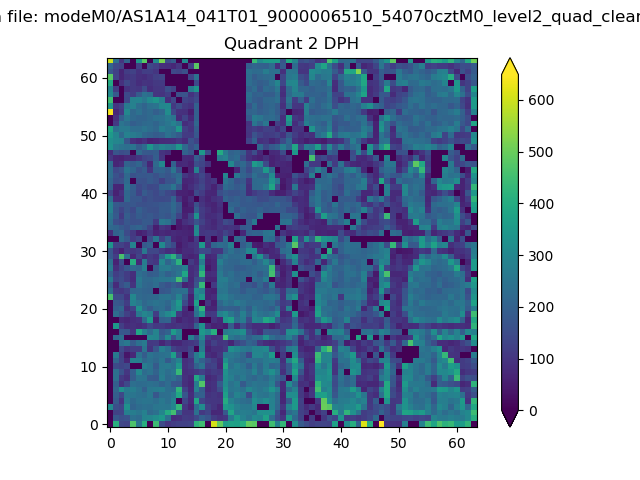
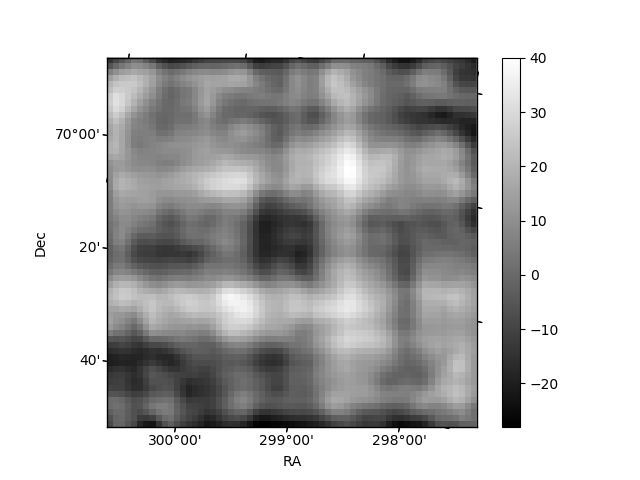
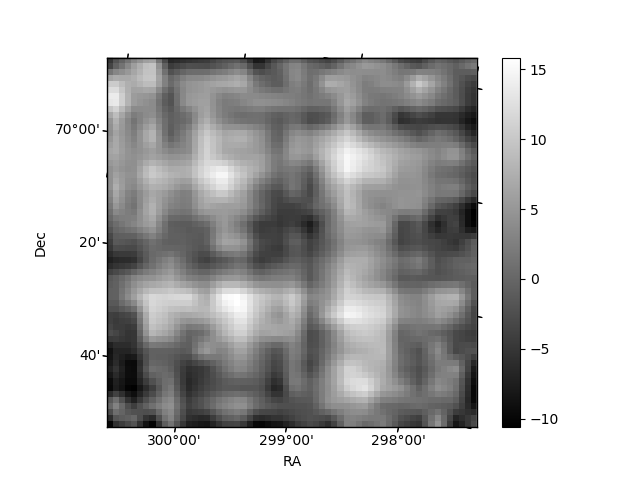
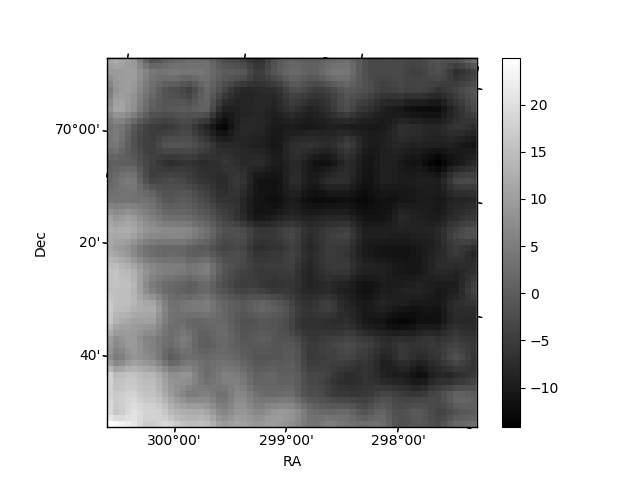
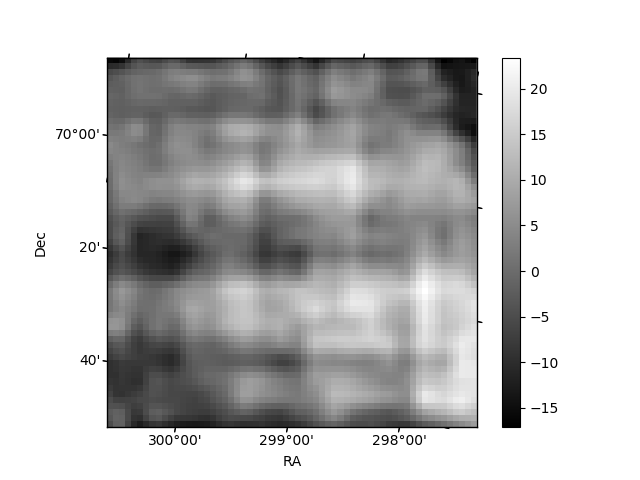
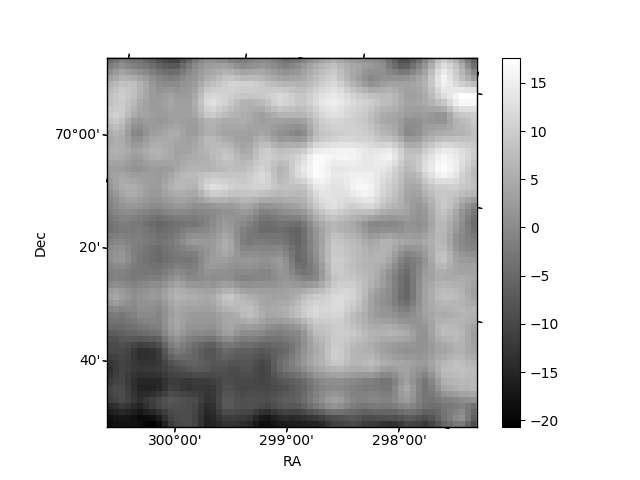
Histogram calculated using DETX and DETY for each event in the final _common_clean file
| Quadrant A | 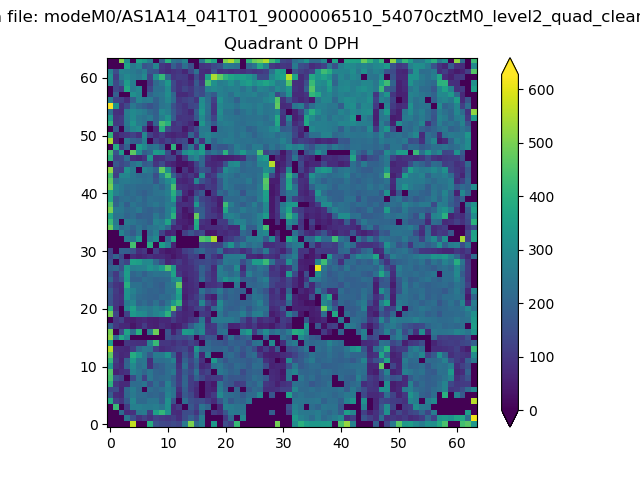 |
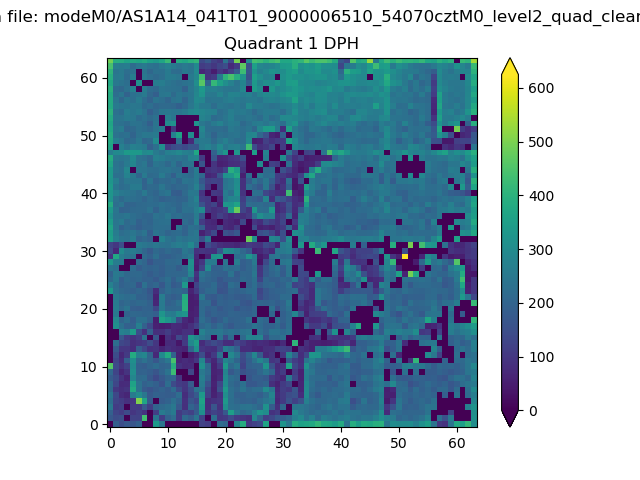 |
Quadrant B |
|---|---|---|---|
| Quadrant D | 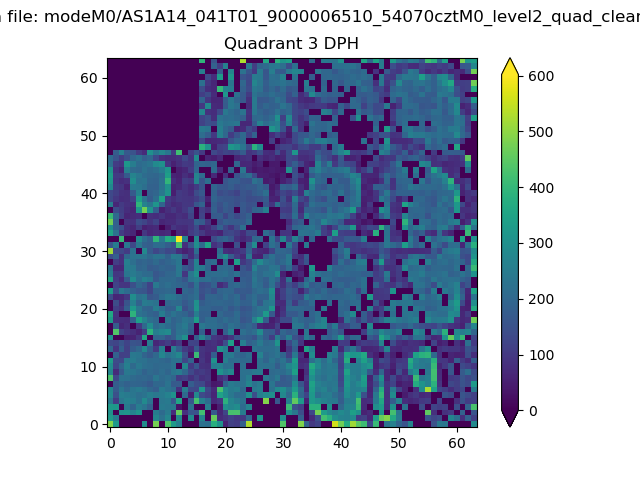 |
 |
Quadrant C |
| Plot type | Count rate plots | Images |
|---|---|---|
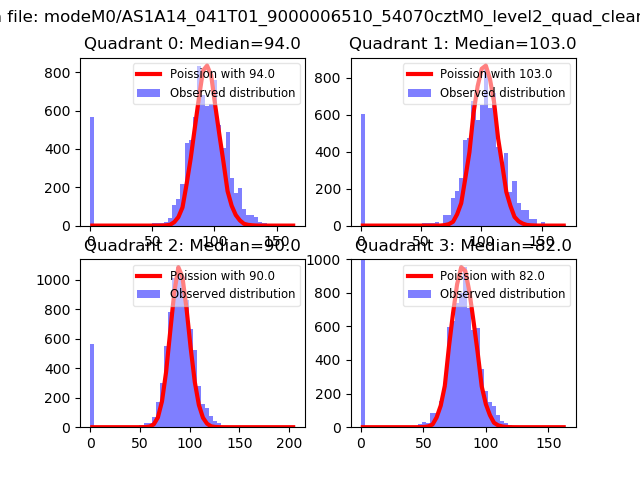
| Comparison with Poisson distribution Blue bars denote a histogram of data divided into 1 sec bins. Red curve is a Poisson curve with rate = median count rate of data. |
 |
 |
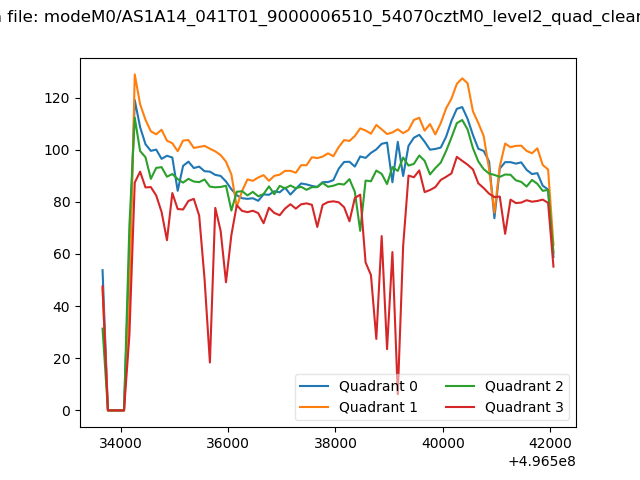
| Quadrant-wise count rates Data is divided into 100 sec bins |
 |
|
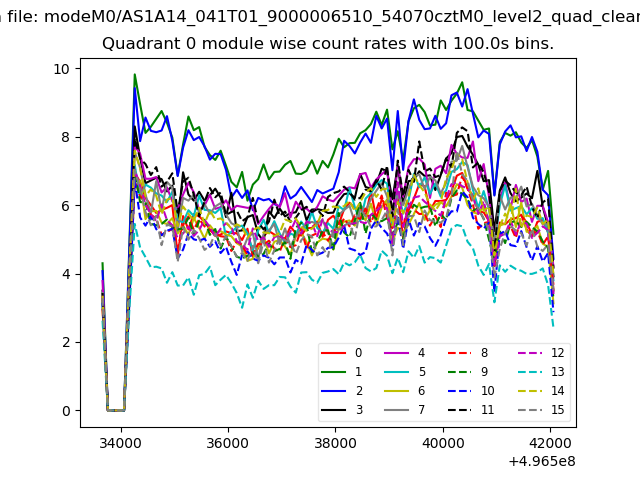
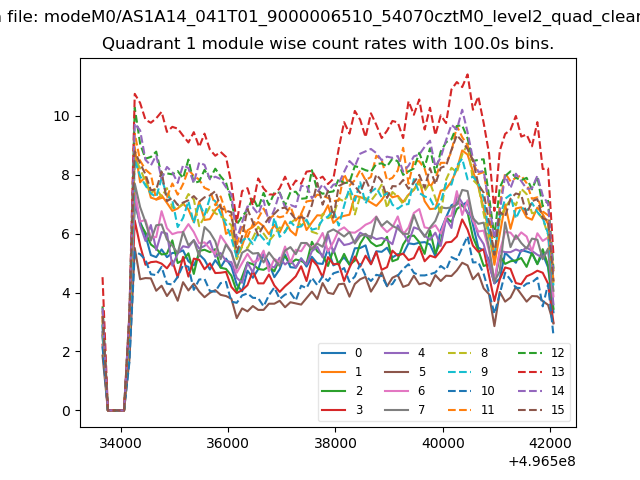
| Module-wise count rates for Quadrant A Data is divided into 100 sec bins |
 |
 |
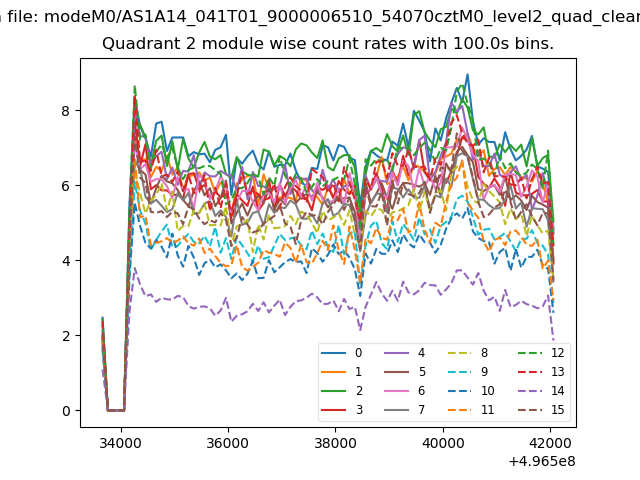
| Module-wise count rates for Quadrant B Data is divided into 100 sec bins |
 |
 |
| Module-wise count rates for Quadrant C Data is divided into 100 sec bins |
 |
 |
| Module-wise count rates for Quadrant D Data is divided into 100 sec bins |
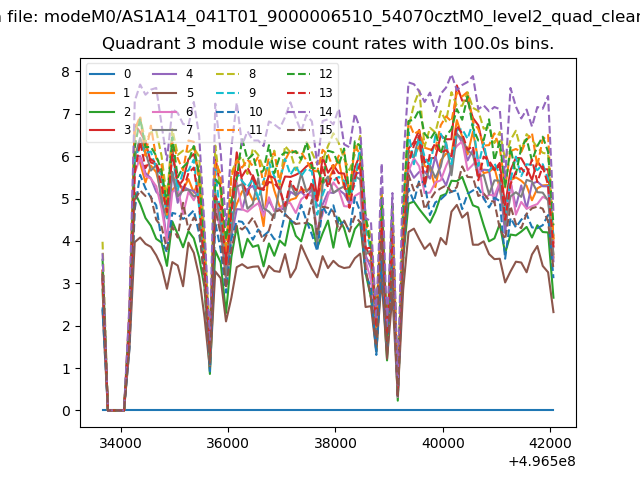 |
 |
| Parameter | Plot |
|---|---|
| CZT HV Monitor | 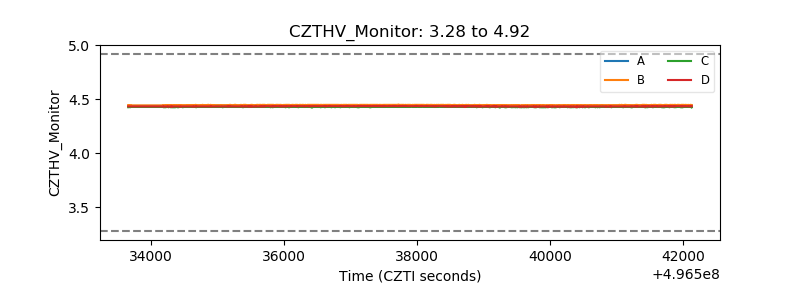 |
| D_VDD | 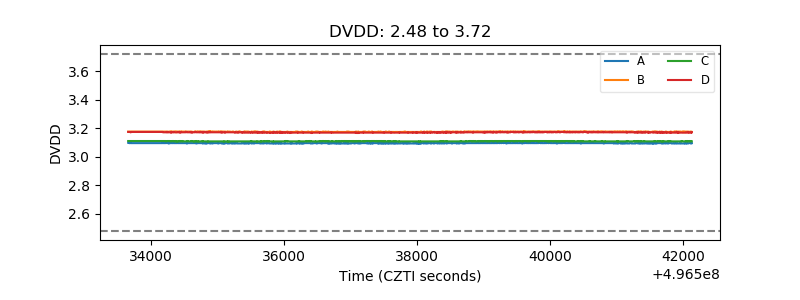 |
| Temperature 1 | 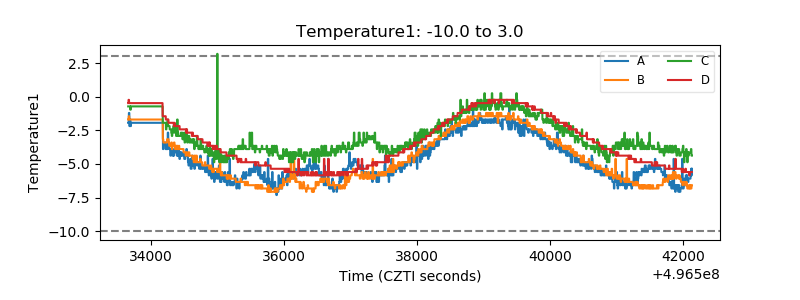 |
| Veto HV Monitor | 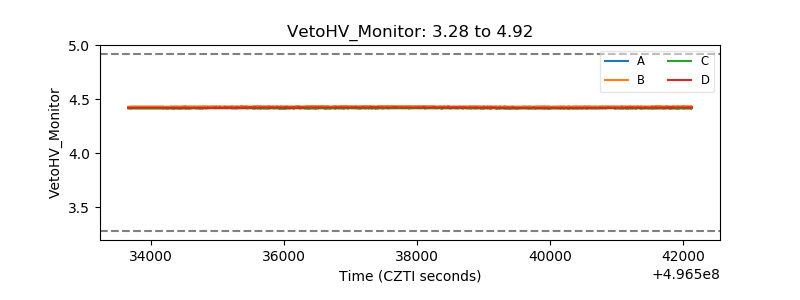 |
| Veto LLD | 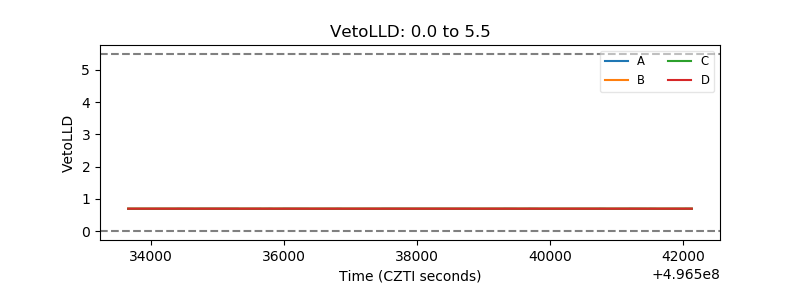 |
| Alpha Counter | 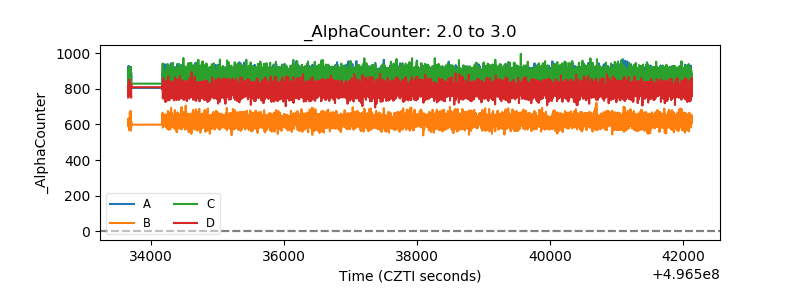 |
| _CPM_Rate | 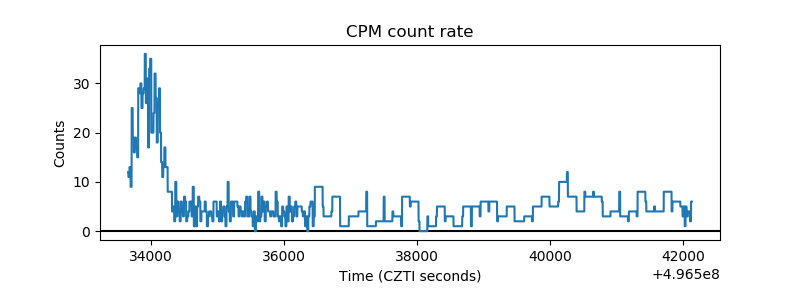 |
| CZT Counter | 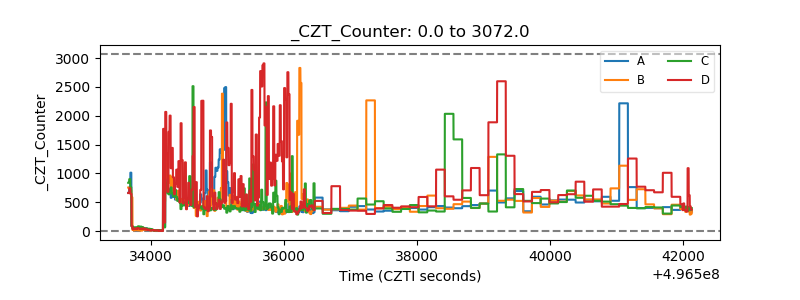 |
| +2.5 Volts monitor |  |
| +5 Volts monitor |  |
| _ROLL_ROT | 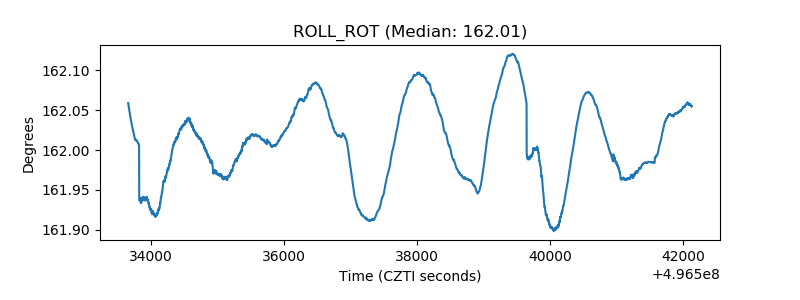 |
| _Roll_DEC | 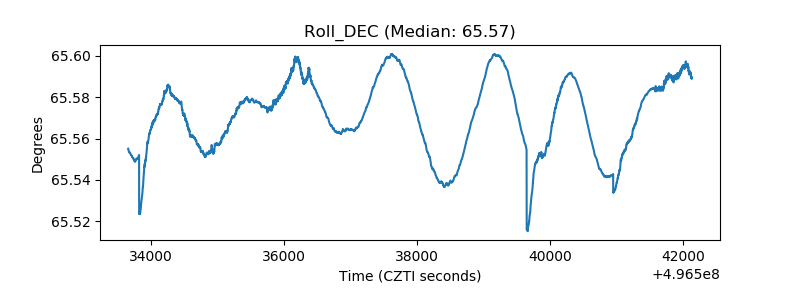 |
| _Roll_RA | 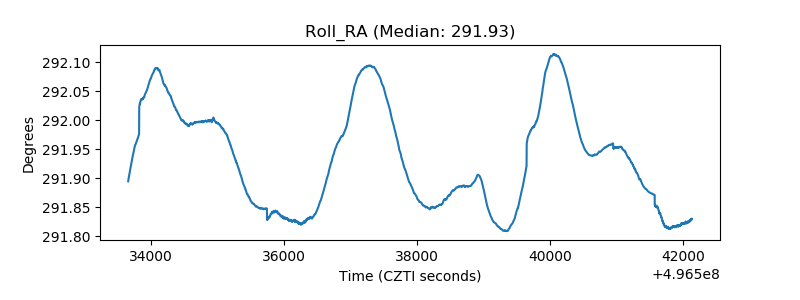 |
| Veto Counter | 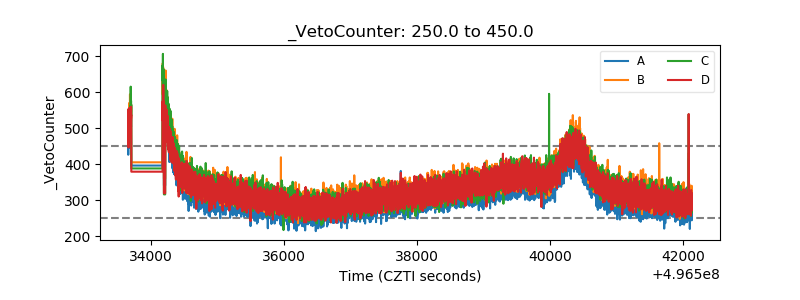 |