| Param | Original file | Final file |
|---|---|---|
| Filename | modeM0/AS1A14_041T01_9000006510_54071cztM0_level2.fits | modeM0/AS1A14_041T01_9000006510_54071cztM0_level2_quad_clean.evt |
| Size (bytes) | 598,135,680 | 126,383,040 |
| Size | 570.4 MB | 120.5 MB |
| Events in quadrant A | 4,540,357 | 828,521 |
| Events in quadrant B | 4,575,645 | 899,333 |
| Events in quadrant C | 5,464,718 | 774,868 |
| Events in quadrant D | 6,875,028 | 710,967 |
| Mode SS | |||
|---|---|---|---|
| Quadrant | BADHDUFLAG | Total packets | Discarded packets |
| A | 0 | 176 | 0 |
| B | 0 | 176 | 0 |
| C | 0 | 176 | 0 |
| D | 0 | 176 | 0 |
| Mode M0 | |||
|---|---|---|---|
| Quadrant | BADHDUFLAG | Total packets | Discarded packets |
| A | 0 | 19749 | 0 |
| B | 0 | 20183 | 0 |
| C | 0 | 22711 | 0 |
| D | 0 | 26737 | 0 |
| Quadrant | Total seconds | Saturated seconds | Saturation percentage |
|---|---|---|---|
| A | 8830 | 92 | 1.041903% |
| B | 8831 | 178 | 2.015627% |
| C | 8831 | 384 | 4.348318% |
| D | 8831 | 483 | 5.469369% |
Noise dominated data is calculated using 1-second bins in cleaned event files. If a bin has >2000 counts, and if more than 50% of those come from <1% of pixels, then it is considered to be noise-dominated and hence unusable.
| Quadrant | # 1 sec bins | Bins with >0 counts | Bins with >2000 counts | High rate bins dominated by noise | Noise dominated (total time) | Noise dominated (detector-on time) | Marked lightcurve |
|---|---|---|---|---|---|---|---|
| A | 8830 | 8830 | 89 | 89 | 1.01% | 1.01% | 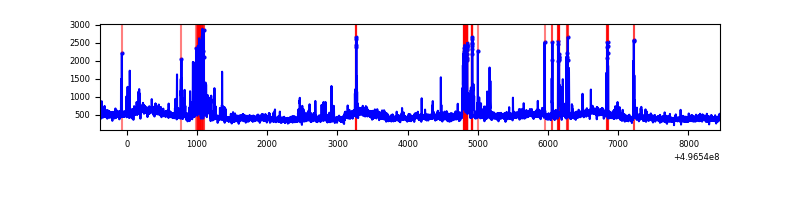 |
| B | 8831 | 8831 | 98 | 98 | 1.11% | 1.11% | 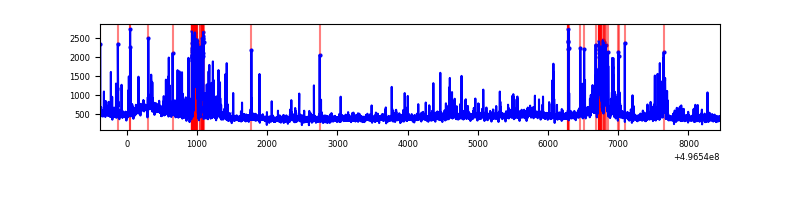 |
| C | 8830 | 8830 | 398 | 398 | 4.51% | 4.51% | 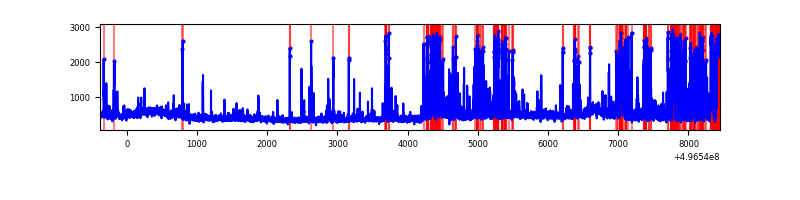 |
| D | 8831 | 8831 | 499 | 499 | 5.65% | 5.65% | 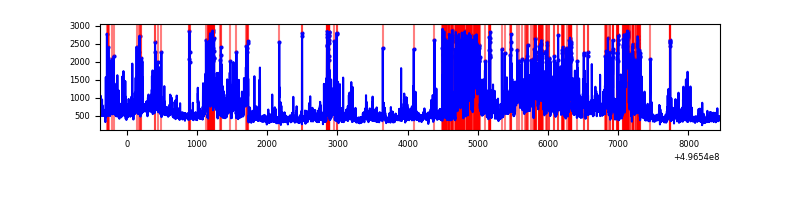 |
Top three noisy pixels from each quadrant. If the there are fewer than three noisy pixels in the level2.evt file, extra rows are filled as -1
| Pixel properties | Quadrant properties | ||||||
|---|---|---|---|---|---|---|---|
| Quadrant | DetID | PixID | Counts | Sigma | Mean | Median | Sigma |
| A | 15 | 174 | 366294 | 1571.13 | 938 | 912 | 232.6 |
| A | 14 | 235 | 184008 | 787.31 | 938 | 912 | 232.6 |
| A | 0 | 8 | 149027 | 636.89 | 938 | 912 | 232.6 |
| B | 7 | 252 | 296274 | 1479.56 | 937 | 906 | 199.6 |
| B | 10 | 28 | 154538 | 769.57 | 937 | 906 | 199.6 |
| B | 5 | 236 | 101204 | 502.41 | 937 | 906 | 199.6 |
| C | 15 | 233 | 1519084 | 6097.5 | 913 | 904 | 249.0 |
| C | 12 | 252 | 69036 | 273.64 | 913 | 904 | 249.0 |
| C | 14 | 254 | 67557 | 267.7 | 913 | 904 | 249.0 |
| D | 2 | 172 | 1061283 | 4204.53 | 897 | 856 | 252.2 |
| D | 8 | 176 | 998024 | 3953.71 | 897 | 856 | 252.2 |
| D | 12 | 2 | 469780 | 1859.26 | 897 | 856 | 252.2 |
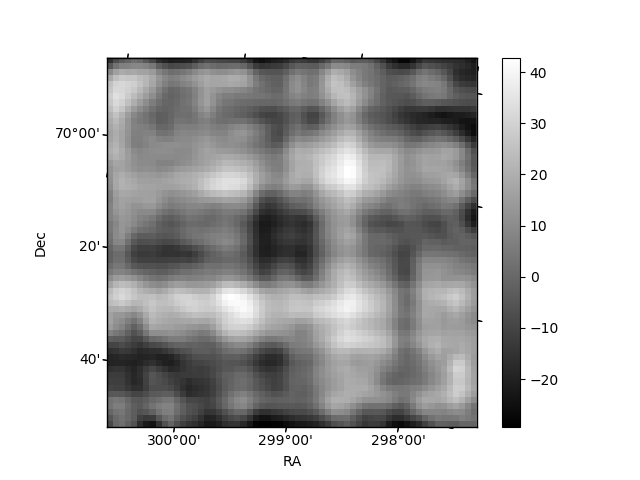
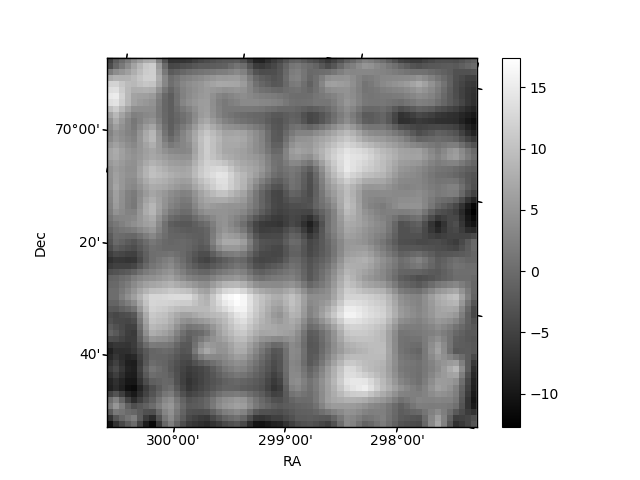
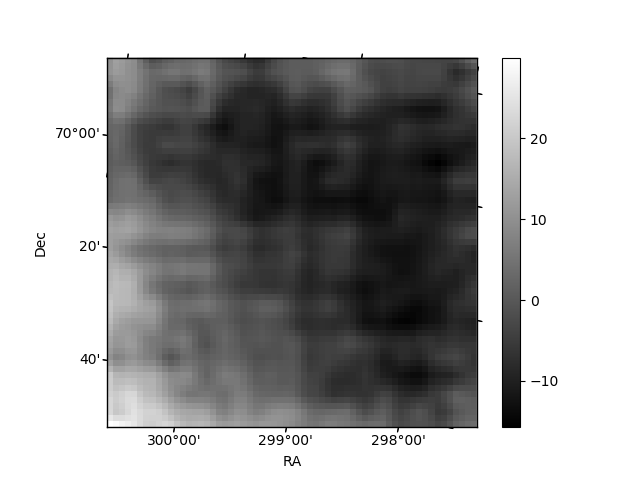
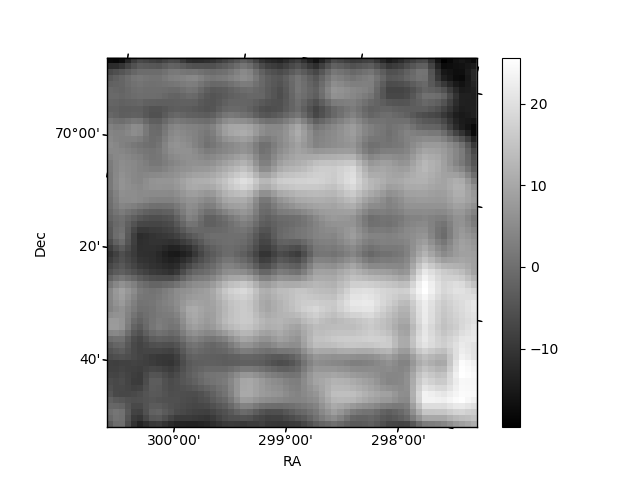
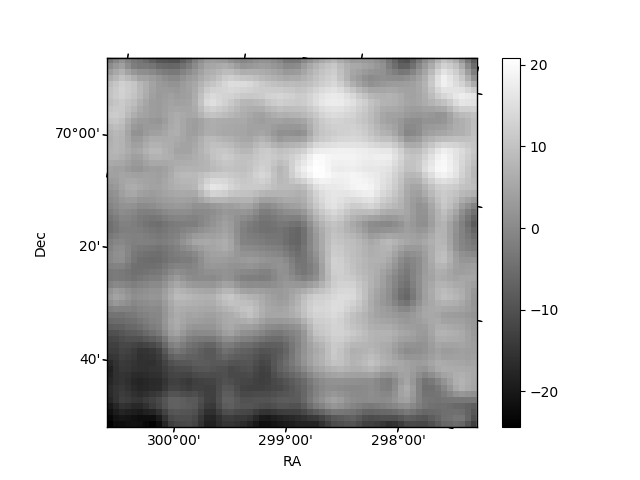
Histogram calculated using DETX and DETY for each event in the final _common_clean file
| Quadrant A | 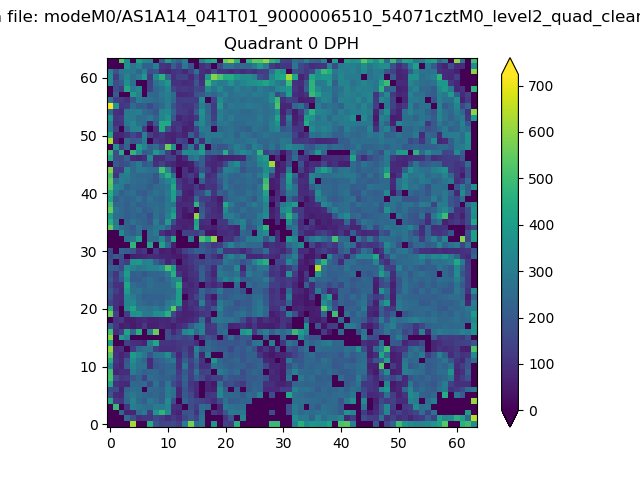 |
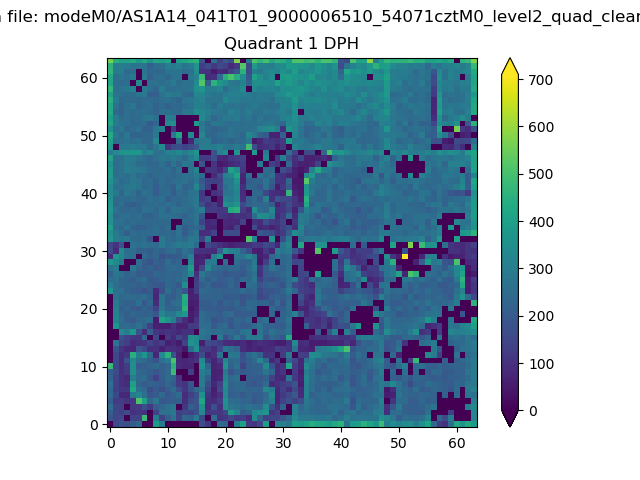 |
Quadrant B |
|---|---|---|---|
| Quadrant D | 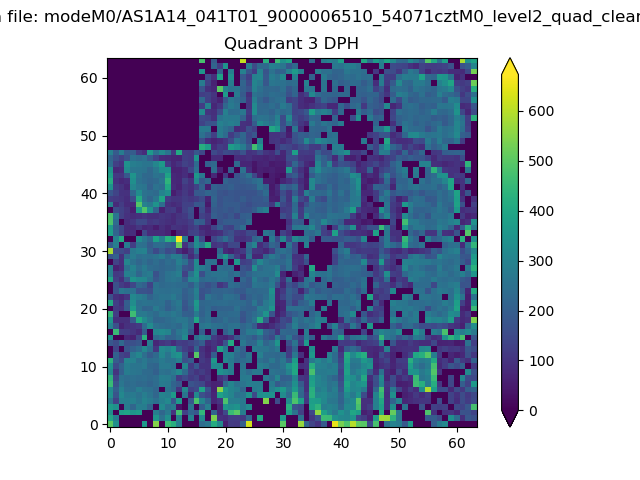 |
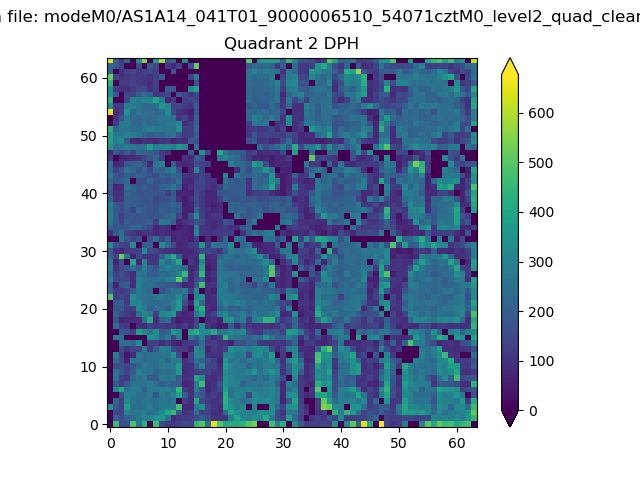 |
Quadrant C |
| Plot type | Count rate plots | Images |
|---|---|---|
| Comparison with Poisson distribution Blue bars denote a histogram of data divided into 1 sec bins. Red curve is a Poisson curve with rate = median count rate of data. |
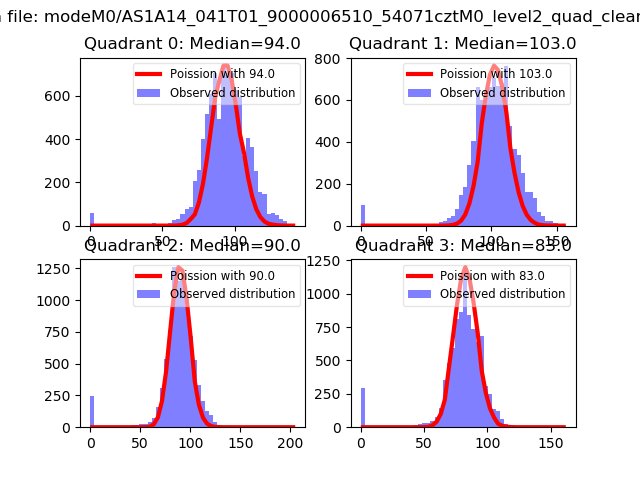 |
 |
| Quadrant-wise count rates Data is divided into 100 sec bins |
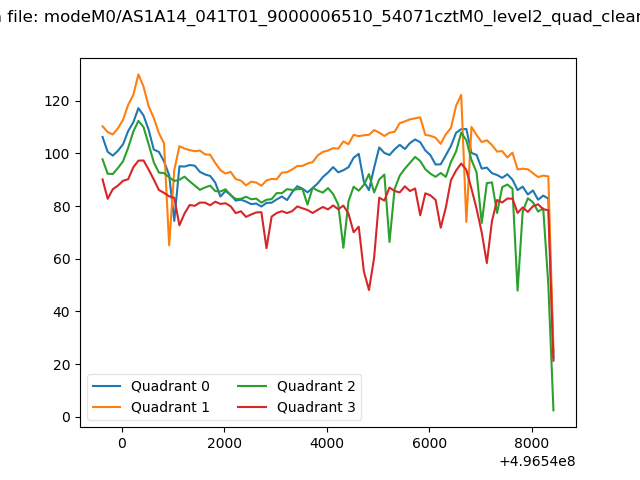 |
|
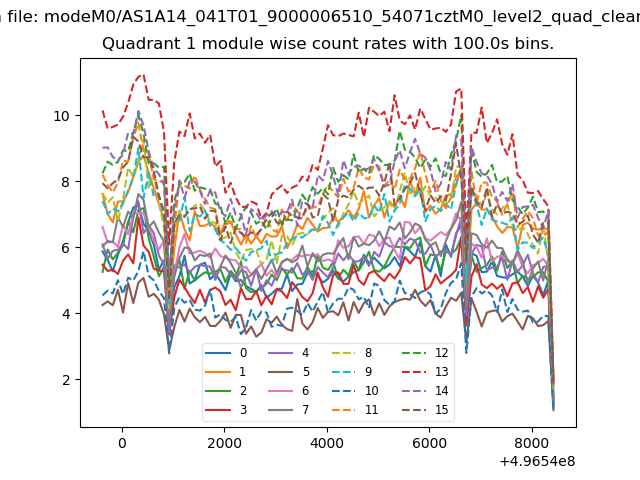
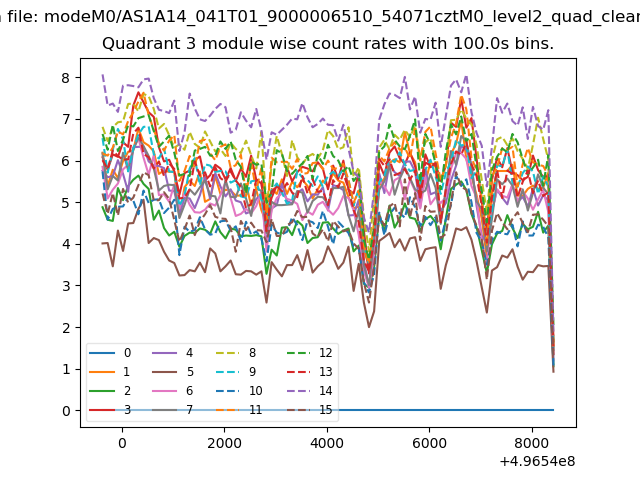
| Module-wise count rates for Quadrant A Data is divided into 100 sec bins |
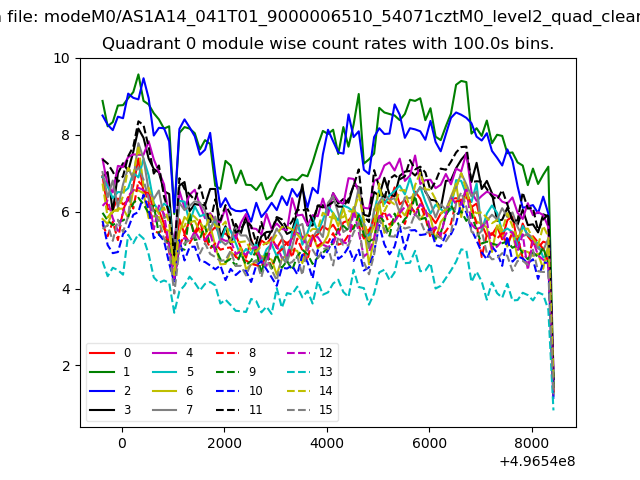 |
 |
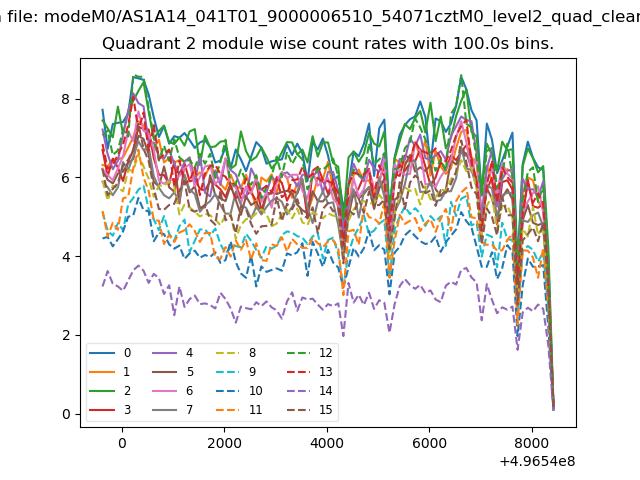
| Module-wise count rates for Quadrant B Data is divided into 100 sec bins |
 |
 |
| Module-wise count rates for Quadrant C Data is divided into 100 sec bins |
 |
 |
| Module-wise count rates for Quadrant D Data is divided into 100 sec bins |
 |
 |
| Parameter | Plot |
|---|---|
| CZT HV Monitor | 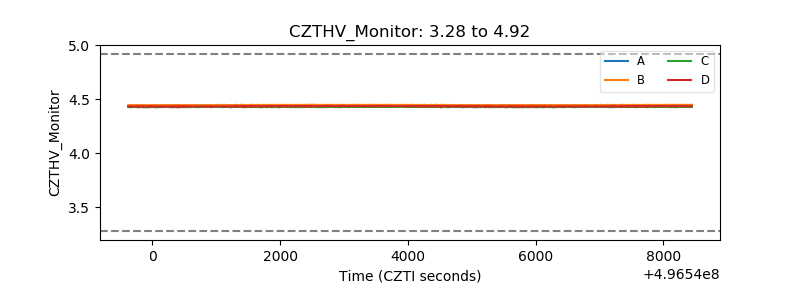 |
| D_VDD | 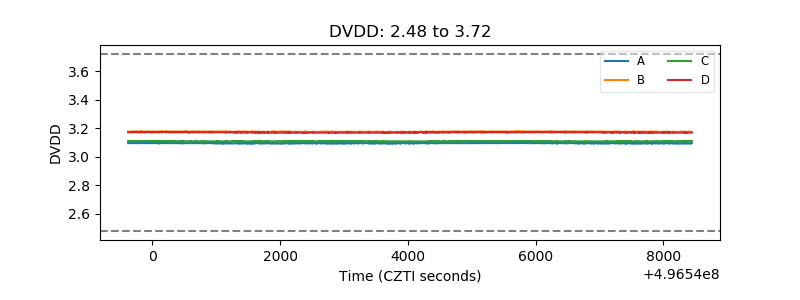 |
| Temperature 1 | 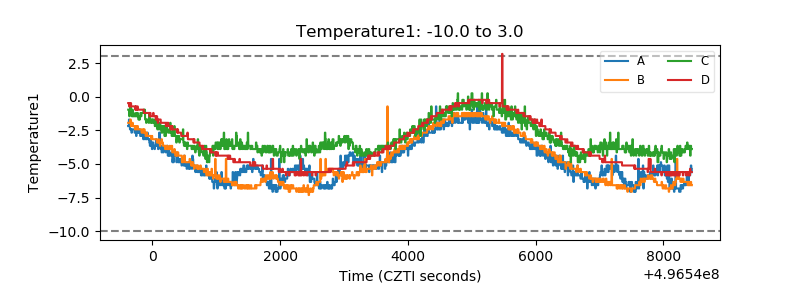 |
| Veto HV Monitor | 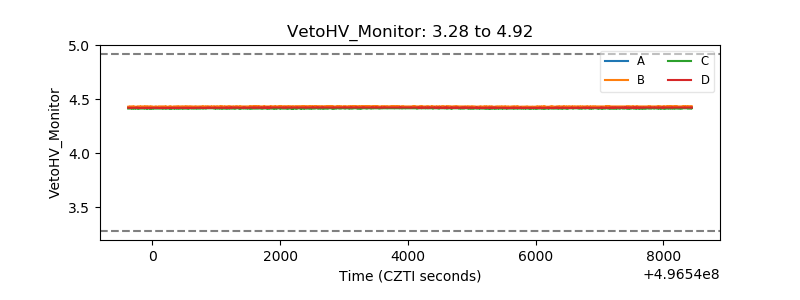 |
| Veto LLD | 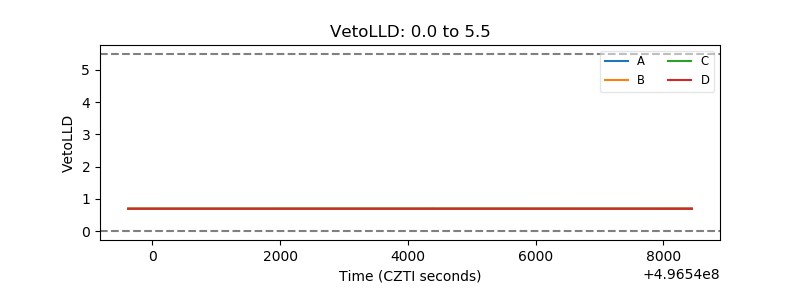 |
| Alpha Counter | 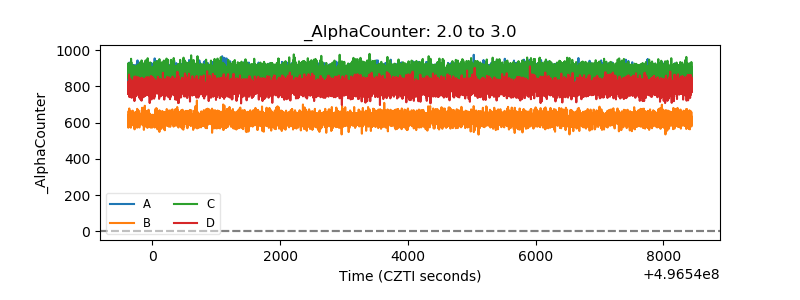 |
| _CPM_Rate | 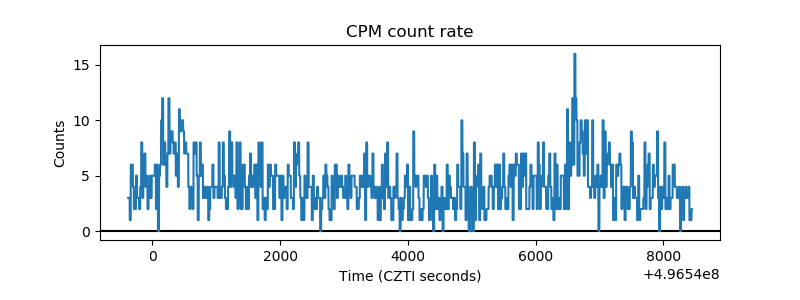 |
| CZT Counter | 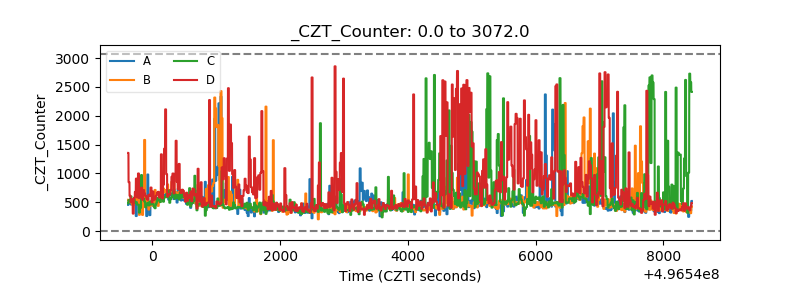 |
| +2.5 Volts monitor |  |
| +5 Volts monitor |  |
| _ROLL_ROT | 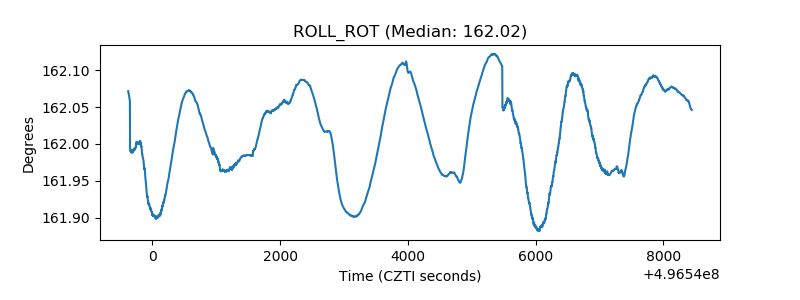 |
| _Roll_DEC | 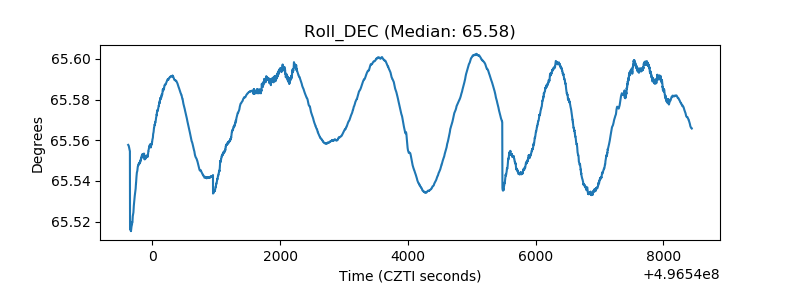 |
| _Roll_RA | 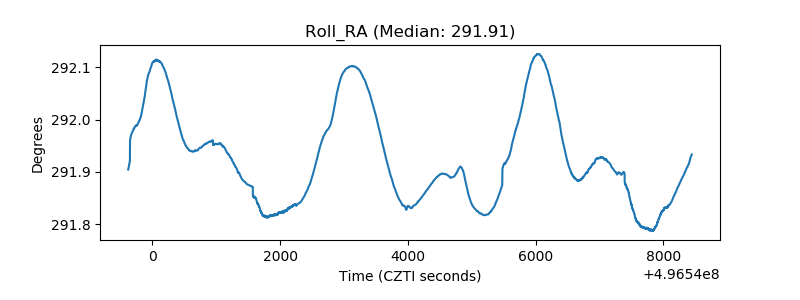 |
| Veto Counter | 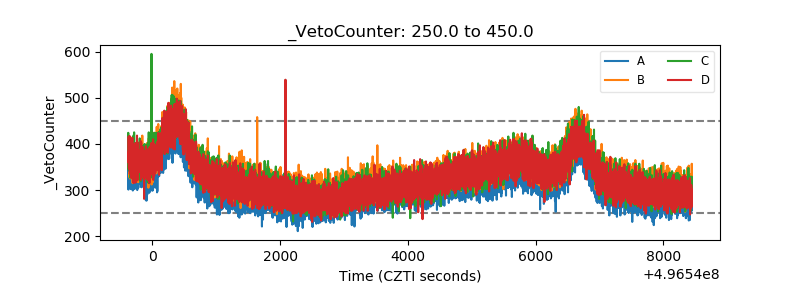 |