| Param | Original file | Final file |
|---|---|---|
| Filename | modeM0/AS1A14_041T01_9000006510_54074cztM0_level2.fits | modeM0/AS1A14_041T01_9000006510_54074cztM0_level2_quad_clean.evt |
| Size (bytes) | 753,376,320 | 131,607,360 |
| Size | 718.5 MB | 125.5 MB |
| Events in quadrant A | 5,453,884 | 865,141 |
| Events in quadrant B | 5,029,630 | 962,045 |
| Events in quadrant C | 8,841,236 | 726,823 |
| Events in quadrant D | 7,816,526 | 762,844 |
| Mode SS | |||
|---|---|---|---|
| Quadrant | BADHDUFLAG | Total packets | Discarded packets |
| A | 0 | 194 | 0 |
| B | 0 | 194 | 0 |
| C | 0 | 194 | 0 |
| D | 0 | 194 | 0 |
| Mode M0 | |||
|---|---|---|---|
| Quadrant | BADHDUFLAG | Total packets | Discarded packets |
| A | 0 | 23391 | 0 |
| B | 0 | 22084 | 0 |
| C | 0 | 33130 | 0 |
| D | 0 | 30012 | 0 |
| Quadrant | Total seconds | Saturated seconds | Saturation percentage |
|---|---|---|---|
| A | 9623 | 434 | 4.510028% |
| B | 9624 | 288 | 2.992519% |
| C | 9624 | 1595 | 16.573150% |
| D | 9624 | 637 | 6.618869% |
Noise dominated data is calculated using 1-second bins in cleaned event files. If a bin has >2000 counts, and if more than 50% of those come from <1% of pixels, then it is considered to be noise-dominated and hence unusable.
| Quadrant | # 1 sec bins | Bins with >0 counts | Bins with >2000 counts | High rate bins dominated by noise | Noise dominated (total time) | Noise dominated (detector-on time) | Marked lightcurve |
|---|---|---|---|---|---|---|---|
| A | 9623 | 9623 | 343 | 343 | 3.56% | 3.56% | 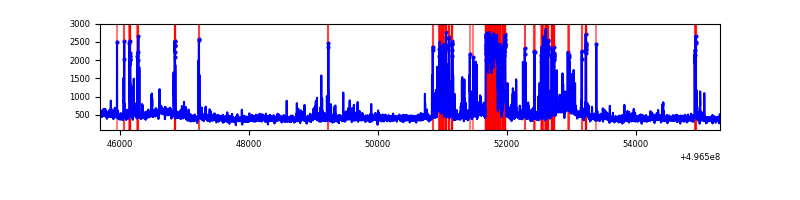 |
| B | 9624 | 9624 | 133 | 133 | 1.38% | 1.38% | 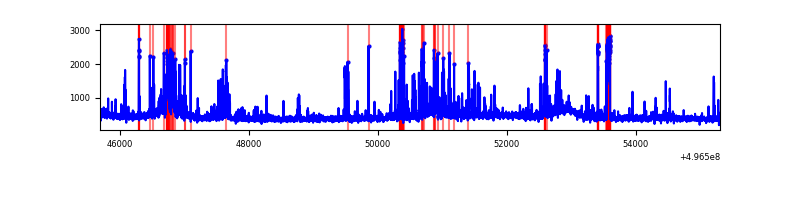 |
| C | 9623 | 9623 | 1601 | 1601 | 16.64% | 16.64% | 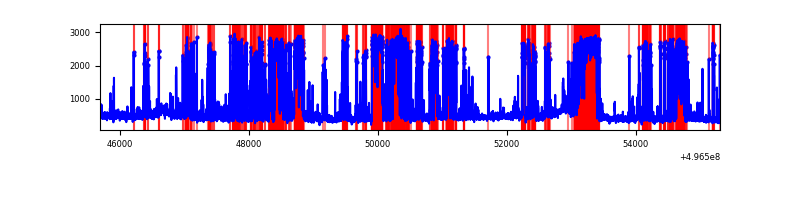 |
| D | 9624 | 9624 | 637 | 637 | 6.62% | 6.62% | 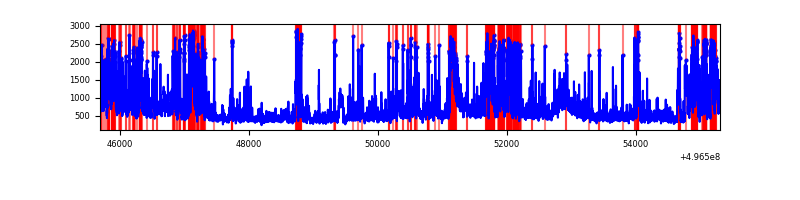 |
Top three noisy pixels from each quadrant. If the there are fewer than three noisy pixels in the level2.evt file, extra rows are filled as -1
| Pixel properties | Quadrant properties | ||||||
|---|---|---|---|---|---|---|---|
| Quadrant | DetID | PixID | Counts | Sigma | Mean | Median | Sigma |
| A | 15 | 174 | 1050366 | 4248.01 | 1006 | 982 | 247.0 |
| A | 0 | 8 | 243873 | 983.25 | 1006 | 982 | 247.0 |
| A | 14 | 235 | 97702 | 391.53 | 1006 | 982 | 247.0 |
| B | 5 | 236 | 306534 | 1405.85 | 1017 | 982 | 217.3 |
| B | 5 | 185 | 195705 | 895.92 | 1017 | 982 | 217.3 |
| B | 10 | 28 | 161886 | 740.32 | 1017 | 982 | 217.3 |
| C | 15 | 233 | 4256935 | 16777.85 | 928 | 919 | 253.7 |
| C | 1 | 60 | 526564 | 2072.17 | 928 | 919 | 253.7 |
| C | 14 | 254 | 86687 | 338.11 | 928 | 919 | 253.7 |
| D | 2 | 172 | 2141676 | 7778.07 | 973 | 931 | 275.2 |
| D | 12 | 2 | 656287 | 2381.14 | 973 | 931 | 275.2 |
| D | 3 | 12 | 286504 | 1037.58 | 973 | 931 | 275.2 |
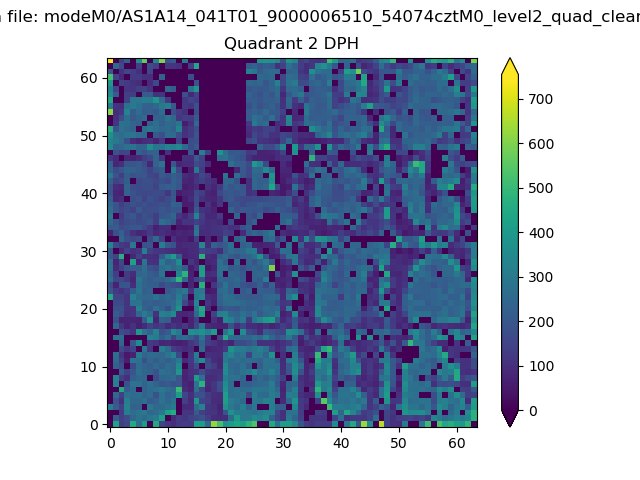
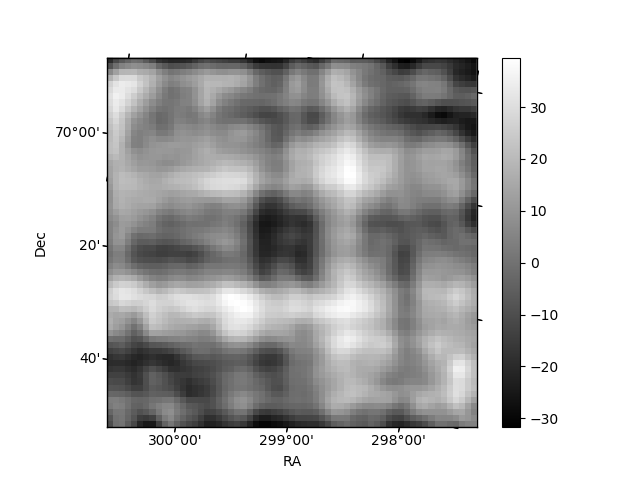
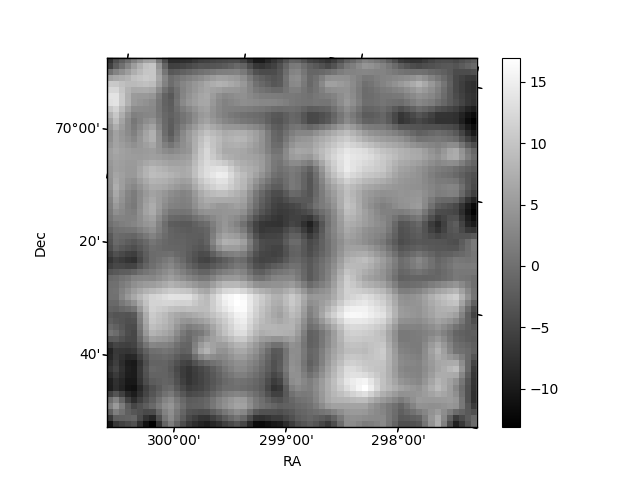
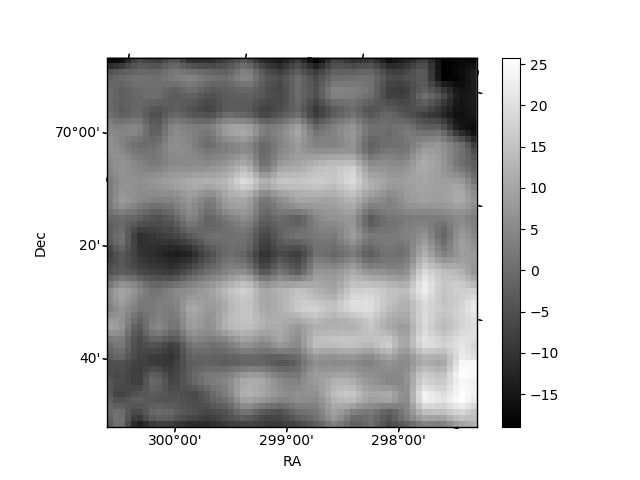
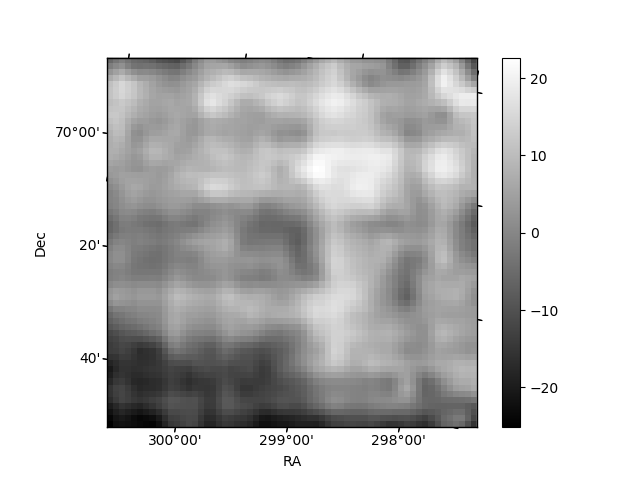
Histogram calculated using DETX and DETY for each event in the final _common_clean file
| Quadrant A | 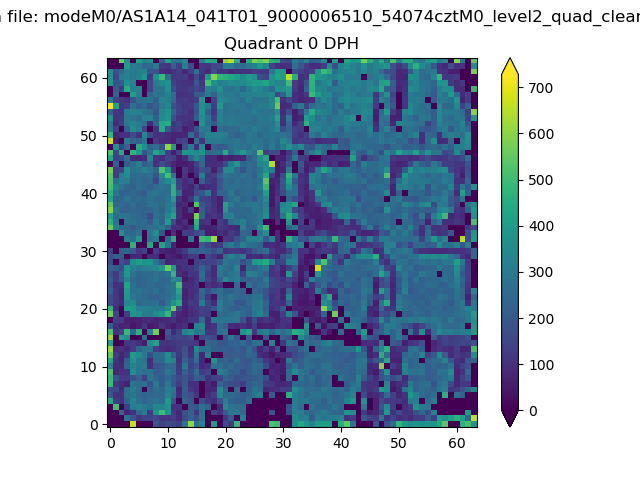 |
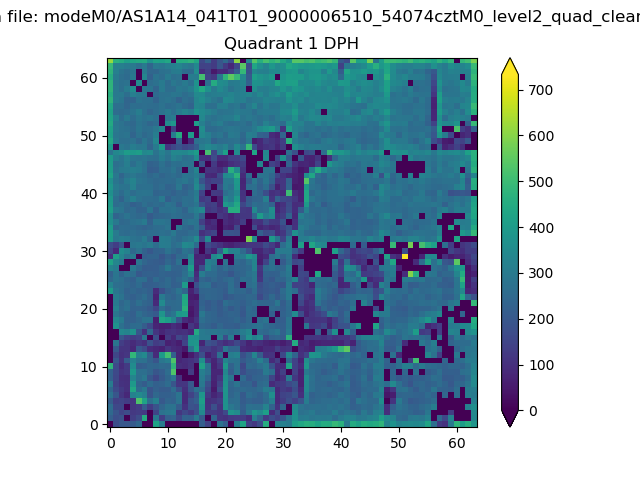 |
Quadrant B |
|---|---|---|---|
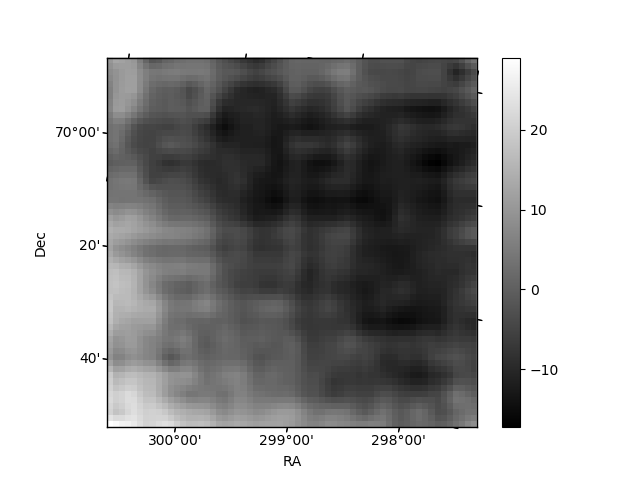
| Quadrant D | 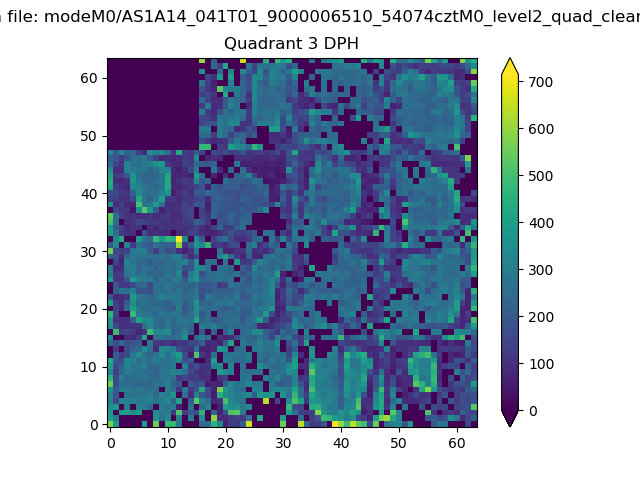 |
 |
Quadrant C |
| Plot type | Count rate plots | Images |
|---|---|---|
| Comparison with Poisson distribution Blue bars denote a histogram of data divided into 1 sec bins. Red curve is a Poisson curve with rate = median count rate of data. |
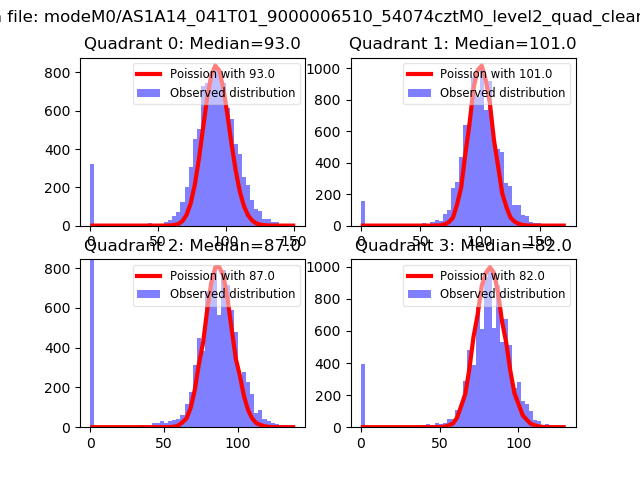 |
 |
| Quadrant-wise count rates Data is divided into 100 sec bins |
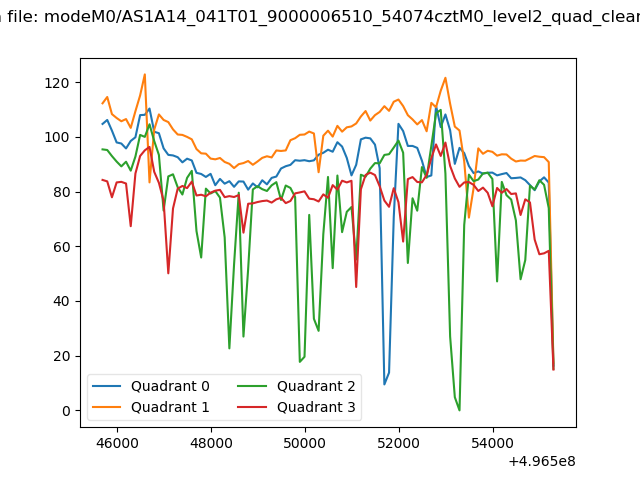 |
|
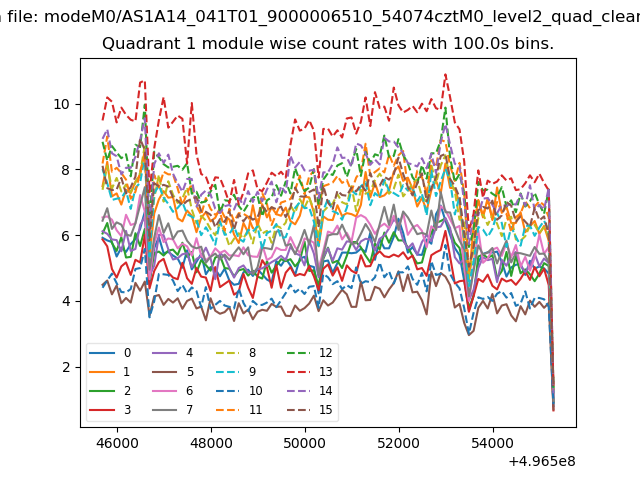
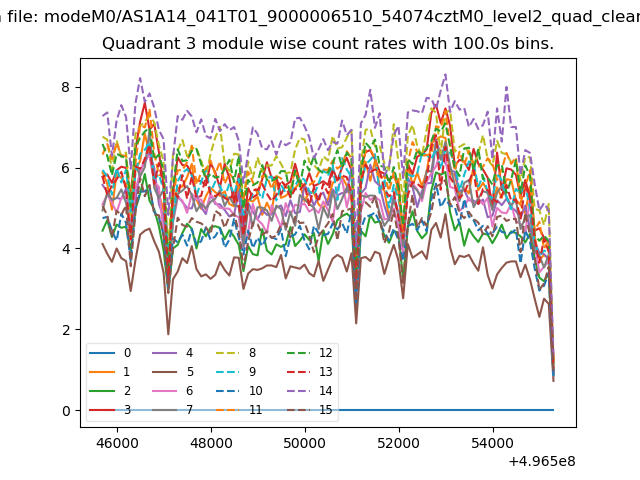
| Module-wise count rates for Quadrant A Data is divided into 100 sec bins |
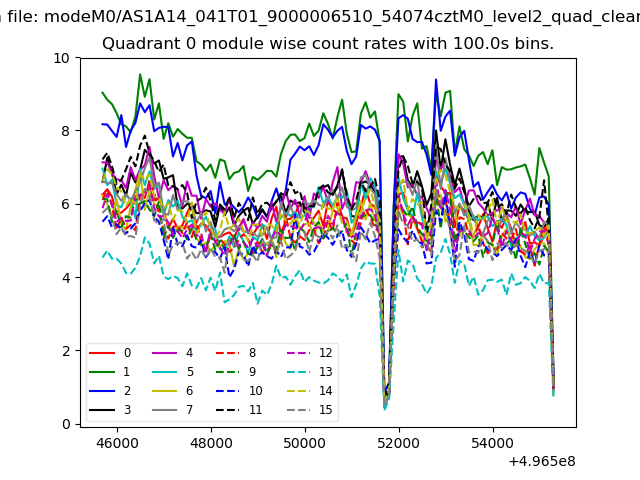 |
 |
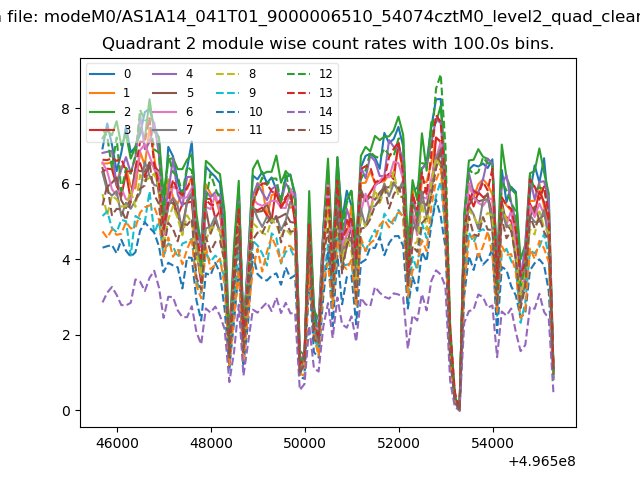
| Module-wise count rates for Quadrant B Data is divided into 100 sec bins |
 |
 |
| Module-wise count rates for Quadrant C Data is divided into 100 sec bins |
 |
 |
| Module-wise count rates for Quadrant D Data is divided into 100 sec bins |
 |
 |
| Parameter | Plot |
|---|---|
| CZT HV Monitor | 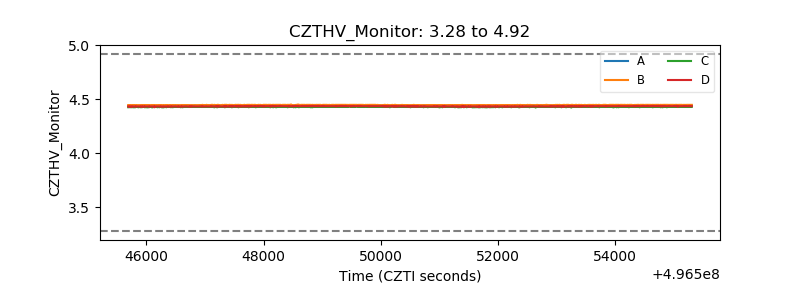 |
| D_VDD | 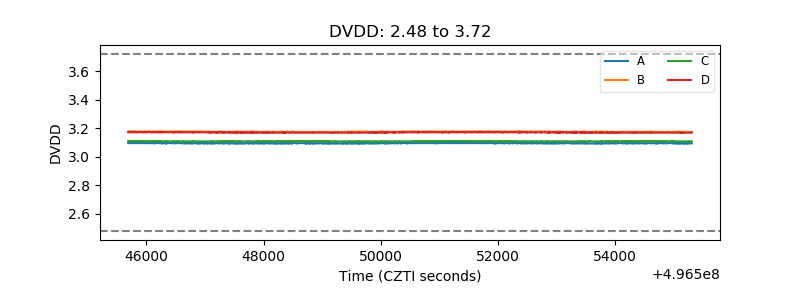 |
| Temperature 1 | 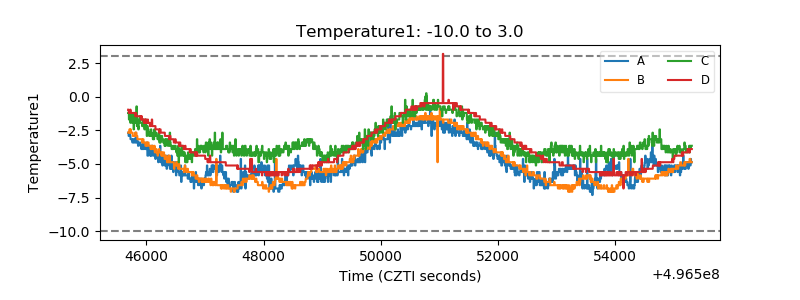 |
| Veto HV Monitor | 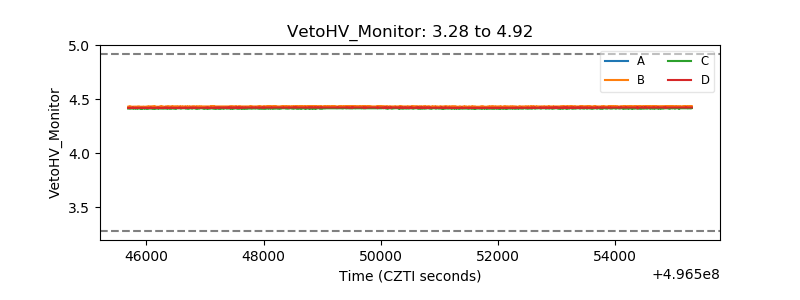 |
| Veto LLD | 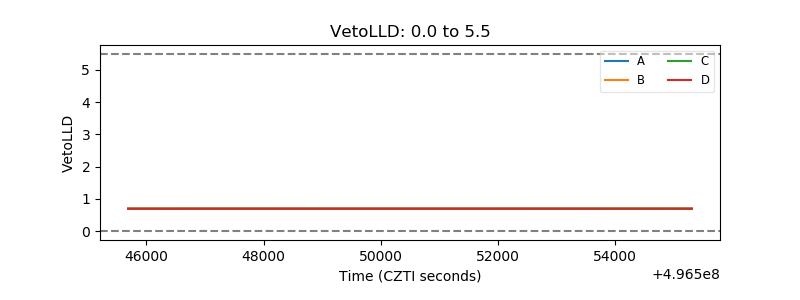 |
| Alpha Counter | 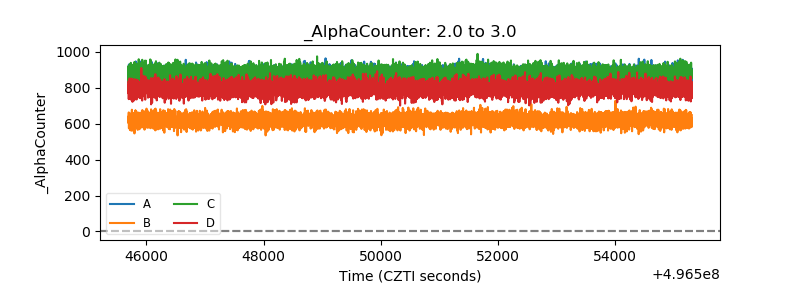 |
| _CPM_Rate | 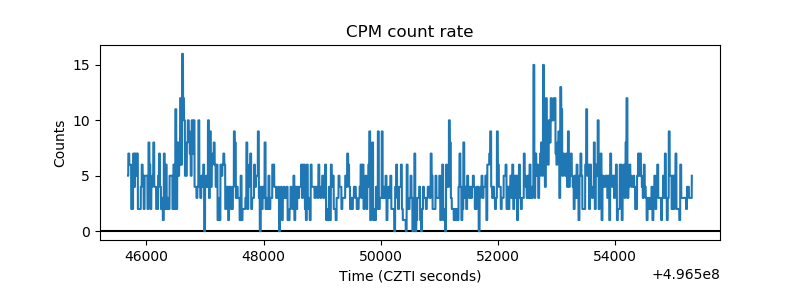 |
| CZT Counter | 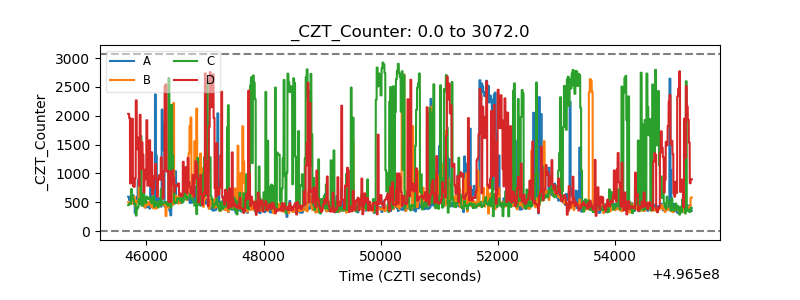 |
| +2.5 Volts monitor |  |
| +5 Volts monitor |  |
| _ROLL_ROT | 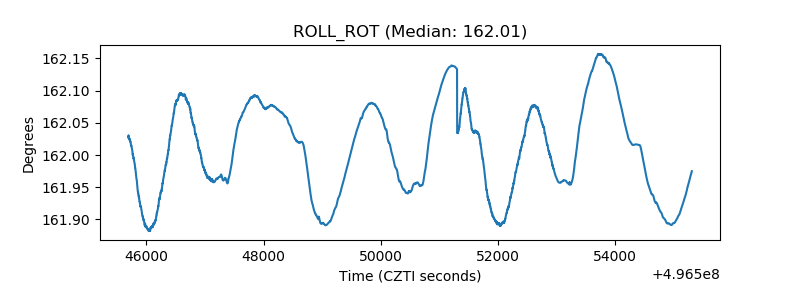 |
| _Roll_DEC | 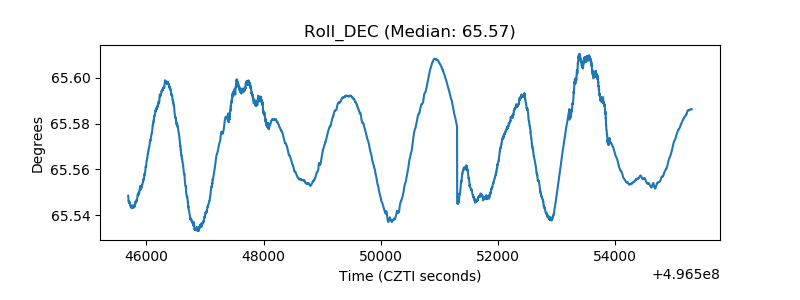 |
| _Roll_RA | 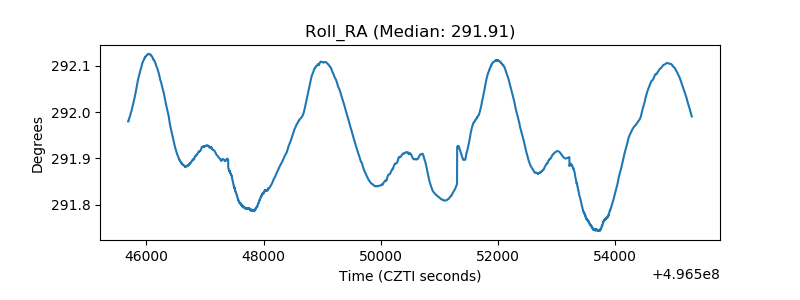 |
| Veto Counter | 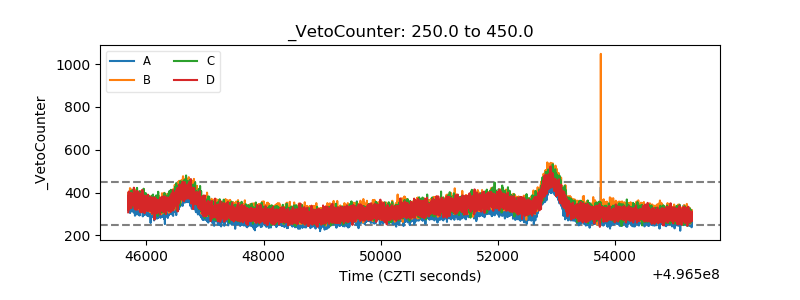 |