| Param | Original file | Final file |
|---|---|---|
| Filename | modeM0/AS1A14_041T01_9000006510_54075cztM0_level2.fits | modeM0/AS1A14_041T01_9000006510_54075cztM0_level2_quad_clean.evt |
| Size (bytes) | 1,555,496,640 | 227,309,760 |
| Size | 1.4 GB | 216.8 MB |
| Events in quadrant A | 9,362,431 | 1,587,649 |
| Events in quadrant B | 11,231,085 | 1,689,245 |
| Events in quadrant C | 12,158,550 | 1,423,194 |
| Events in quadrant D | 23,460,108 | 963,759 |
| Mode M9 | |||
|---|---|---|---|
| Quadrant | BADHDUFLAG | Total packets | Discarded packets |
| A | 0 | 16 | 0 |
| B | 0 | 16 | 0 |
| C | 0 | 16 | 0 |
| D | 0 | 16 | 0 |
| Mode SS | |||
|---|---|---|---|
| Quadrant | BADHDUFLAG | Total packets | Discarded packets |
| A | 0 | 358 | 0 |
| B | 0 | 358 | 0 |
| C | 0 | 358 | 0 |
| D | 0 | 358 | 0 |
| Mode M0 | |||
|---|---|---|---|
| Quadrant | BADHDUFLAG | Total packets | Discarded packets |
| A | 0 | 40652 | 4 |
| B | 0 | 45928 | 6 |
| C | 0 | 49266 | 3 |
| D | 0 | 81935 | 3 |
| Quadrant | Total seconds | Saturated seconds | Saturation percentage |
|---|---|---|---|
| A | 17671 | 592 | 3.350122% |
| B | 17670 | 1088 | 6.157329% |
| C | 17672 | 1525 | 8.629470% |
| D | 17672 | 5720 | 32.367587% |
Noise dominated data is calculated using 1-second bins in cleaned event files. If a bin has >2000 counts, and if more than 50% of those come from <1% of pixels, then it is considered to be noise-dominated and hence unusable.
| Quadrant | # 1 sec bins | Bins with >0 counts | Bins with >2000 counts | High rate bins dominated by noise | Noise dominated (total time) | Noise dominated (detector-on time) | Marked lightcurve |
|---|---|---|---|---|---|---|---|
| A | 19236 | 17673 | 352 | 352 | 1.83% | 1.99% | 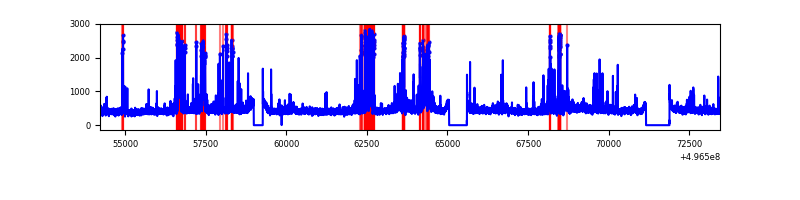 |
| B | 19236 | 17672 | 674 | 674 | 3.50% | 3.81% | 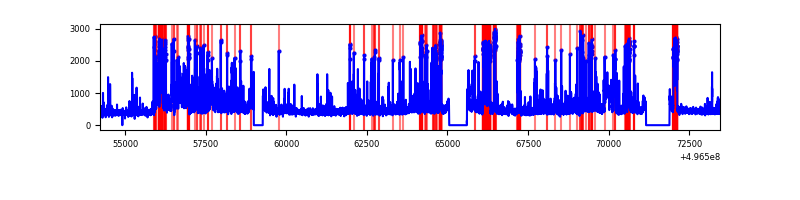 |
| C | 19236 | 17673 | 1359 | 1359 | 7.06% | 7.69% | 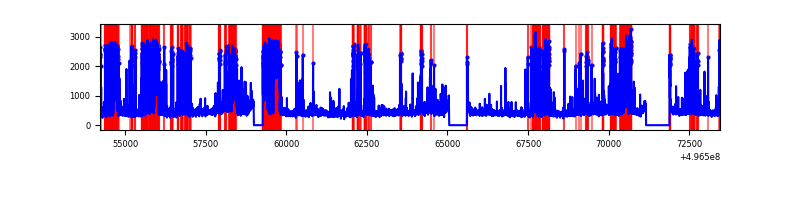 |
| D | 19236 | 17673 | 5440 | 5440 | 28.28% | 30.78% | 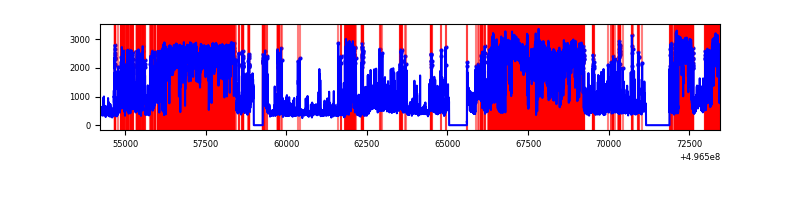 |
Top three noisy pixels from each quadrant. If the there are fewer than three noisy pixels in the level2.evt file, extra rows are filled as -1
| Pixel properties | Quadrant properties | ||||||
|---|---|---|---|---|---|---|---|
| Quadrant | DetID | PixID | Counts | Sigma | Mean | Median | Sigma |
| A | 15 | 174 | 1505752 | 3278.85 | 1858 | 1808 | 458.7 |
| A | 3 | 14 | 268804 | 582.1 | 1858 | 1808 | 458.7 |
| A | 0 | 8 | 115032 | 246.85 | 1858 | 1808 | 458.7 |
| B | 5 | 236 | 1975765 | 5092.87 | 1828 | 1761 | 387.6 |
| B | 10 | 28 | 486731 | 1251.21 | 1828 | 1761 | 387.6 |
| B | 5 | 185 | 396299 | 1017.9 | 1828 | 1761 | 387.6 |
| C | 15 | 233 | 3893665 | 8022.53 | 1754 | 1733 | 485.1 |
| C | 1 | 241 | 503538 | 1034.38 | 1754 | 1733 | 485.1 |
| C | 9 | 38 | 230265 | 471.08 | 1754 | 1733 | 485.1 |
| D | 8 | 176 | 7825337 | 17886.16 | 1527 | 1459 | 437.4 |
| D | 2 | 172 | 5586662 | 12768.33 | 1527 | 1459 | 437.4 |
| D | 2 | 165 | 2307888 | 5272.73 | 1527 | 1459 | 437.4 |
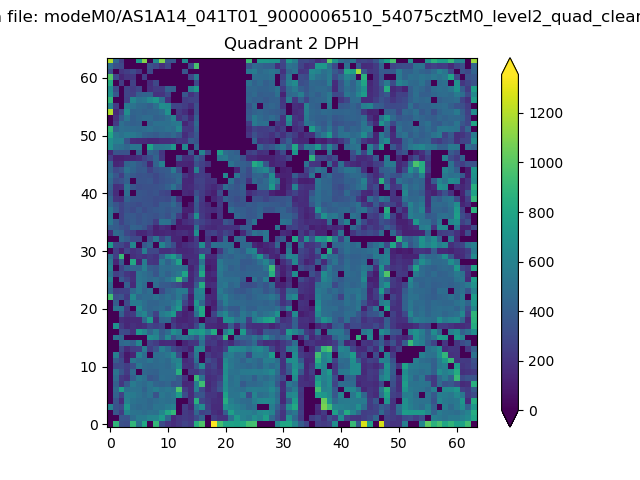
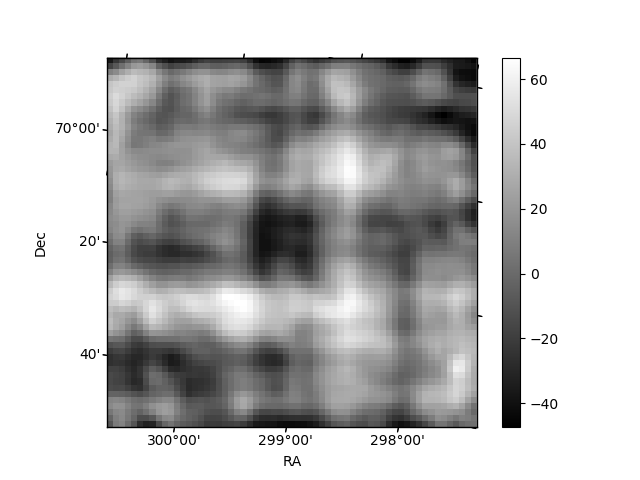
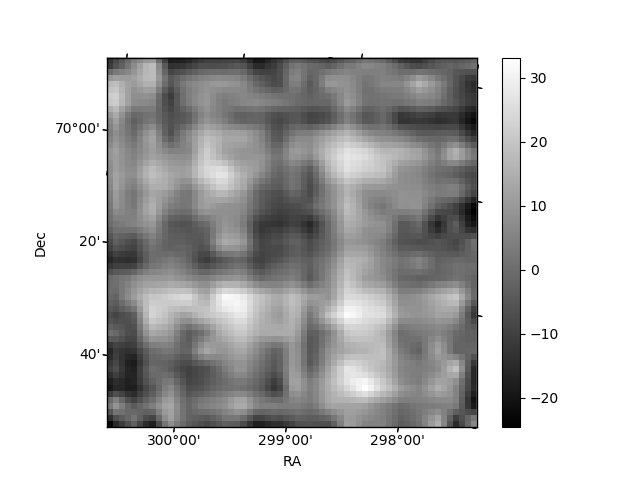
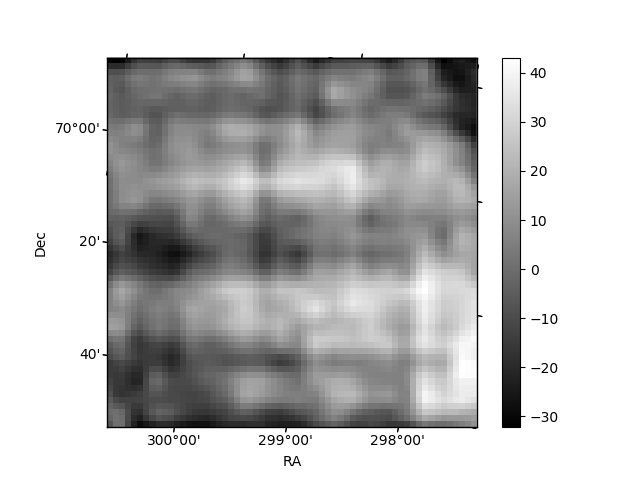
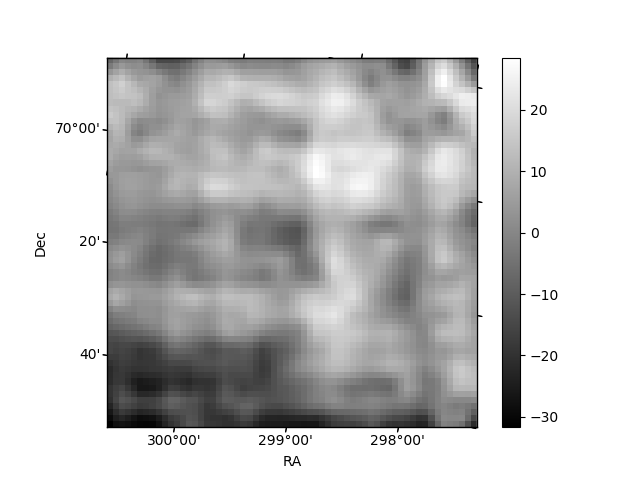
Histogram calculated using DETX and DETY for each event in the final _common_clean file
| Quadrant A | 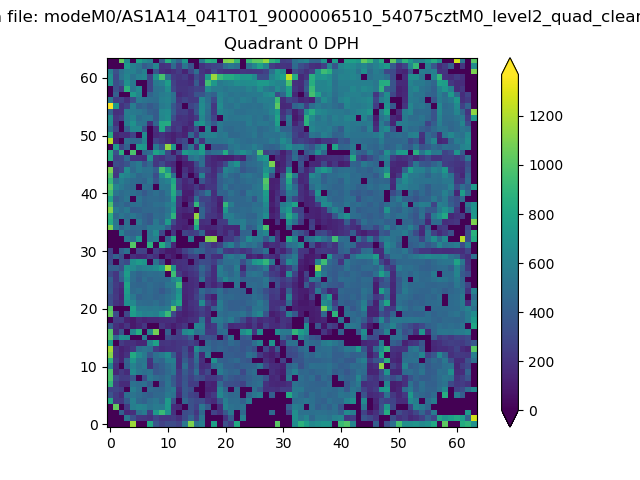 |
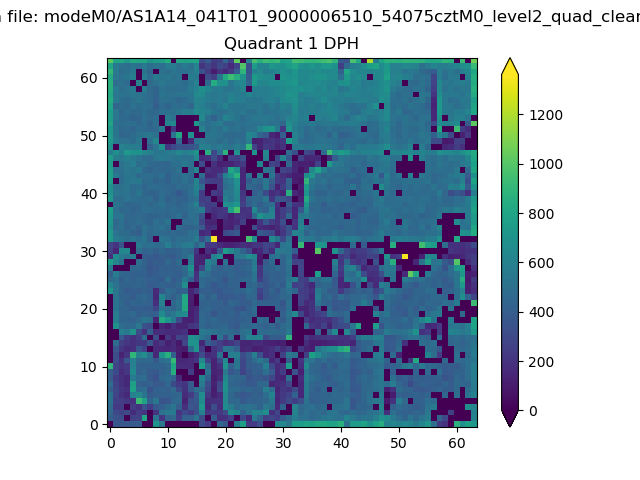 |
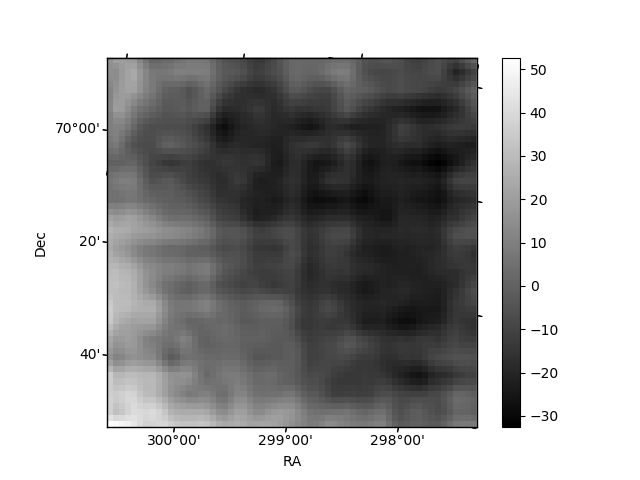
Quadrant B |
|---|---|---|---|
| Quadrant D | 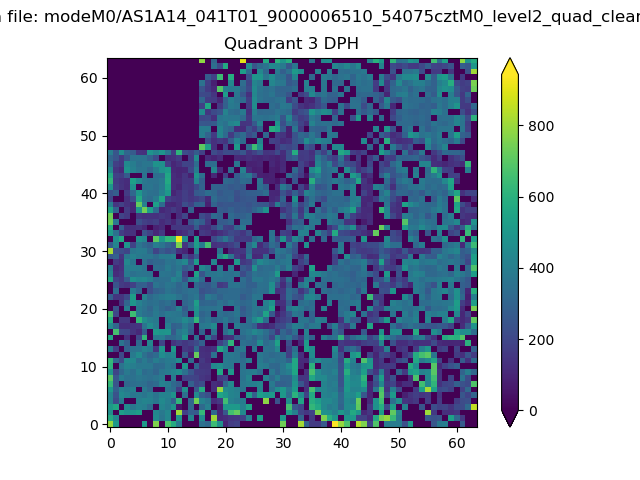 |
 |
Quadrant C |
| Plot type | Count rate plots | Images |
|---|---|---|
| Comparison with Poisson distribution Blue bars denote a histogram of data divided into 1 sec bins. Red curve is a Poisson curve with rate = median count rate of data. |
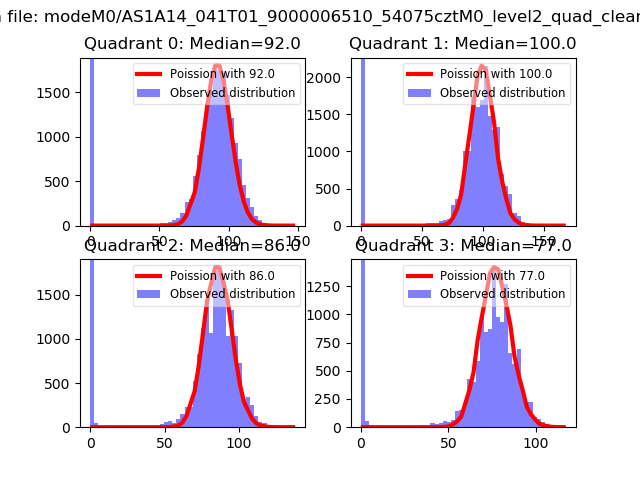 |
 |
| Quadrant-wise count rates Data is divided into 100 sec bins |
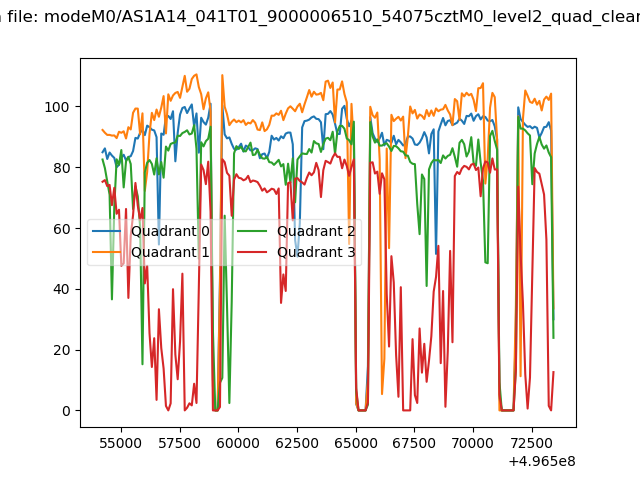 |
|
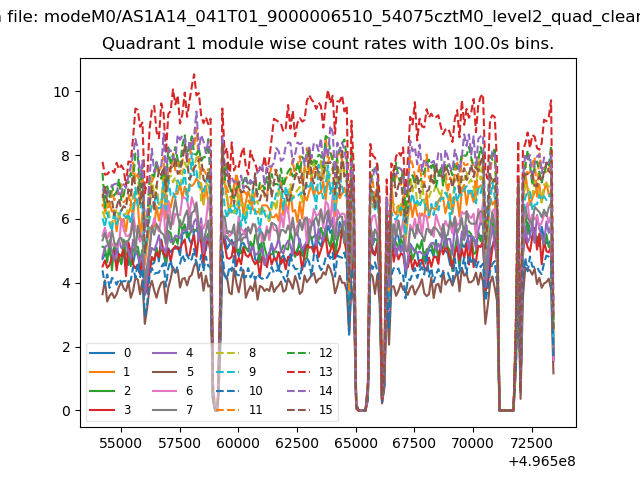
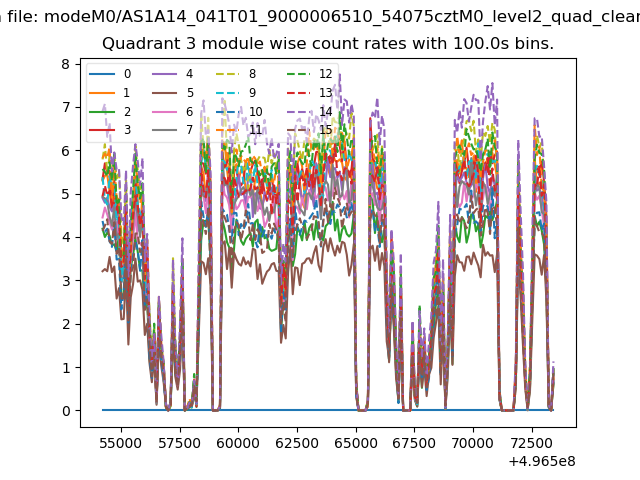
| Module-wise count rates for Quadrant A Data is divided into 100 sec bins |
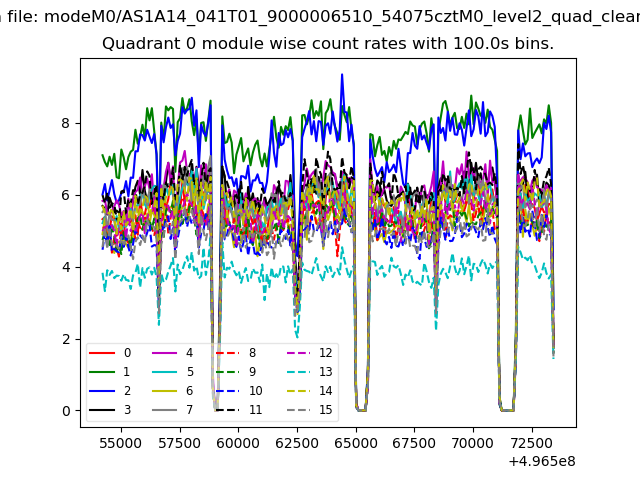 |
 |
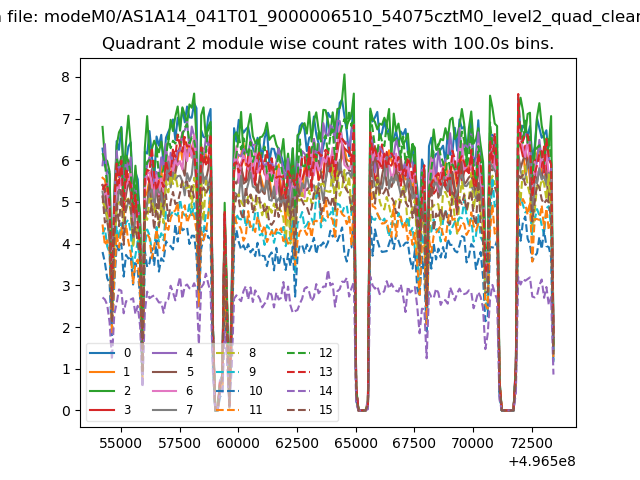
| Module-wise count rates for Quadrant B Data is divided into 100 sec bins |
 |
 |
| Module-wise count rates for Quadrant C Data is divided into 100 sec bins |
 |
 |
| Module-wise count rates for Quadrant D Data is divided into 100 sec bins |
 |
 |
| Parameter | Plot |
|---|---|
| CZT HV Monitor | 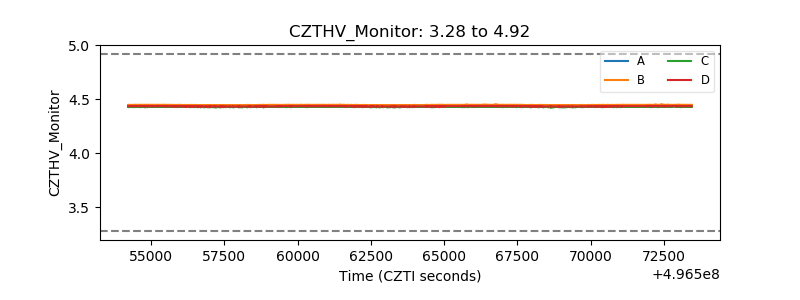 |
| D_VDD | 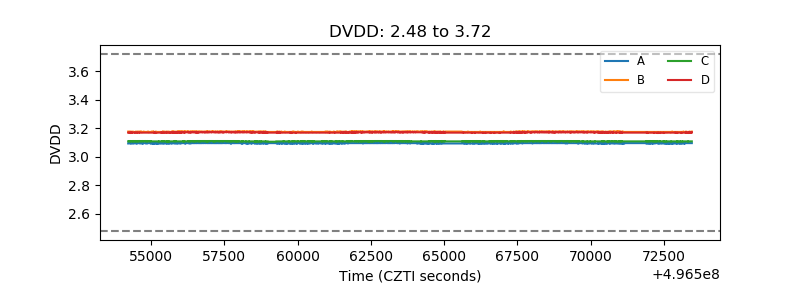 |
| Temperature 1 | 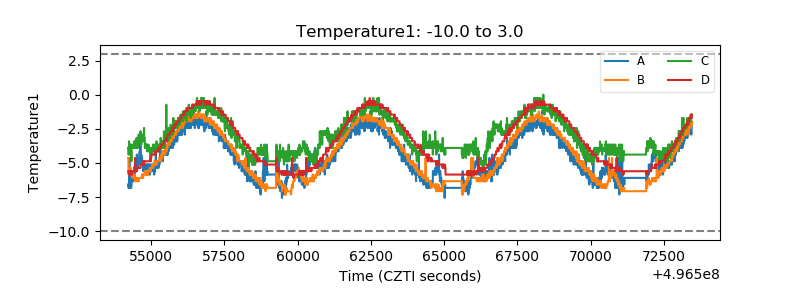 |
| Veto HV Monitor | 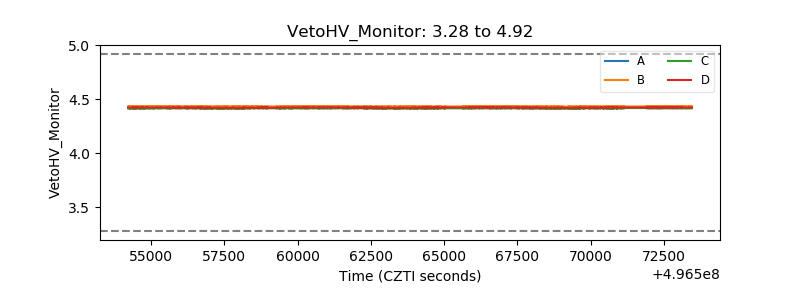 |
| Veto LLD | 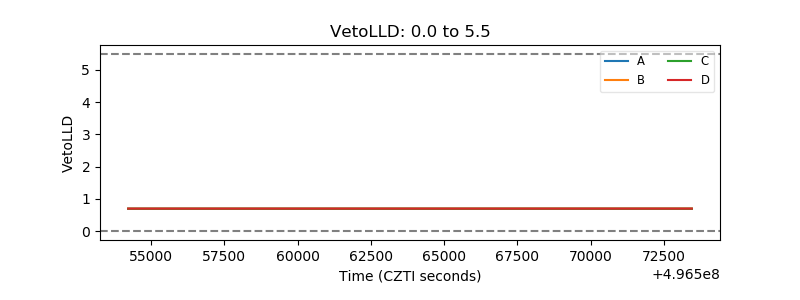 |
| Alpha Counter | 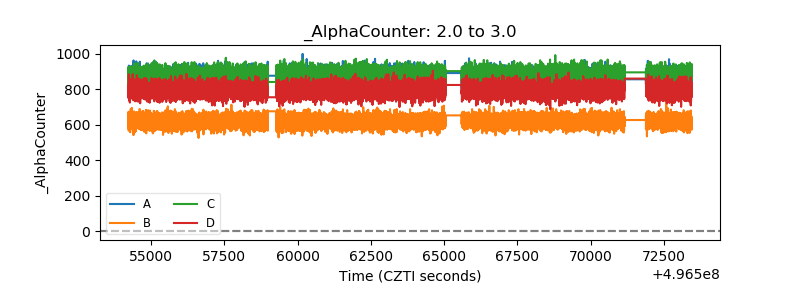 |
| _CPM_Rate | 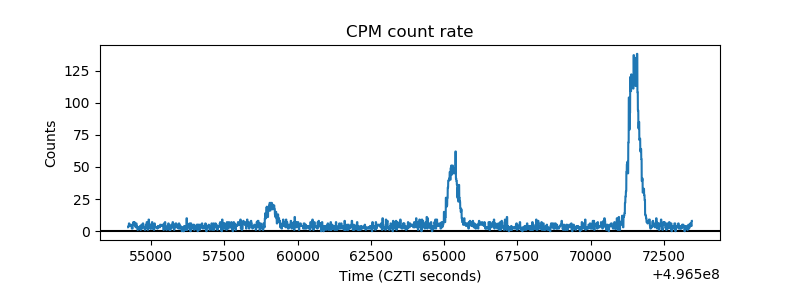 |
| CZT Counter | 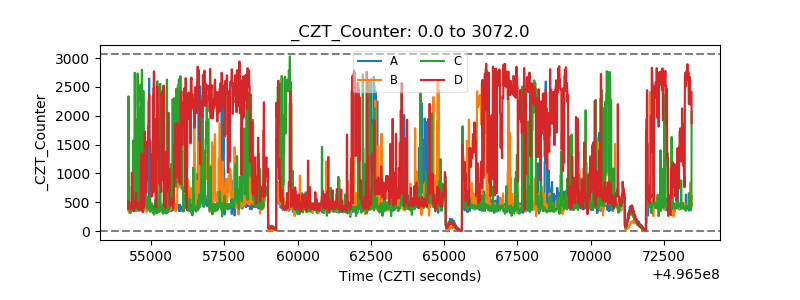 |
| +2.5 Volts monitor | 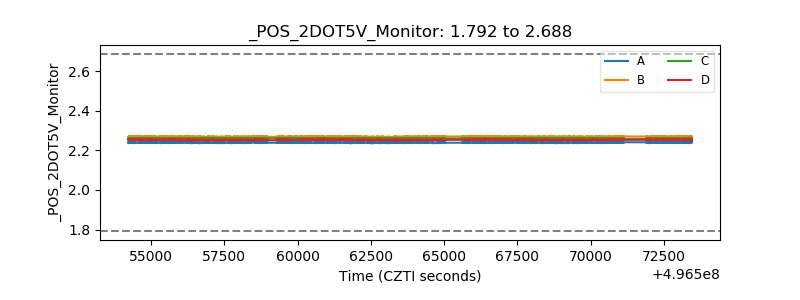 |
| +5 Volts monitor | 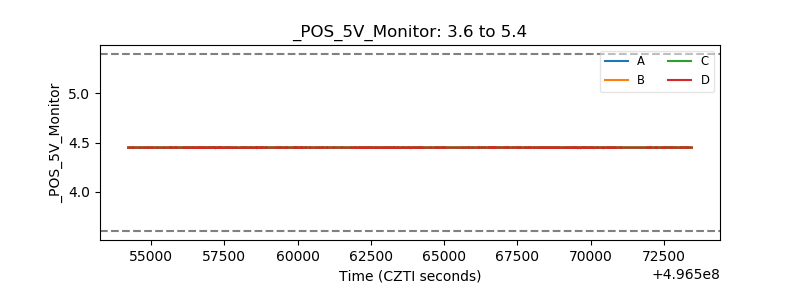 |
| _ROLL_ROT | 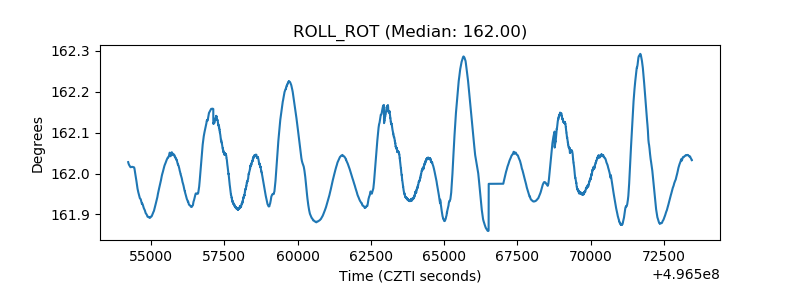 |
| _Roll_DEC | 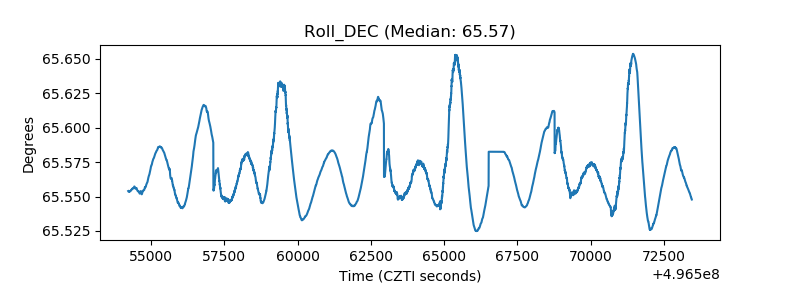 |
| _Roll_RA | 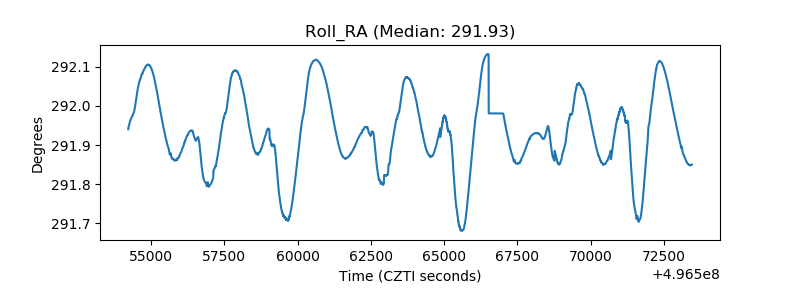 |
| Veto Counter | 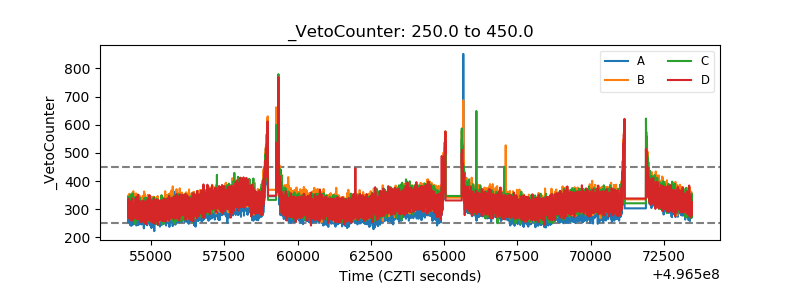 |