| Param | Original file | Final file |
|---|---|---|
| Filename | modeM0/AS1A14_041T01_9000006510_54078cztM0_level2.fits | modeM0/AS1A14_041T01_9000006510_54078cztM0_level2_quad_clean.evt |
| Size (bytes) | 463,498,560 | 92,283,840 |
| Size | 442.0 MB | 88.0 MB |
| Events in quadrant A | 3,711,103 | 607,529 |
| Events in quadrant B | 3,444,705 | 672,627 |
| Events in quadrant C | 3,995,065 | 562,818 |
| Events in quadrant D | 5,512,164 | 507,357 |
| Mode M9 | |||
|---|---|---|---|
| Quadrant | BADHDUFLAG | Total packets | Discarded packets |
| A | 0 | 10 | 0 |
| B | 0 | 10 | 0 |
| C | 0 | 10 | 0 |
| D | 0 | 10 | 0 |
| Mode SS | |||
|---|---|---|---|
| Quadrant | BADHDUFLAG | Total packets | Discarded packets |
| A | 0 | 130 | 0 |
| B | 0 | 130 | 0 |
| C | 0 | 130 | 0 |
| D | 0 | 130 | 0 |
| Mode M0 | |||
|---|---|---|---|
| Quadrant | BADHDUFLAG | Total packets | Discarded packets |
| A | 0 | 15515 | 1 |
| B | 0 | 14678 | 1 |
| C | 0 | 16412 | 8 |
| D | 0 | 20826 | 1 |
| Quadrant | Total seconds | Saturated seconds | Saturation percentage |
|---|---|---|---|
| A | 6360 | 286 | 4.496855% |
| B | 6360 | 136 | 2.138365% |
| C | 6359 | 266 | 4.183048% |
| D | 6360 | 565 | 8.883648% |
Noise dominated data is calculated using 1-second bins in cleaned event files. If a bin has >2000 counts, and if more than 50% of those come from <1% of pixels, then it is considered to be noise-dominated and hence unusable.
| Quadrant | # 1 sec bins | Bins with >0 counts | Bins with >2000 counts | High rate bins dominated by noise | Noise dominated (total time) | Noise dominated (detector-on time) | Marked lightcurve |
|---|---|---|---|---|---|---|---|
| A | 7375 | 6361 | 222 | 222 | 3.01% | 3.49% | 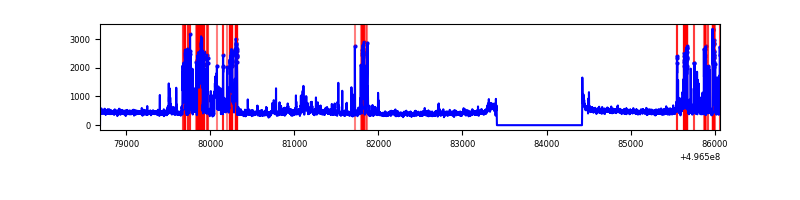 |
| B | 7375 | 6361 | 58 | 58 | 0.79% | 0.91% | 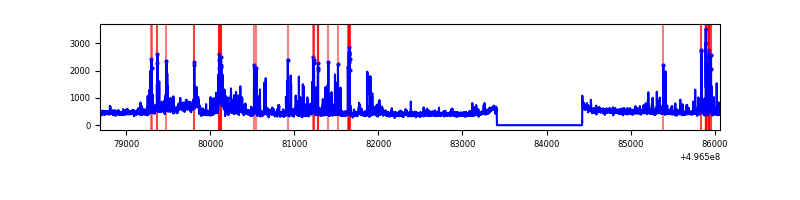 |
| C | 7374 | 6360 | 185 | 185 | 2.51% | 2.91% | 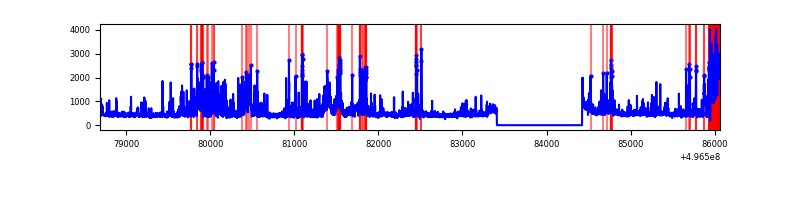 |
| D | 7375 | 6361 | 573 | 573 | 7.77% | 9.01% | 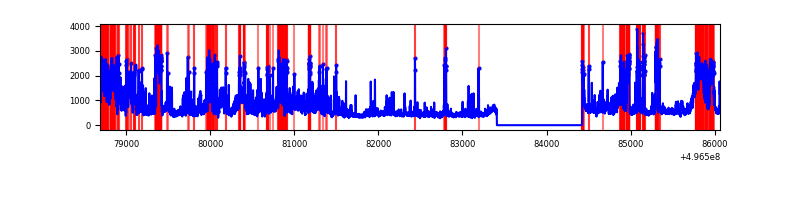 |
Top three noisy pixels from each quadrant. If the there are fewer than three noisy pixels in the level2.evt file, extra rows are filled as -1
| Pixel properties | Quadrant properties | ||||||
|---|---|---|---|---|---|---|---|
| Quadrant | DetID | PixID | Counts | Sigma | Mean | Median | Sigma |
| A | 15 | 174 | 919427 | 5507.48 | 672 | 655 | 166.8 |
| A | 10 | 253 | 87318 | 519.49 | 672 | 655 | 166.8 |
| A | 4 | 3 | 18833 | 108.97 | 672 | 655 | 166.8 |
| B | 5 | 250 | 211681 | 1466.82 | 672 | 649 | 143.9 |
| B | 0 | 213 | 169304 | 1172.27 | 672 | 649 | 143.9 |
| B | 5 | 236 | 166498 | 1152.77 | 672 | 649 | 143.9 |
| C | 13 | 3 | 825343 | 4637.66 | 646 | 640 | 177.8 |
| C | 9 | 38 | 230829 | 1294.45 | 646 | 640 | 177.8 |
| C | 1 | 241 | 71734 | 399.79 | 646 | 640 | 177.8 |
| D | 8 | 176 | 1685096 | 9146.1 | 639 | 609 | 184.2 |
| D | 2 | 172 | 966055 | 5241.99 | 639 | 609 | 184.2 |
| D | 3 | 12 | 118593 | 640.61 | 639 | 609 | 184.2 |
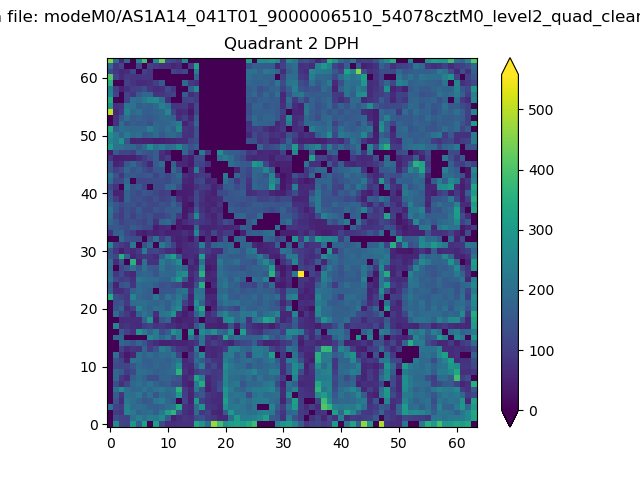
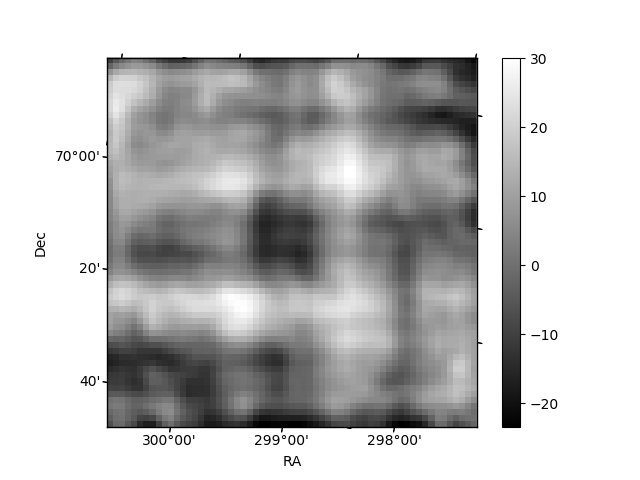
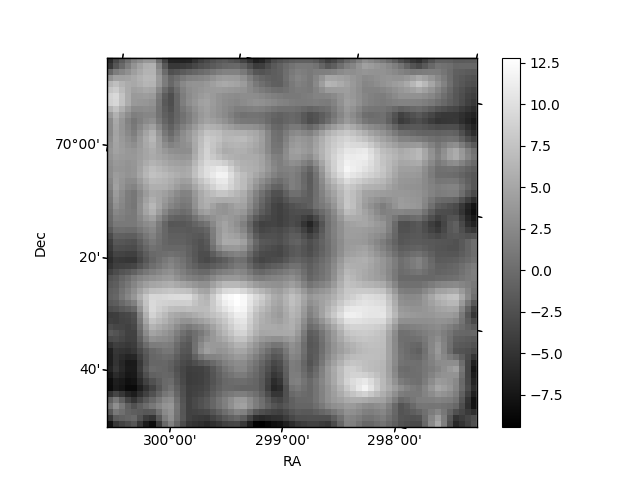
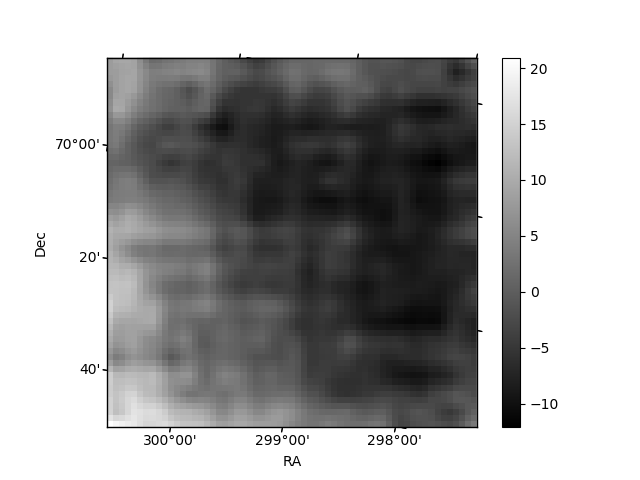
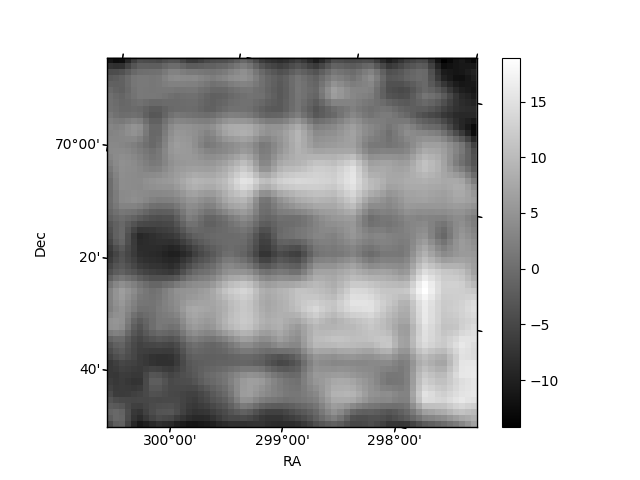
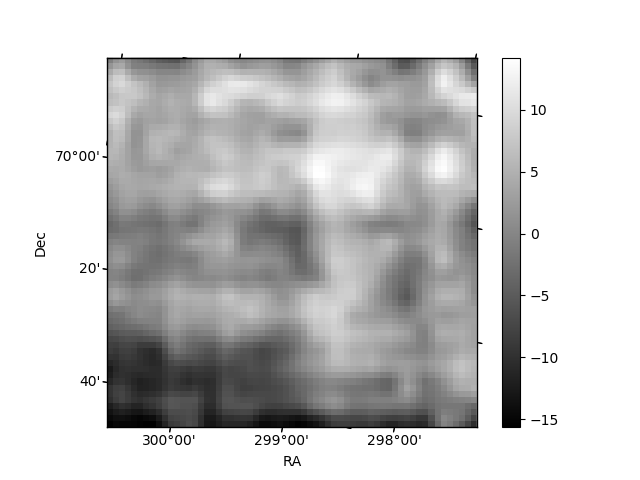
Histogram calculated using DETX and DETY for each event in the final _common_clean file
| Quadrant A | 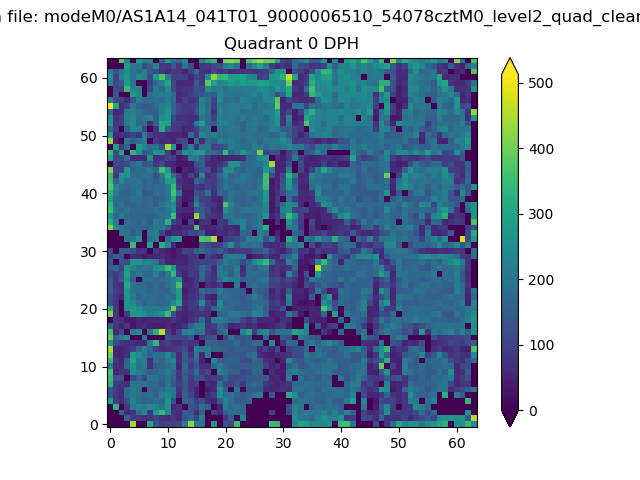 |
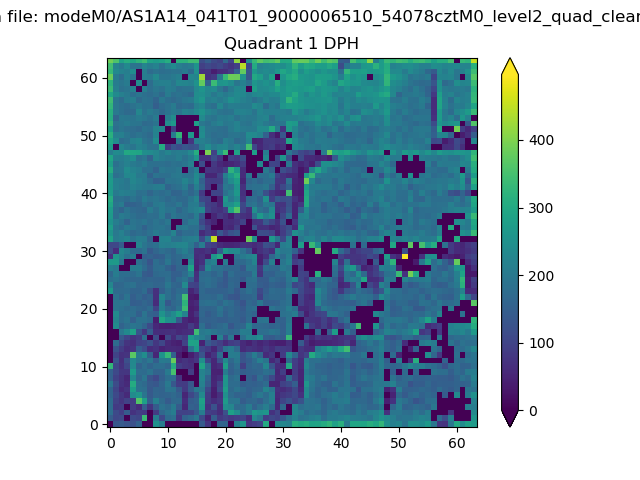 |
Quadrant B |
|---|---|---|---|
| Quadrant D | 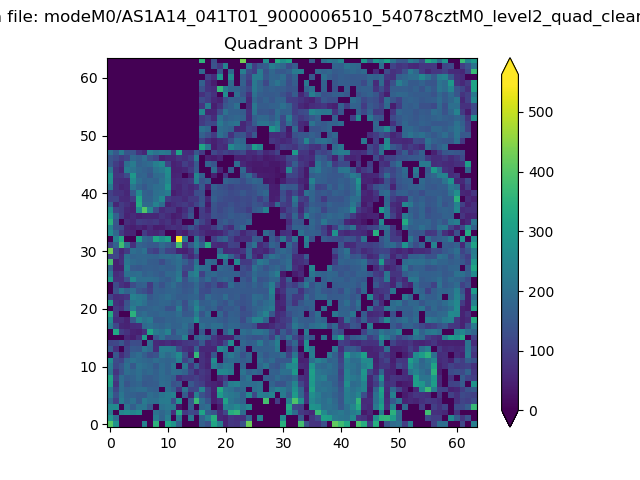 |
 |
Quadrant C |
| Plot type | Count rate plots | Images |
|---|---|---|
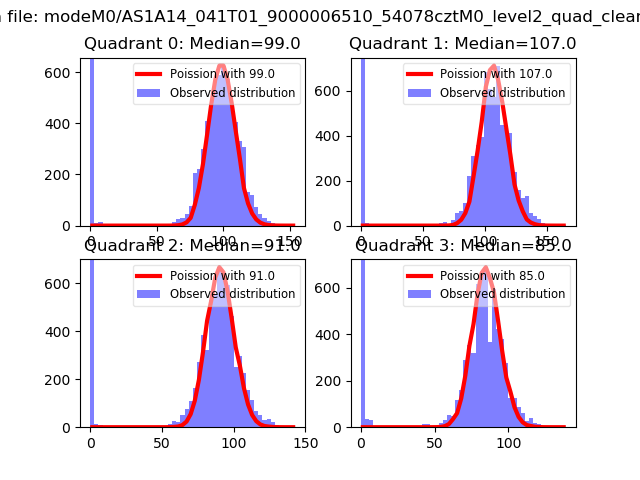
| Comparison with Poisson distribution Blue bars denote a histogram of data divided into 1 sec bins. Red curve is a Poisson curve with rate = median count rate of data. |
 |
 |
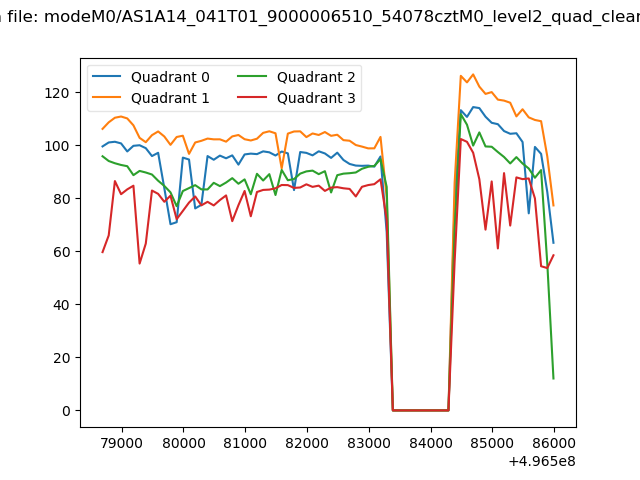
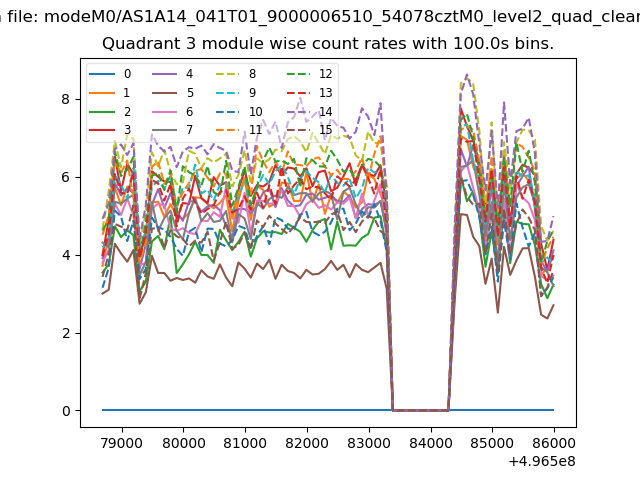
| Quadrant-wise count rates Data is divided into 100 sec bins |
 |
|
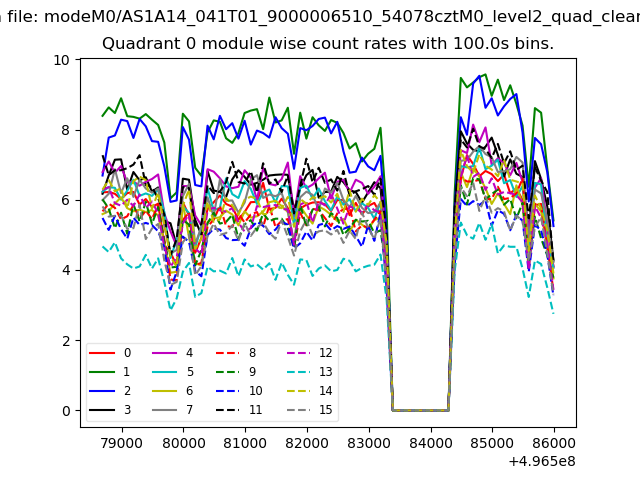
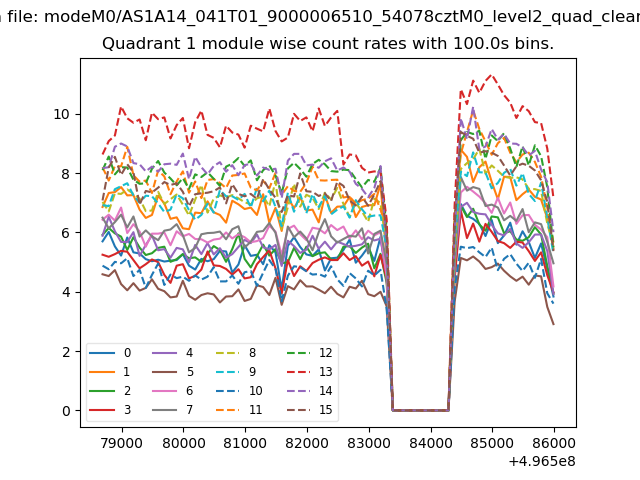
| Module-wise count rates for Quadrant A Data is divided into 100 sec bins |
 |
 |
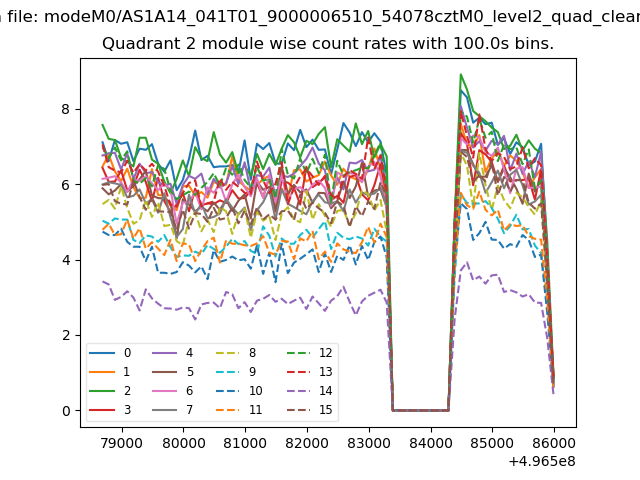
| Module-wise count rates for Quadrant B Data is divided into 100 sec bins |
 |
 |
| Module-wise count rates for Quadrant C Data is divided into 100 sec bins |
 |
 |
| Module-wise count rates for Quadrant D Data is divided into 100 sec bins |
 |
 |
| Parameter | Plot |
|---|---|
| CZT HV Monitor | 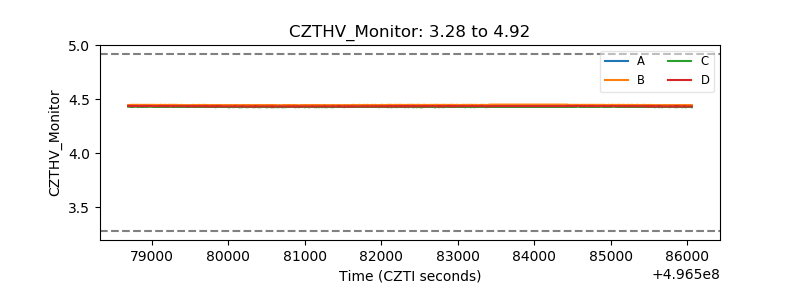 |
| D_VDD | 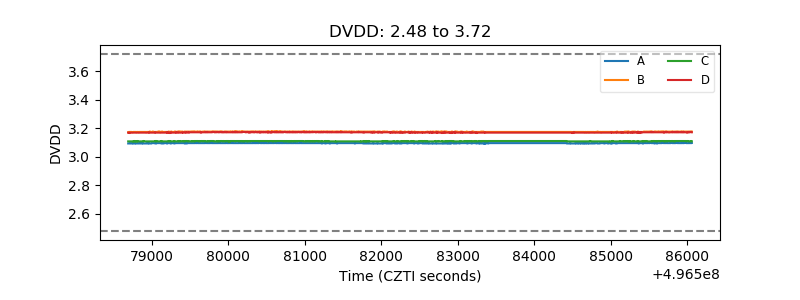 |
| Temperature 1 | 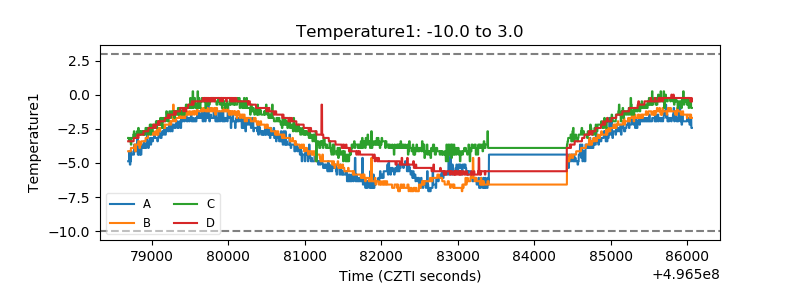 |
| Veto HV Monitor |  |
| Veto LLD | 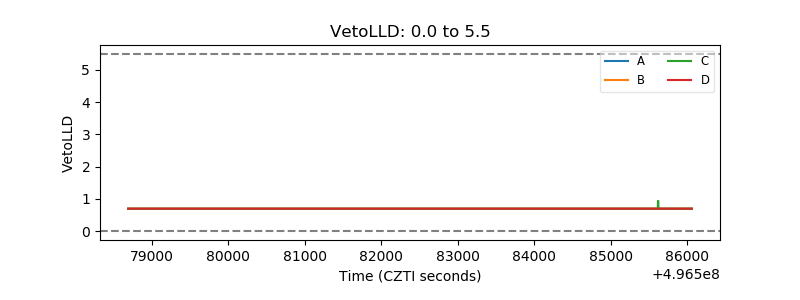 |
| Alpha Counter | 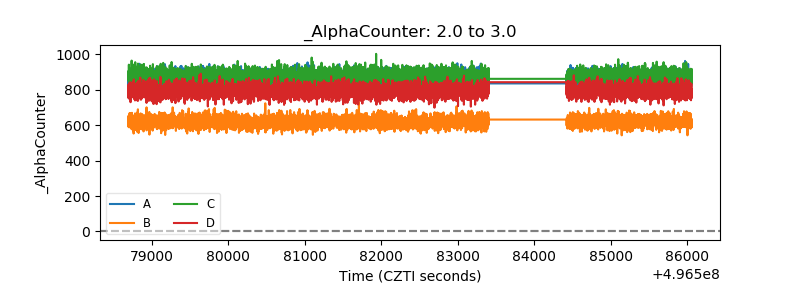 |
| _CPM_Rate | 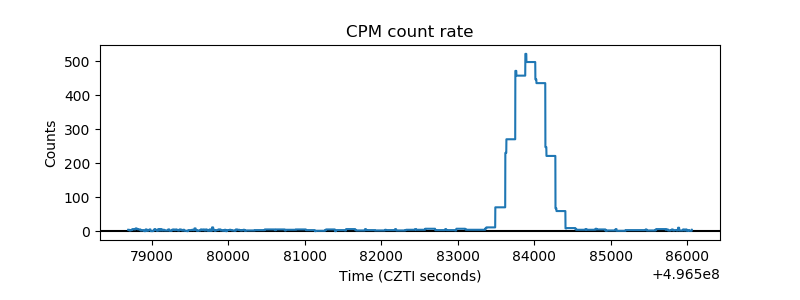 |
| CZT Counter | 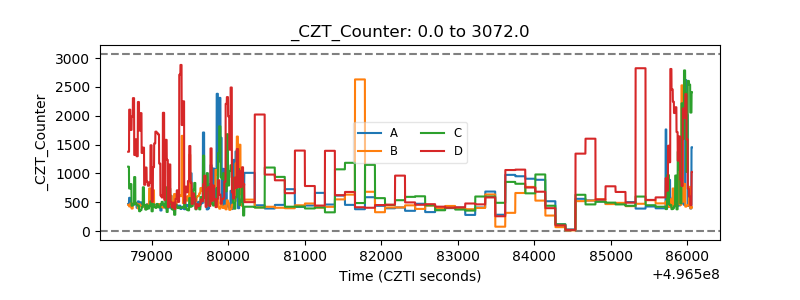 |
| +2.5 Volts monitor |  |
| +5 Volts monitor |  |
| _ROLL_ROT | 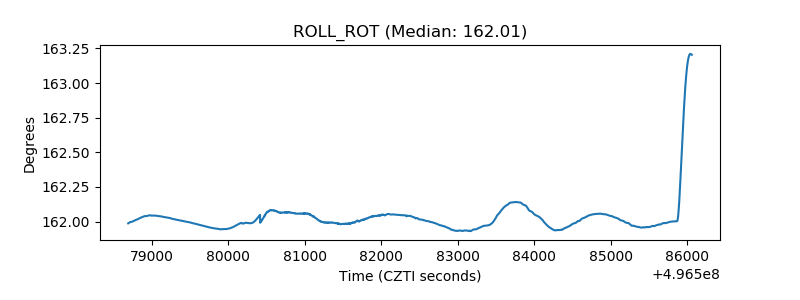 |
| _Roll_DEC | 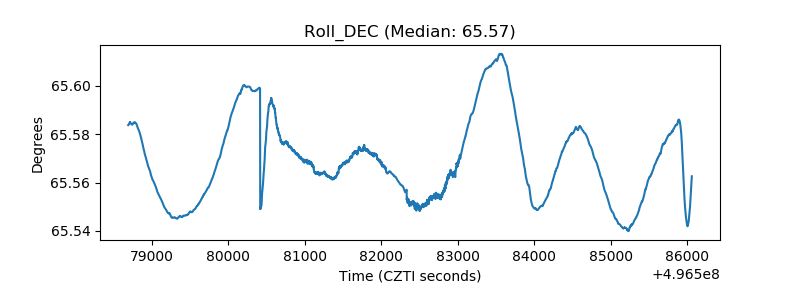 |
| _Roll_RA | 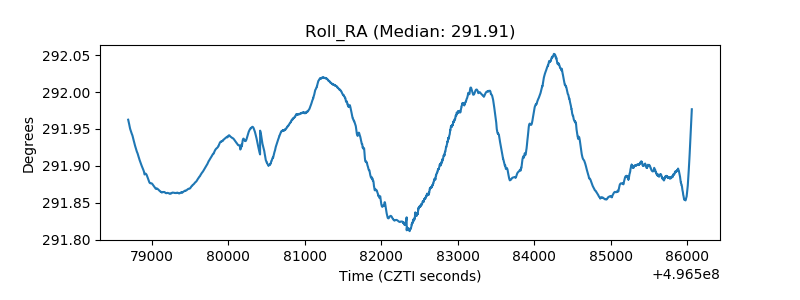 |
| Veto Counter | 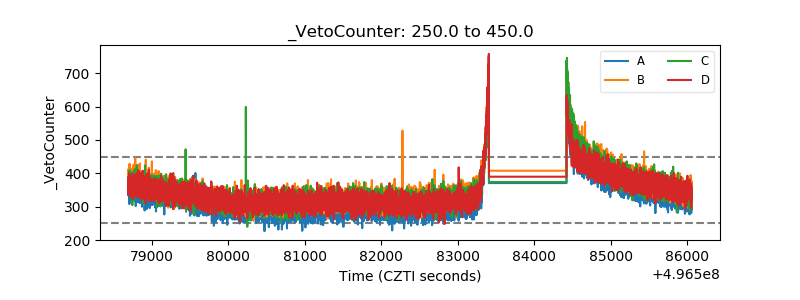 |