| Param | Original file | Final file |
|---|---|---|
| Filename | modeM0/AS1A14_041T01_9000006510_54080cztM0_level2.fits | modeM0/AS1A14_041T01_9000006510_54080cztM0_level2_quad_clean.evt |
| Size (bytes) | 565,525,440 | 91,157,760 |
| Size | 539.3 MB | 86.9 MB |
| Events in quadrant A | 3,596,116 | 630,571 |
| Events in quadrant B | 7,025,249 | 554,067 |
| Events in quadrant C | 4,387,659 | 584,770 |
| Events in quadrant D | 5,432,480 | 547,847 |
| Mode M9 | |||
|---|---|---|---|
| Quadrant | BADHDUFLAG | Total packets | Discarded packets |
| A | 0 | 11 | 0 |
| B | 0 | 11 | 0 |
| C | 0 | 11 | 0 |
| D | 0 | 11 | 0 |
| Mode SS | |||
|---|---|---|---|
| Quadrant | BADHDUFLAG | Total packets | Discarded packets |
| A | 0 | 130 | 0 |
| B | 0 | 130 | 0 |
| C | 0 | 130 | 0 |
| D | 0 | 130 | 0 |
| Mode M0 | |||
|---|---|---|---|
| Quadrant | BADHDUFLAG | Total packets | Discarded packets |
| A | 0 | 15137 | 1 |
| B | 0 | 25209 | 1 |
| C | 0 | 17383 | 1 |
| D | 0 | 20604 | 1 |
| Quadrant | Total seconds | Saturated seconds | Saturation percentage |
|---|---|---|---|
| A | 6342 | 270 | 4.257332% |
| B | 6342 | 1595 | 25.149795% |
| C | 6342 | 357 | 5.629139% |
| D | 6343 | 378 | 5.959325% |
Noise dominated data is calculated using 1-second bins in cleaned event files. If a bin has >2000 counts, and if more than 50% of those come from <1% of pixels, then it is considered to be noise-dominated and hence unusable.
| Quadrant | # 1 sec bins | Bins with >0 counts | Bins with >2000 counts | High rate bins dominated by noise | Noise dominated (total time) | Noise dominated (detector-on time) | Marked lightcurve |
|---|---|---|---|---|---|---|---|
| A | 7512 | 6342 | 180 | 180 | 2.40% | 2.84% | 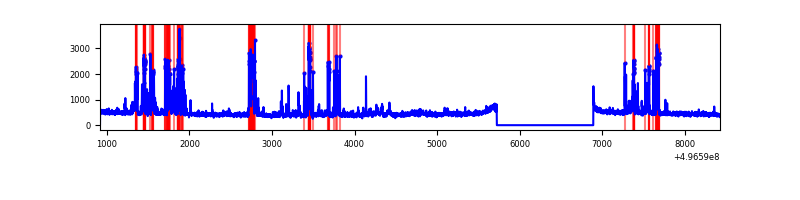 |
| B | 7512 | 6341 | 1313 | 1313 | 17.48% | 20.71% | 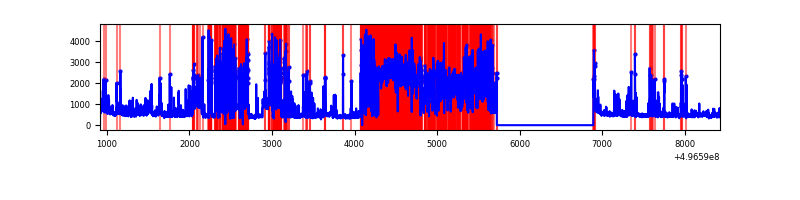 |
| C | 7512 | 6342 | 294 | 294 | 3.91% | 4.64% | 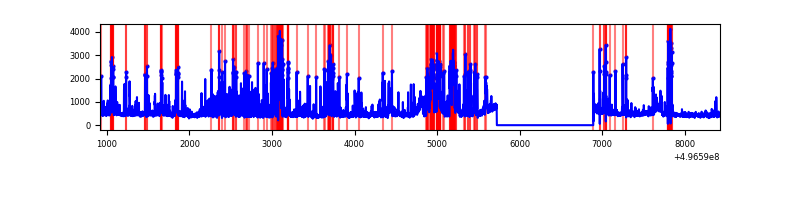 |
| D | 7513 | 6343 | 361 | 361 | 4.81% | 5.69% | 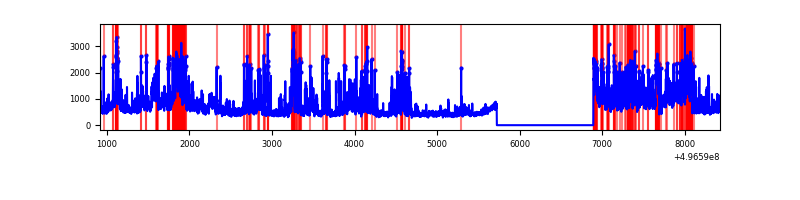 |
Top three noisy pixels from each quadrant. If the there are fewer than three noisy pixels in the level2.evt file, extra rows are filled as -1
| Pixel properties | Quadrant properties | ||||||
|---|---|---|---|---|---|---|---|
| Quadrant | DetID | PixID | Counts | Sigma | Mean | Median | Sigma |
| A | 15 | 174 | 740041 | 4391.77 | 682 | 663 | 168.4 |
| A | 12 | 15 | 69900 | 411.26 | 682 | 663 | 168.4 |
| A | 14 | 235 | 46416 | 271.76 | 682 | 663 | 168.4 |
| B | 5 | 236 | 4202971 | 33252.14 | 595 | 577 | 126.4 |
| B | 5 | 185 | 120415 | 948.24 | 595 | 577 | 126.4 |
| B | 0 | 213 | 103184 | 811.89 | 595 | 577 | 126.4 |
| C | 9 | 38 | 819230 | 4520.98 | 661 | 655 | 181.1 |
| C | 13 | 3 | 469740 | 2590.75 | 661 | 655 | 181.1 |
| C | 1 | 16 | 91597 | 502.27 | 661 | 655 | 181.1 |
| D | 2 | 172 | 1344183 | 7186.15 | 660 | 630 | 187.0 |
| D | 3 | 12 | 677665 | 3621.2 | 660 | 630 | 187.0 |
| D | 8 | 176 | 542907 | 2900.43 | 660 | 630 | 187.0 |
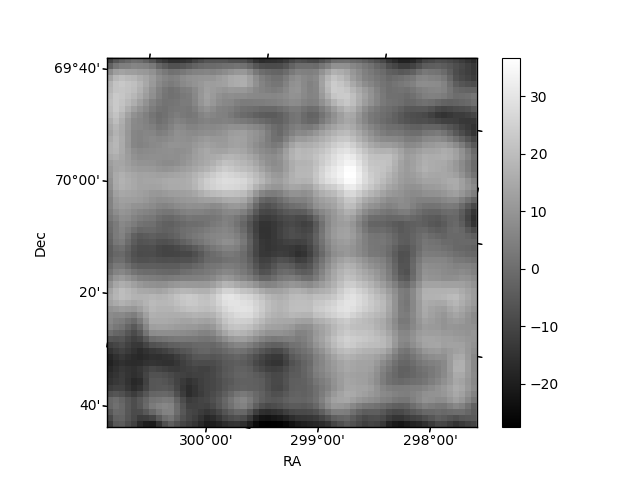
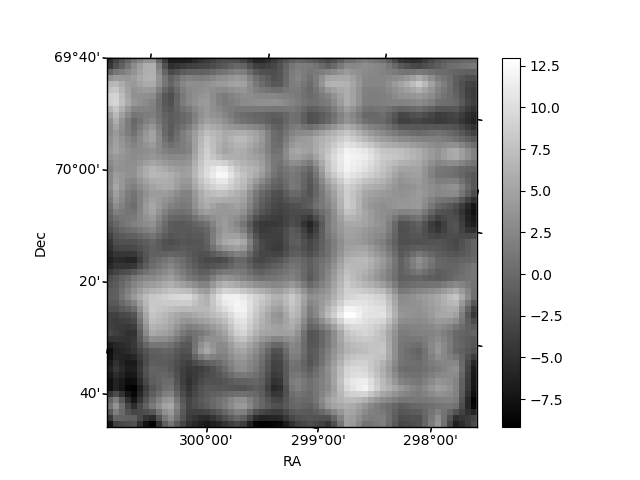
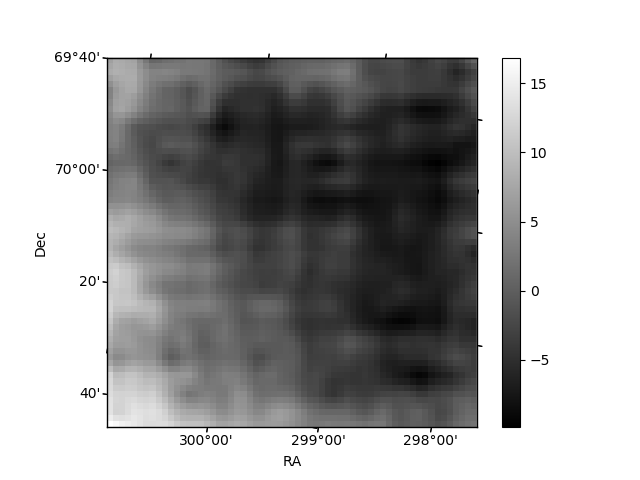
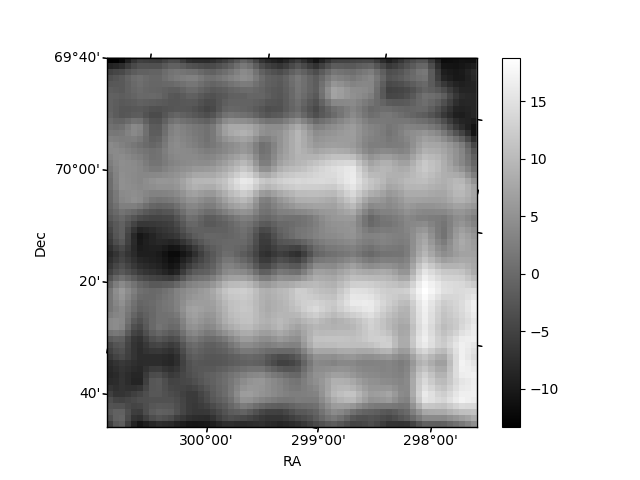
Histogram calculated using DETX and DETY for each event in the final _common_clean file
| Quadrant A | 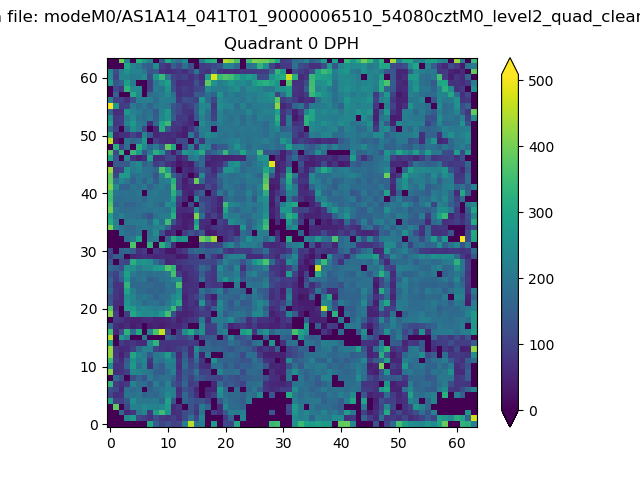 |
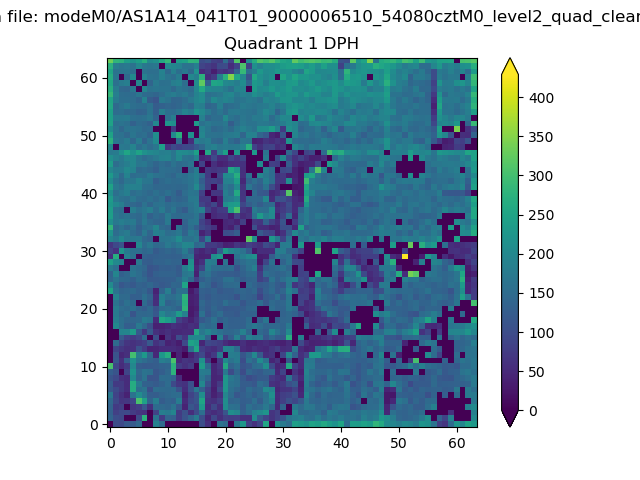 |
Quadrant B |
|---|---|---|---|
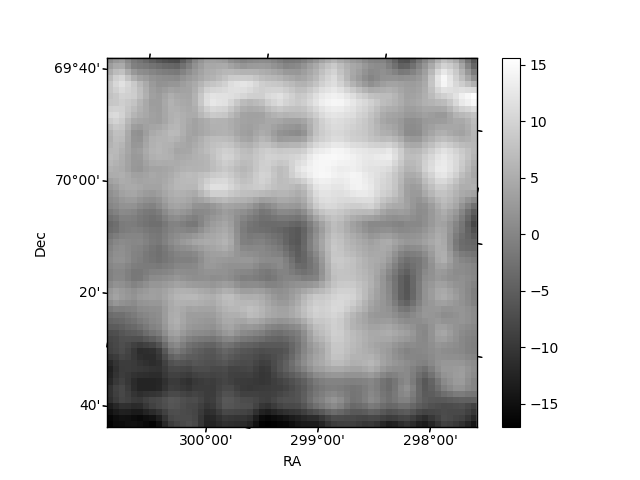
| Quadrant D | 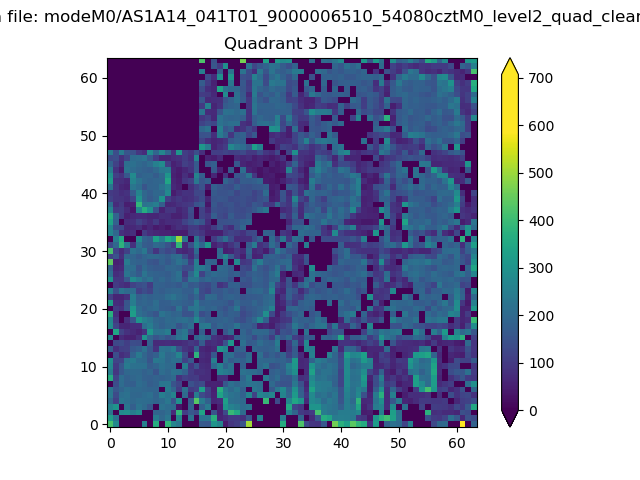 |
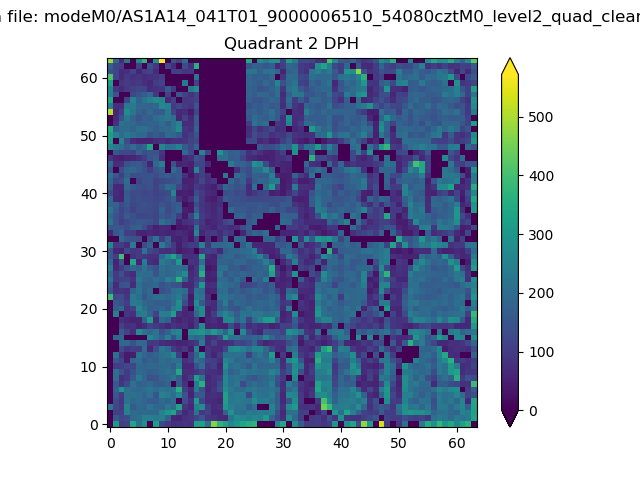 |
Quadrant C |
| Plot type | Count rate plots | Images |
|---|---|---|
| Comparison with Poisson distribution Blue bars denote a histogram of data divided into 1 sec bins. Red curve is a Poisson curve with rate = median count rate of data. |
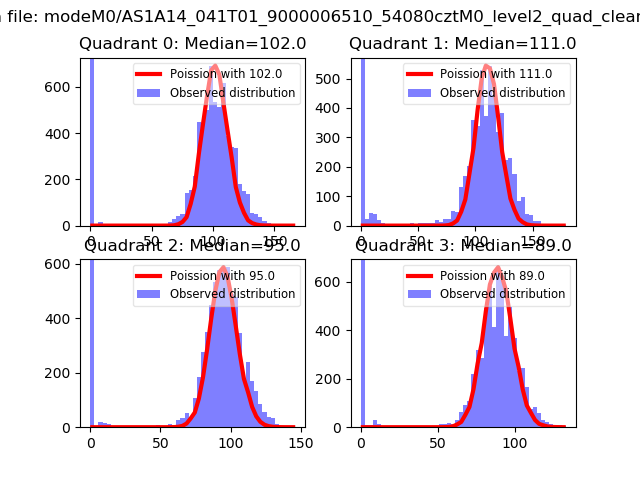 |
 |
| Quadrant-wise count rates Data is divided into 100 sec bins |
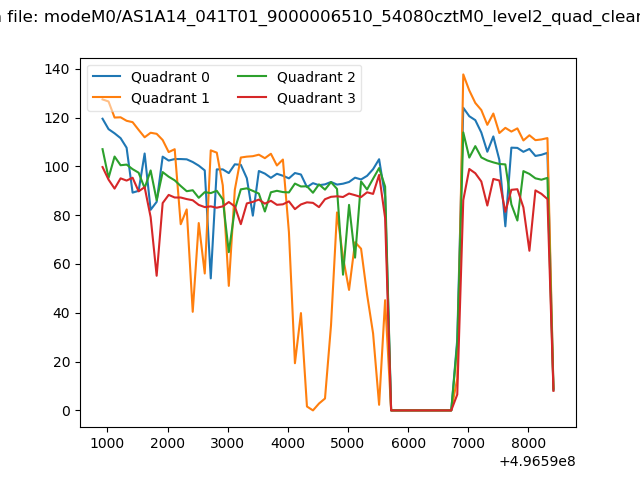 |
|
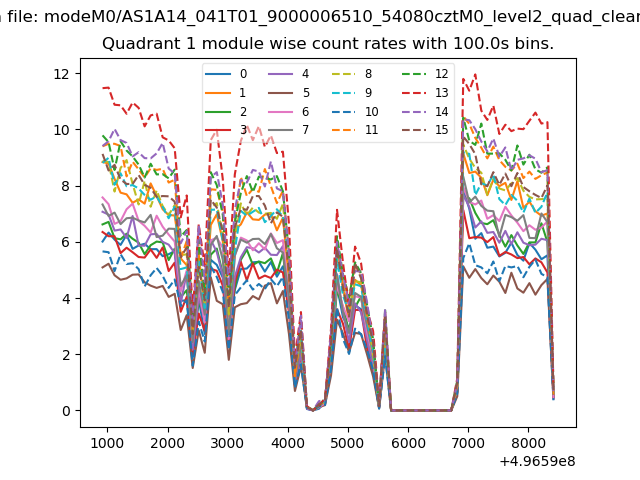
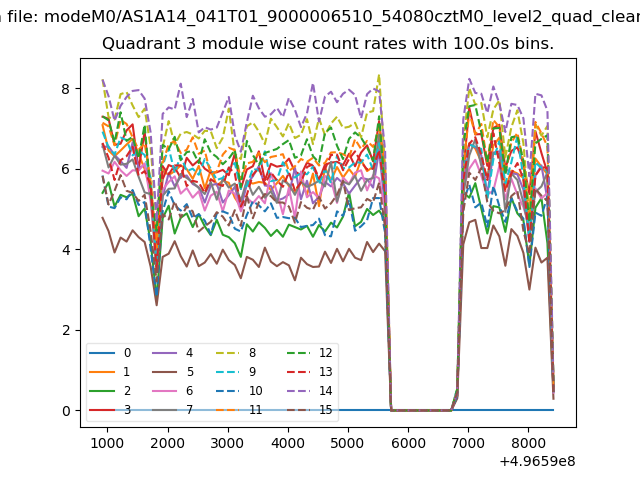
| Module-wise count rates for Quadrant A Data is divided into 100 sec bins |
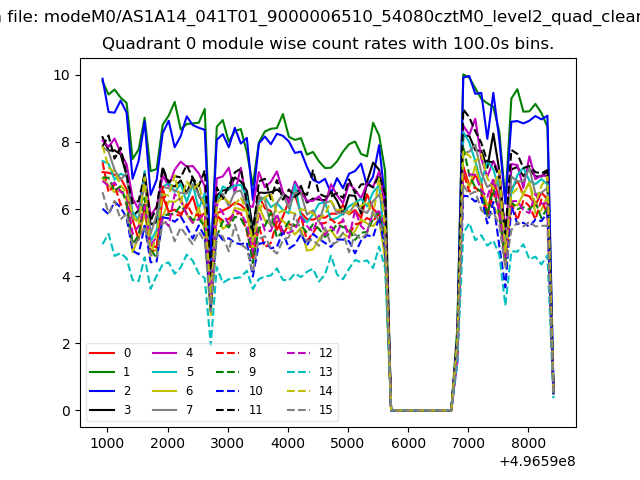 |
 |
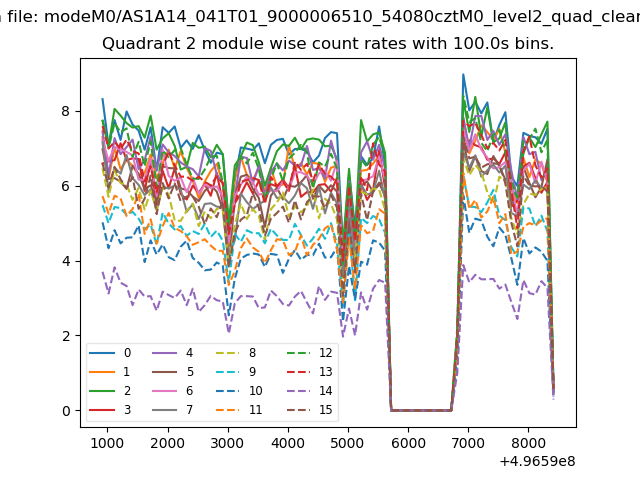
| Module-wise count rates for Quadrant B Data is divided into 100 sec bins |
 |
 |
| Module-wise count rates for Quadrant C Data is divided into 100 sec bins |
 |
 |
| Module-wise count rates for Quadrant D Data is divided into 100 sec bins |
 |
 |
| Parameter | Plot |
|---|---|
| CZT HV Monitor | 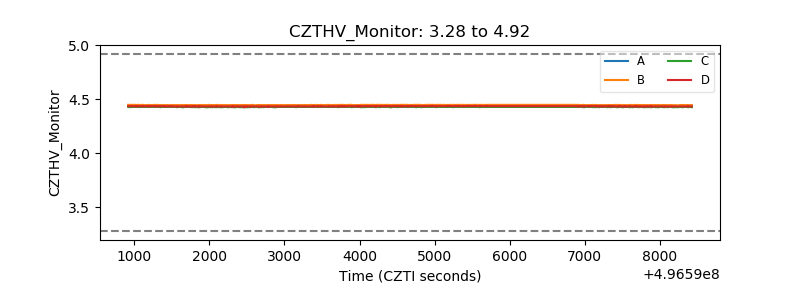 |
| D_VDD | 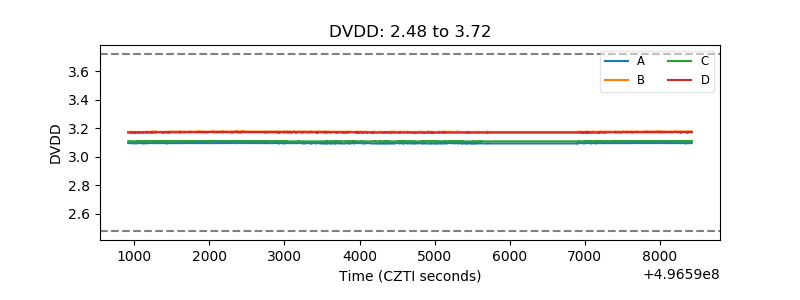 |
| Temperature 1 | 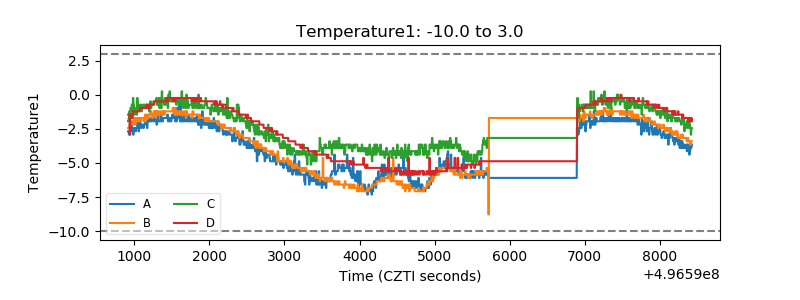 |
| Veto HV Monitor | 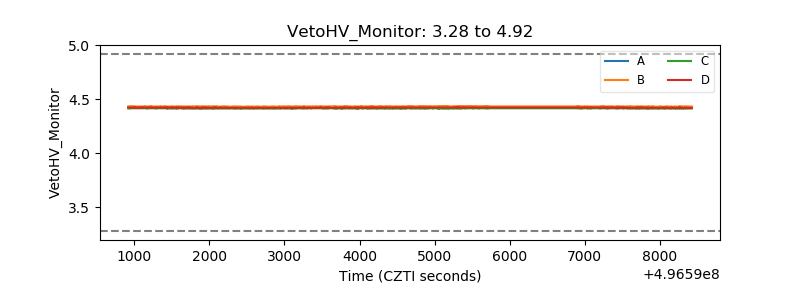 |
| Veto LLD | 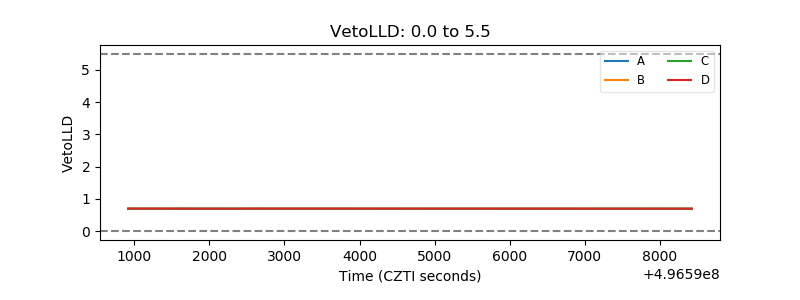 |
| Alpha Counter | 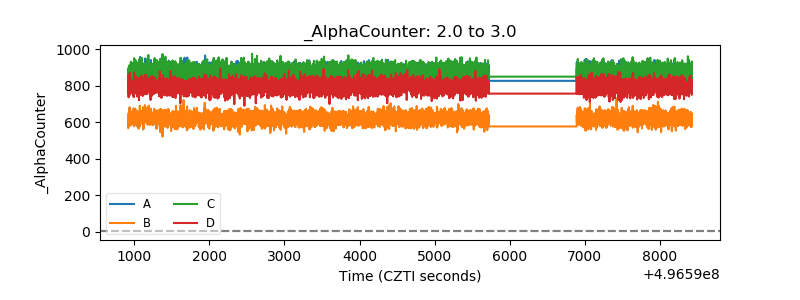 |
| _CPM_Rate | 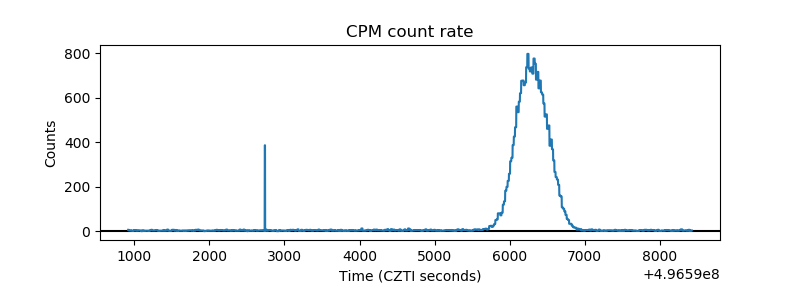 |
| CZT Counter | 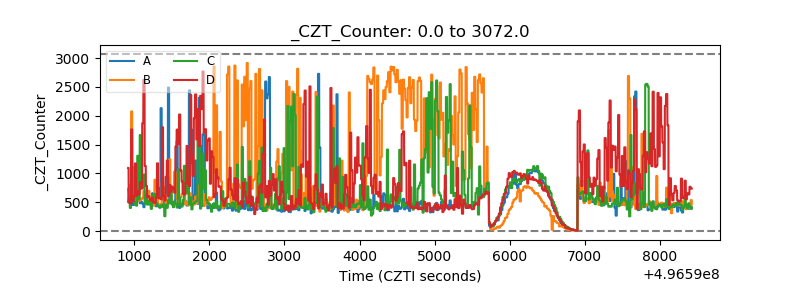 |
| +2.5 Volts monitor |  |
| +5 Volts monitor |  |
| _ROLL_ROT | 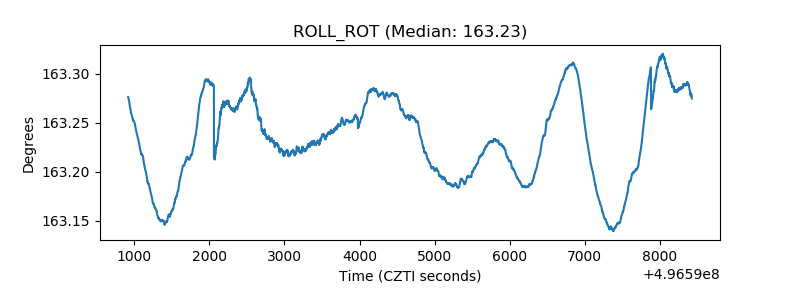 |
| _Roll_DEC | 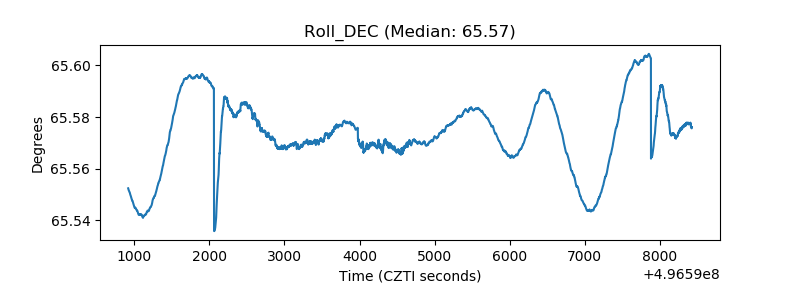 |
| _Roll_RA | 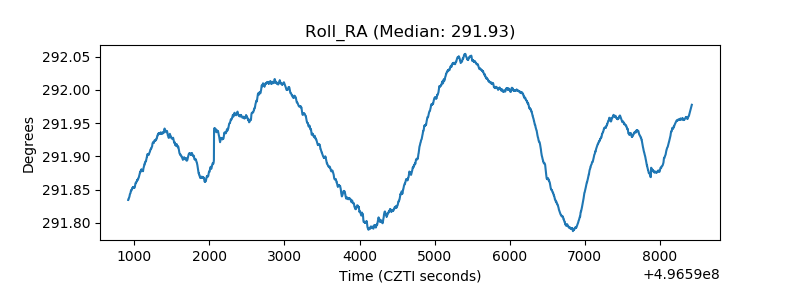 |
| Veto Counter | 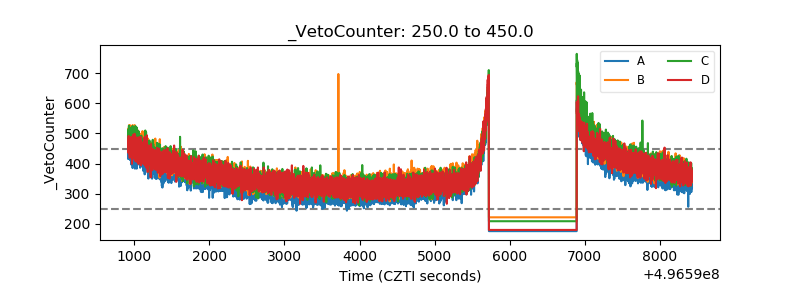 |