| Param | Original file | Final file |
|---|---|---|
| Filename | modeM0/AS1A14_041T01_9000006510_54081cztM0_level2.fits | modeM0/AS1A14_041T01_9000006510_54081cztM0_level2_quad_clean.evt |
| Size (bytes) | 547,104,960 | 95,057,280 |
| Size | 521.8 MB | 90.7 MB |
| Events in quadrant A | 3,233,201 | 656,551 |
| Events in quadrant B | 4,872,747 | 675,463 |
| Events in quadrant C | 3,936,633 | 607,150 |
| Events in quadrant D | 7,703,709 | 484,905 |
| Mode M9 | |||
|---|---|---|---|
| Quadrant | BADHDUFLAG | Total packets | Discarded packets |
| A | 0 | 12 | 0 |
| B | 0 | 12 | 0 |
| C | 0 | 13 | 0 |
| D | 0 | 13 | 0 |
| Mode SS | |||
|---|---|---|---|
| Quadrant | BADHDUFLAG | Total packets | Discarded packets |
| A | 0 | 132 | 0 |
| B | 0 | 132 | 0 |
| C | 0 | 132 | 0 |
| D | 0 | 132 | 0 |
| Mode M0 | |||
|---|---|---|---|
| Quadrant | BADHDUFLAG | Total packets | Discarded packets |
| A | 0 | 14449 | 2 |
| B | 0 | 19043 | 2 |
| C | 0 | 16254 | 3 |
| D | 0 | 27479 | 2 |
| Quadrant | Total seconds | Saturated seconds | Saturation percentage |
|---|---|---|---|
| A | 6514 | 138 | 2.118514% |
| B | 6514 | 574 | 8.811790% |
| C | 6513 | 294 | 4.514049% |
| D | 6513 | 1263 | 19.391985% |
Noise dominated data is calculated using 1-second bins in cleaned event files. If a bin has >2000 counts, and if more than 50% of those come from <1% of pixels, then it is considered to be noise-dominated and hence unusable.
| Quadrant | # 1 sec bins | Bins with >0 counts | Bins with >2000 counts | High rate bins dominated by noise | Noise dominated (total time) | Noise dominated (detector-on time) | Marked lightcurve |
|---|---|---|---|---|---|---|---|
| A | 7658 | 6514 | 75 | 75 | 0.98% | 1.15% | 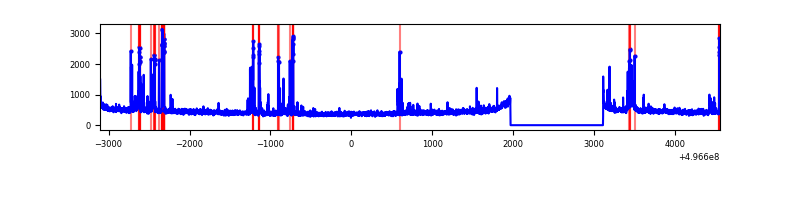 |
| B | 7658 | 6514 | 334 | 334 | 4.36% | 5.13% | 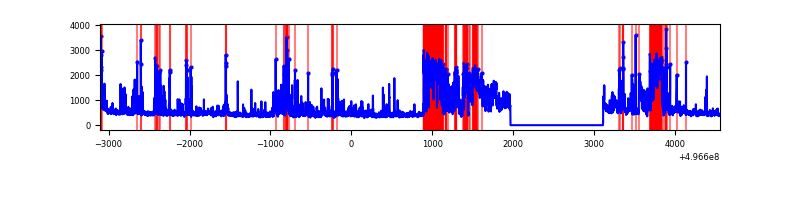 |
| C | 7657 | 6513 | 200 | 200 | 2.61% | 3.07% | 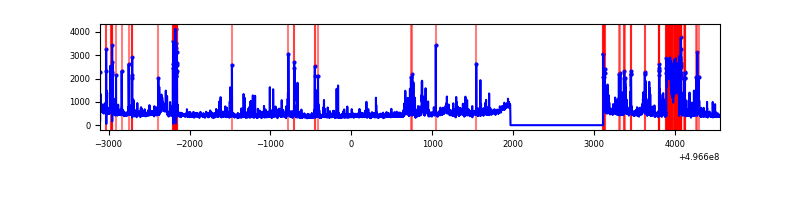 |
| D | 7656 | 6512 | 1033 | 1033 | 13.49% | 15.86% | 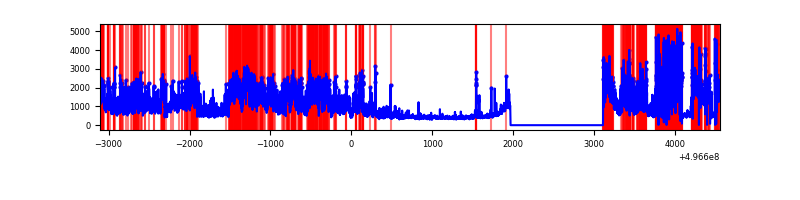 |
Top three noisy pixels from each quadrant. If the there are fewer than three noisy pixels in the level2.evt file, extra rows are filled as -1
| Pixel properties | Quadrant properties | ||||||
|---|---|---|---|---|---|---|---|
| Quadrant | DetID | PixID | Counts | Sigma | Mean | Median | Sigma |
| A | 15 | 174 | 292410 | 1668.48 | 706 | 689 | 174.8 |
| A | 0 | 8 | 56965 | 321.87 | 706 | 689 | 174.8 |
| A | 3 | 14 | 35918 | 201.49 | 706 | 689 | 174.8 |
| B | 5 | 236 | 1396777 | 9594.97 | 692 | 668 | 145.5 |
| B | 0 | 213 | 230281 | 1578.05 | 692 | 668 | 145.5 |
| B | 15 | 20 | 185617 | 1271.09 | 692 | 668 | 145.5 |
| C | 9 | 38 | 643014 | 3383.34 | 690 | 682 | 189.9 |
| C | 13 | 3 | 252274 | 1325.2 | 690 | 682 | 189.9 |
| C | 1 | 16 | 87718 | 458.44 | 690 | 682 | 189.9 |
| D | 2 | 172 | 2682235 | 15285.99 | 613 | 584 | 175.4 |
| D | 11 | 176 | 1348588 | 7683.92 | 613 | 584 | 175.4 |
| D | 8 | 176 | 686301 | 3908.74 | 613 | 584 | 175.4 |
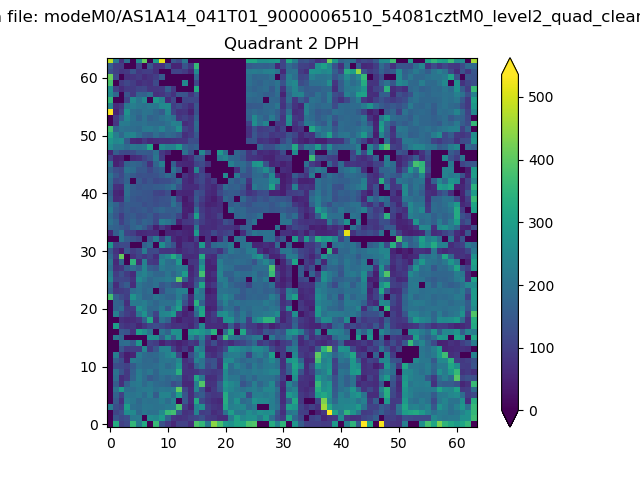
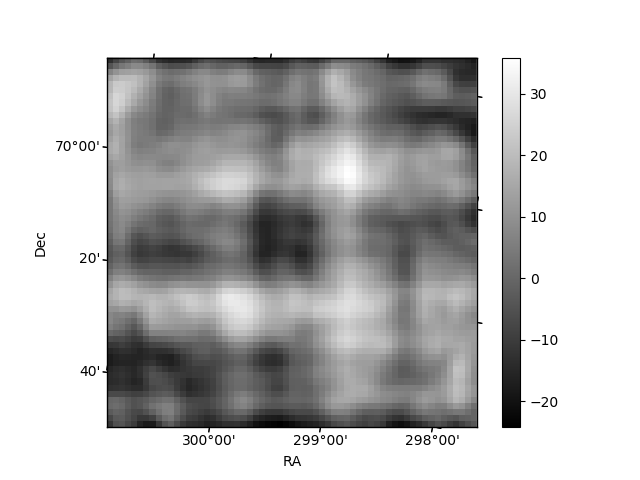
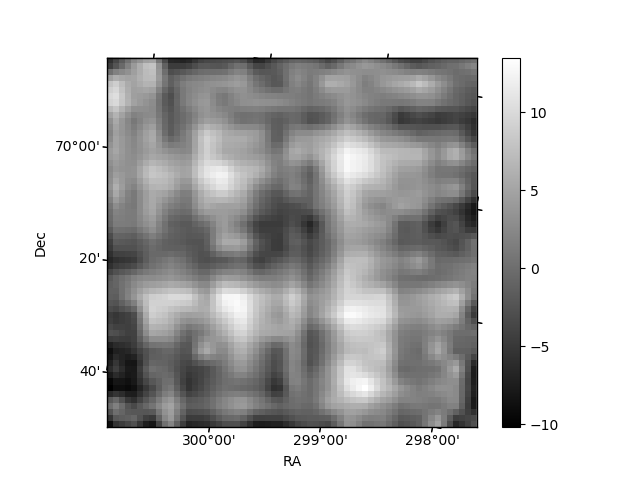
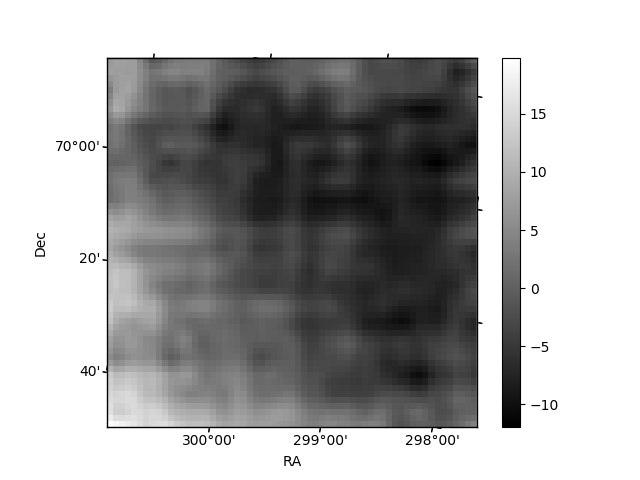
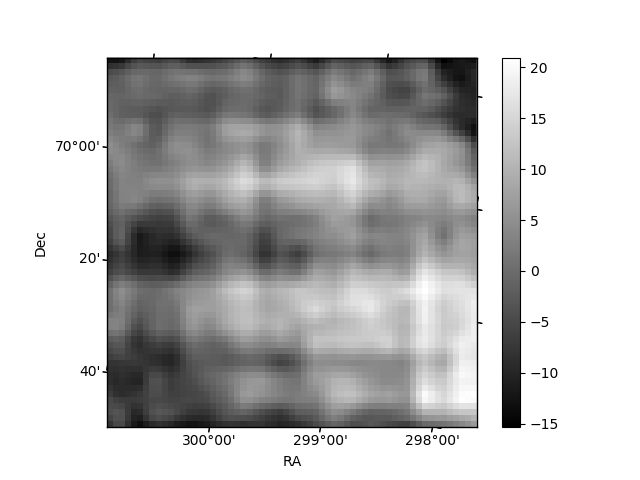
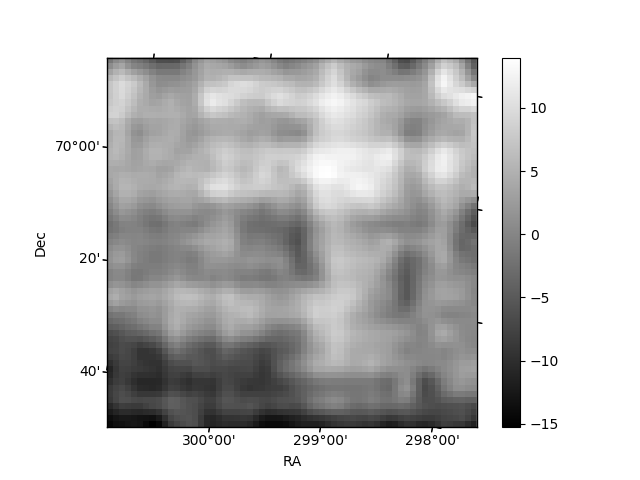
Histogram calculated using DETX and DETY for each event in the final _common_clean file
| Quadrant A | 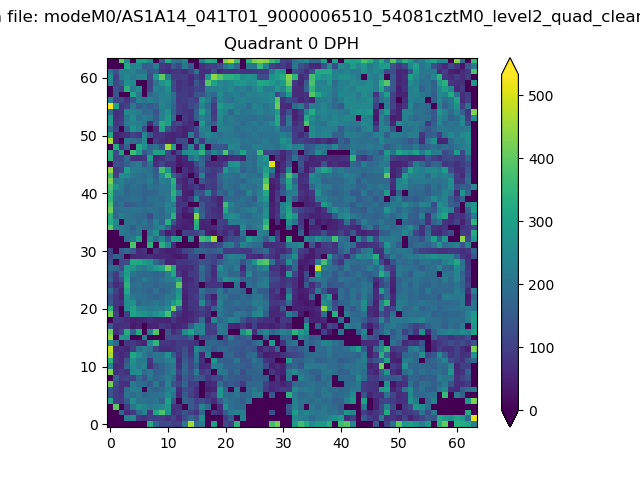 |
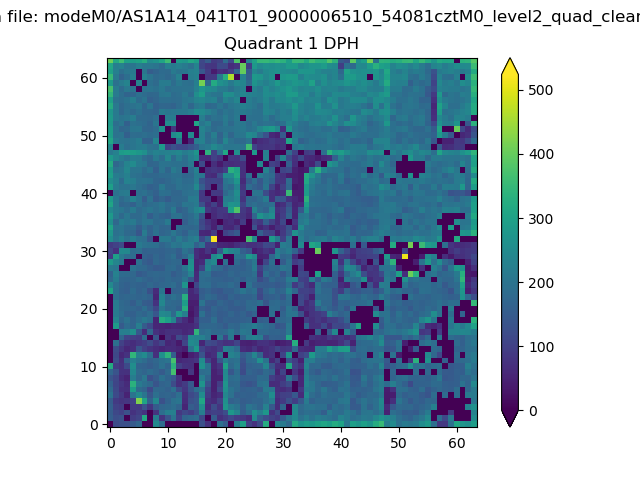 |
Quadrant B |
|---|---|---|---|
| Quadrant D | 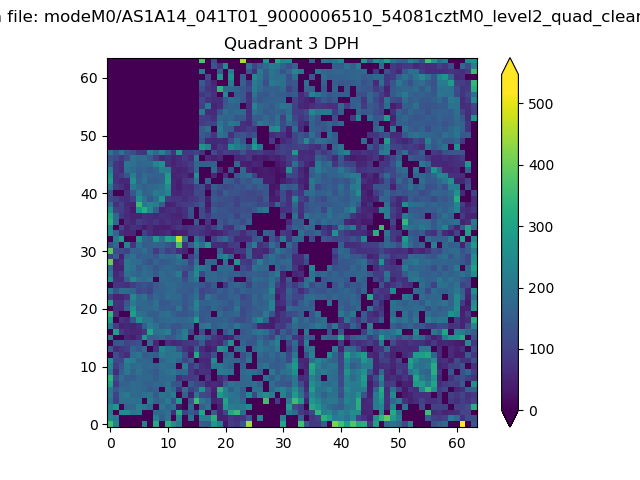 |
 |
Quadrant C |
| Plot type | Count rate plots | Images |
|---|---|---|
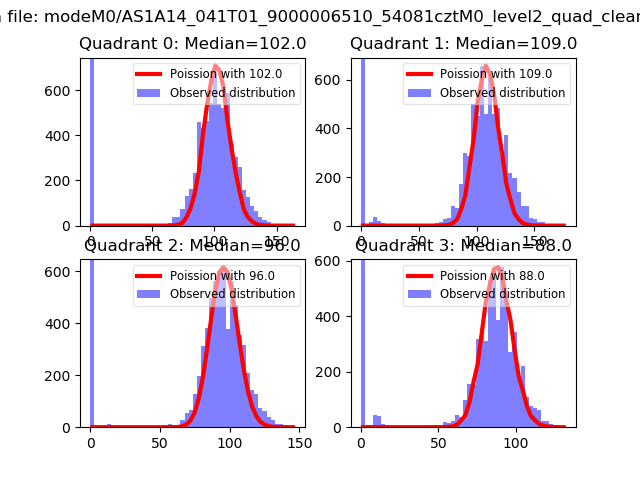
| Comparison with Poisson distribution Blue bars denote a histogram of data divided into 1 sec bins. Red curve is a Poisson curve with rate = median count rate of data. |
 |
 |
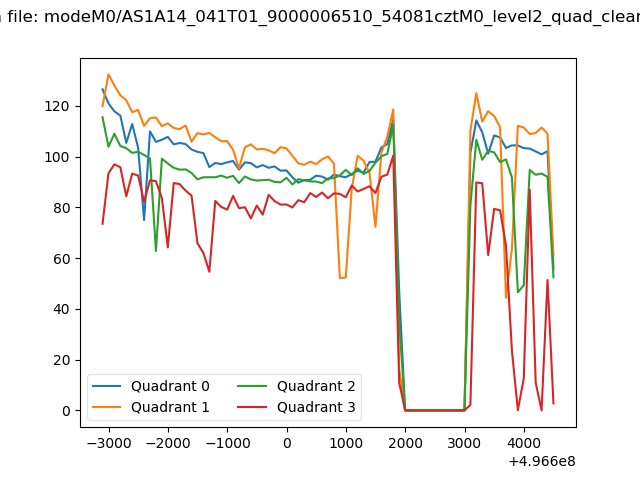
| Quadrant-wise count rates Data is divided into 100 sec bins |
 |
|
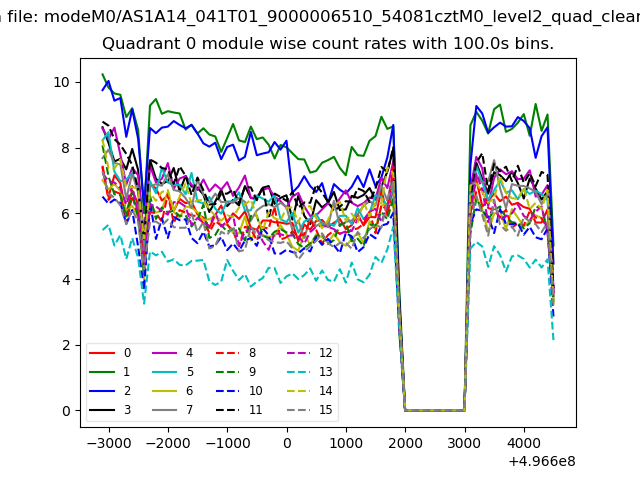
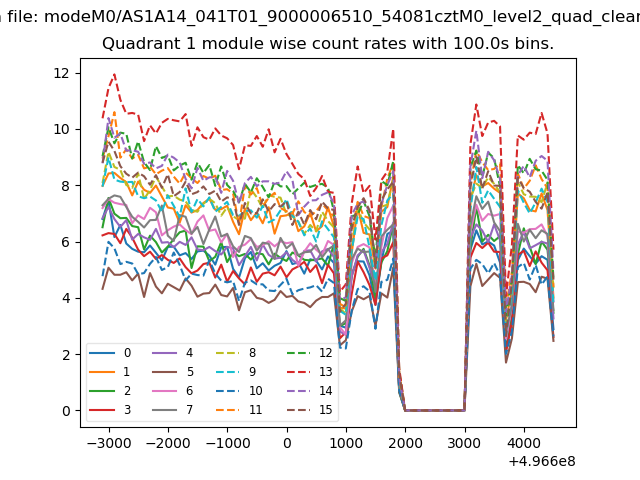
| Module-wise count rates for Quadrant A Data is divided into 100 sec bins |
 |
 |
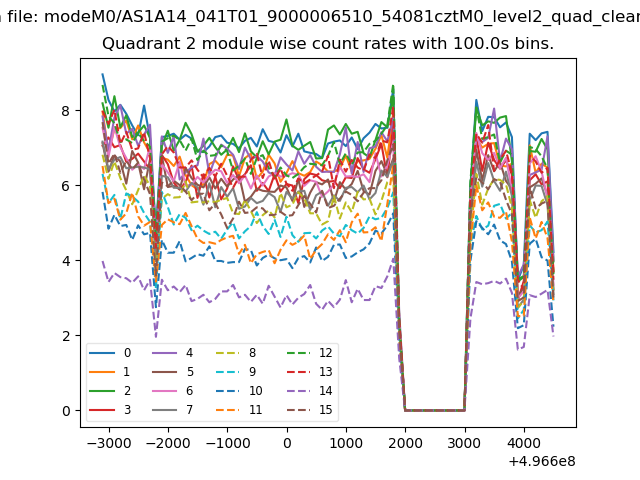
| Module-wise count rates for Quadrant B Data is divided into 100 sec bins |
 |
 |
| Module-wise count rates for Quadrant C Data is divided into 100 sec bins |
 |
 |
| Module-wise count rates for Quadrant D Data is divided into 100 sec bins |
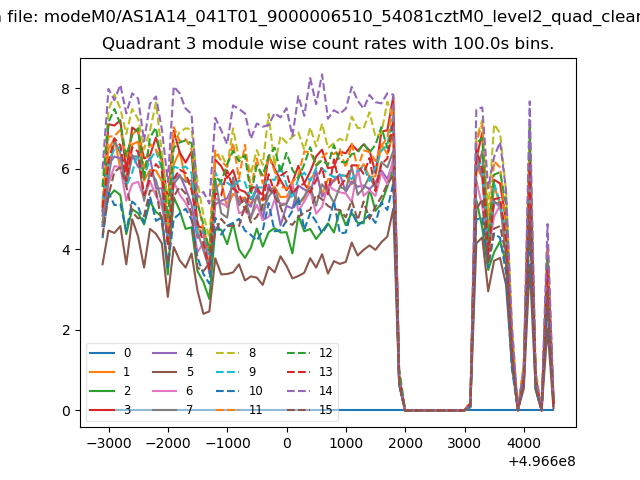 |
 |
| Parameter | Plot |
|---|---|
| CZT HV Monitor |  |
| D_VDD | 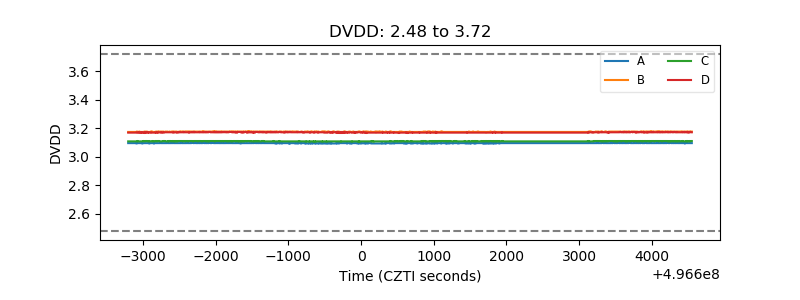 |
| Temperature 1 | 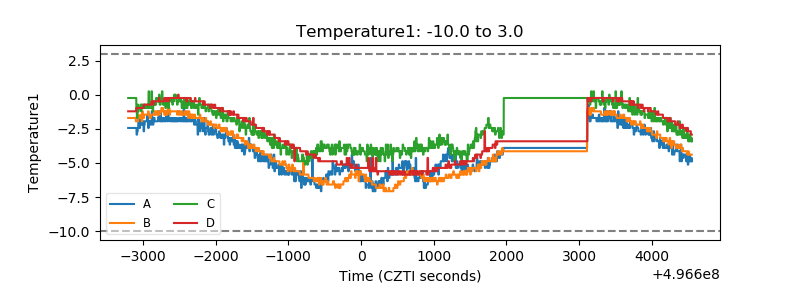 |
| Veto HV Monitor | 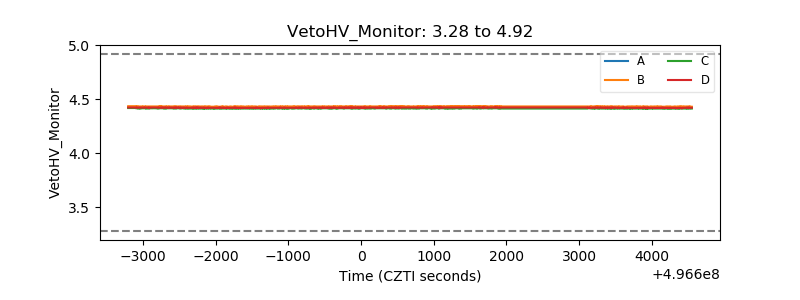 |
| Veto LLD | 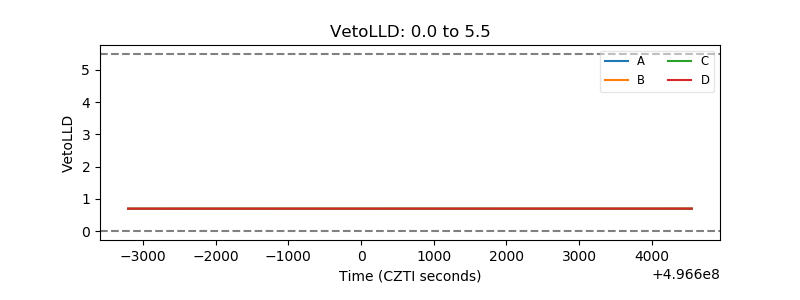 |
| Alpha Counter | 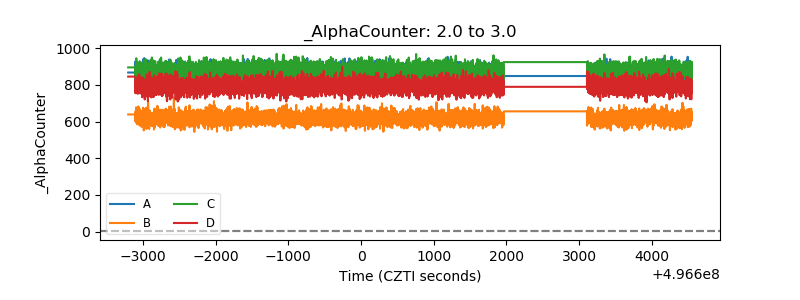 |
| _CPM_Rate | 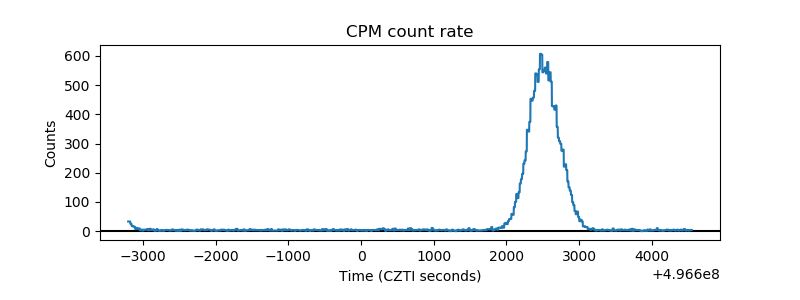 |
| CZT Counter | 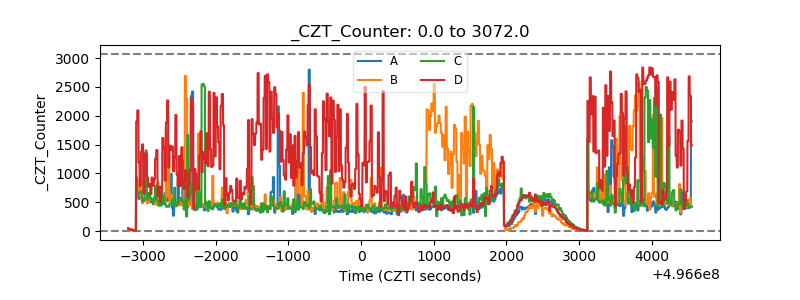 |
| +2.5 Volts monitor |  |
| +5 Volts monitor |  |
| _ROLL_ROT | 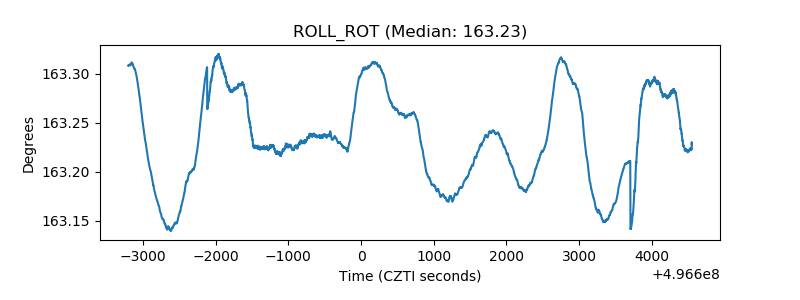 |
| _Roll_DEC | 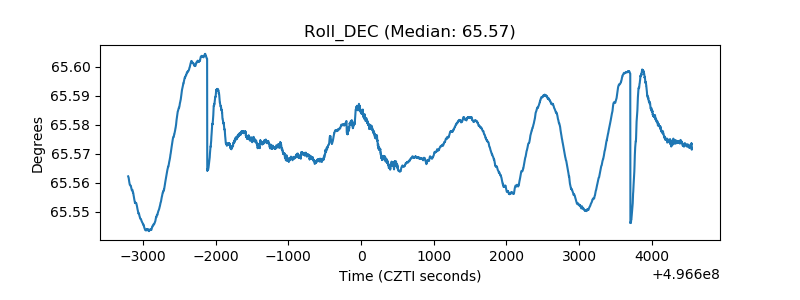 |
| _Roll_RA | 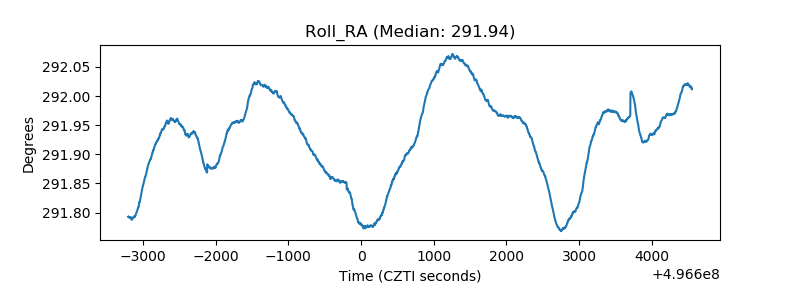 |
| Veto Counter | 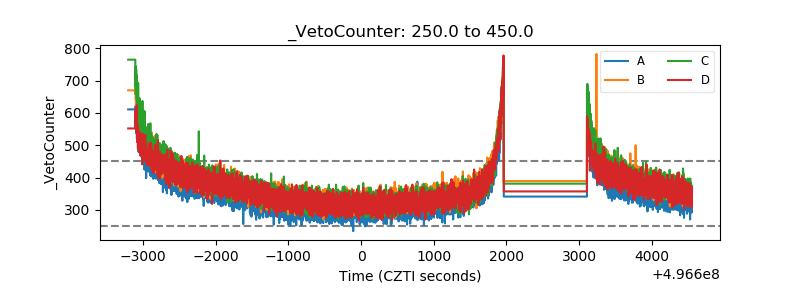 |