| Param | Original file | Final file |
|---|---|---|
| Filename | modeM0/AS1A14_041T01_9000006510_54082cztM0_level2.fits | modeM0/AS1A14_041T01_9000006510_54082cztM0_level2_quad_clean.evt |
| Size (bytes) | 574,971,840 | 88,986,240 |
| Size | 548.3 MB | 84.9 MB |
| Events in quadrant A | 3,163,303 | 632,259 |
| Events in quadrant B | 4,886,225 | 623,315 |
| Events in quadrant C | 3,965,941 | 590,781 |
| Events in quadrant D | 8,764,316 | 395,881 |
| Mode M9 | |||
|---|---|---|---|
| Quadrant | BADHDUFLAG | Total packets | Discarded packets |
| A | 0 | 14 | 0 |
| B | 0 | 14 | 0 |
| C | 0 | 15 | 0 |
| D | 0 | 15 | 0 |
| Mode SS | |||
|---|---|---|---|
| Quadrant | BADHDUFLAG | Total packets | Discarded packets |
| A | 0 | 130 | 0 |
| B | 0 | 130 | 0 |
| C | 0 | 130 | 0 |
| D | 0 | 130 | 0 |
| Mode M0 | |||
|---|---|---|---|
| Quadrant | BADHDUFLAG | Total packets | Discarded packets |
| A | 0 | 14324 | 2 |
| B | 0 | 19168 | 2 |
| C | 0 | 16393 | 6 |
| D | 0 | 30535 | 2 |
| Quadrant | Total seconds | Saturated seconds | Saturation percentage |
|---|---|---|---|
| A | 6485 | 114 | 1.757903% |
| B | 6485 | 719 | 11.087124% |
| C | 6484 | 289 | 4.457125% |
| D | 6484 | 2099 | 32.371993% |
Noise dominated data is calculated using 1-second bins in cleaned event files. If a bin has >2000 counts, and if more than 50% of those come from <1% of pixels, then it is considered to be noise-dominated and hence unusable.
| Quadrant | # 1 sec bins | Bins with >0 counts | Bins with >2000 counts | High rate bins dominated by noise | Noise dominated (total time) | Noise dominated (detector-on time) | Marked lightcurve |
|---|---|---|---|---|---|---|---|
| A | 7555 | 6486 | 90 | 90 | 1.19% | 1.39% | 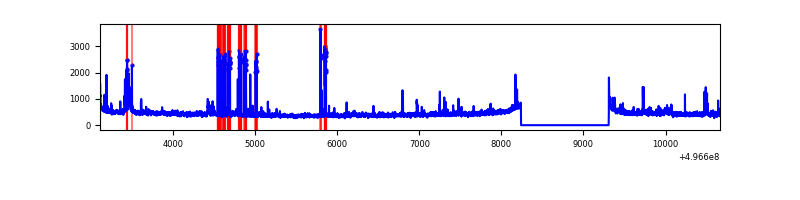 |
| B | 7555 | 6486 | 610 | 610 | 8.07% | 9.40% | 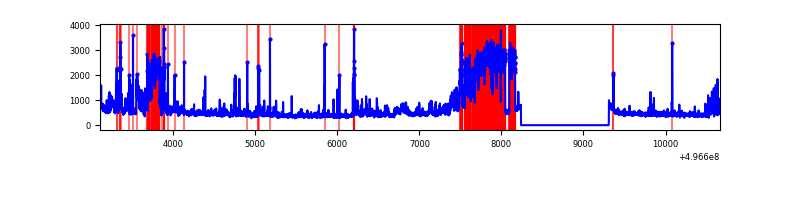 |
| C | 7554 | 6485 | 252 | 252 | 3.34% | 3.89% | 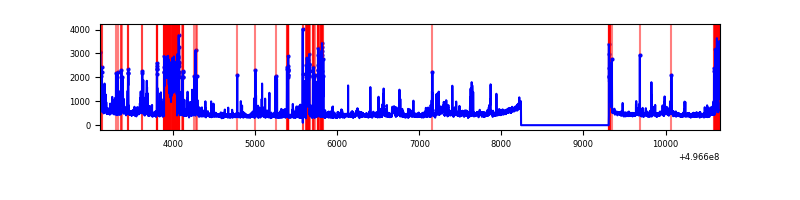 |
| D | 7554 | 6485 | 1606 | 1606 | 21.26% | 24.76% | 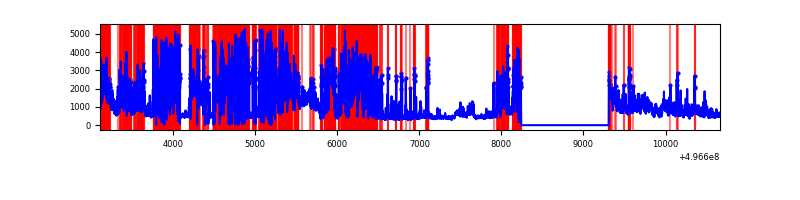 |
Top three noisy pixels from each quadrant. If the there are fewer than three noisy pixels in the level2.evt file, extra rows are filled as -1
| Pixel properties | Quadrant properties | ||||||
|---|---|---|---|---|---|---|---|
| Quadrant | DetID | PixID | Counts | Sigma | Mean | Median | Sigma |
| A | 3 | 14 | 209553 | 1218.9 | 689 | 673 | 171.4 |
| A | 15 | 174 | 127779 | 741.72 | 689 | 673 | 171.4 |
| A | 0 | 8 | 51353 | 295.74 | 689 | 673 | 171.4 |
| B | 5 | 236 | 1749090 | 12707.02 | 644 | 623 | 137.6 |
| B | 15 | 20 | 197923 | 1433.88 | 644 | 623 | 137.6 |
| B | 0 | 213 | 171709 | 1243.37 | 644 | 623 | 137.6 |
| C | 9 | 38 | 584307 | 3164.64 | 674 | 668 | 184.4 |
| C | 15 | 233 | 203084 | 1097.55 | 674 | 668 | 184.4 |
| C | 12 | 249 | 167200 | 902.98 | 674 | 668 | 184.4 |
| D | 11 | 176 | 4304712 | 29257.51 | 521 | 497 | 147.1 |
| D | 8 | 176 | 1570183 | 10669.8 | 521 | 497 | 147.1 |
| D | 10 | 199 | 293424 | 1991.14 | 521 | 497 | 147.1 |
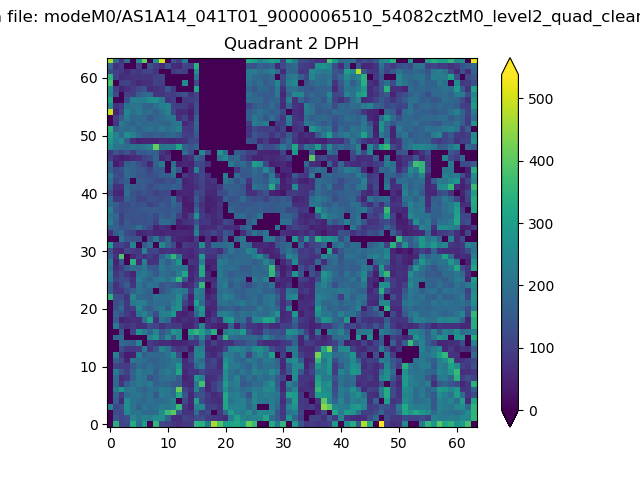
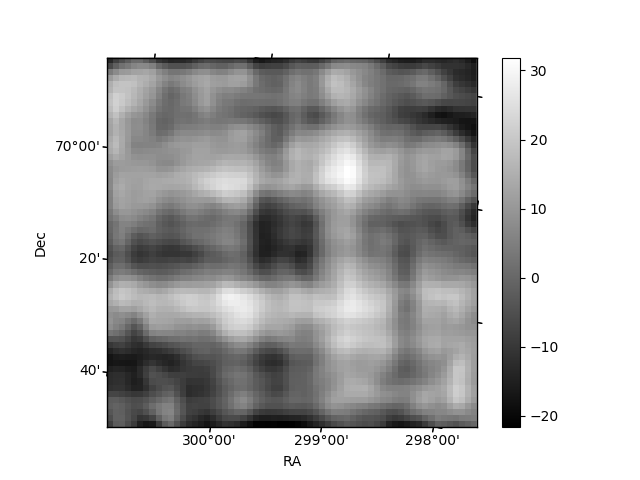
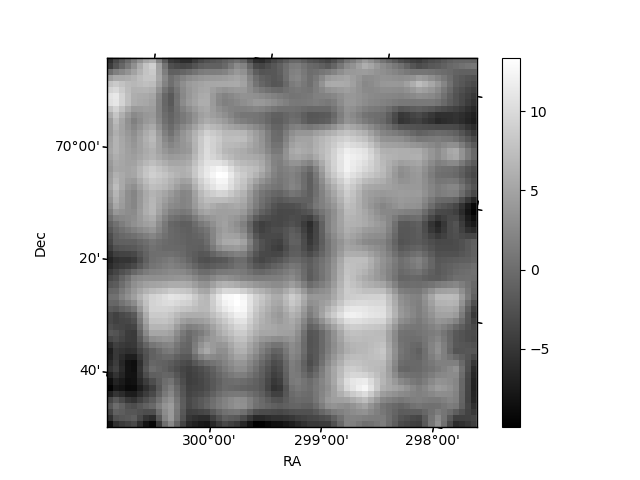
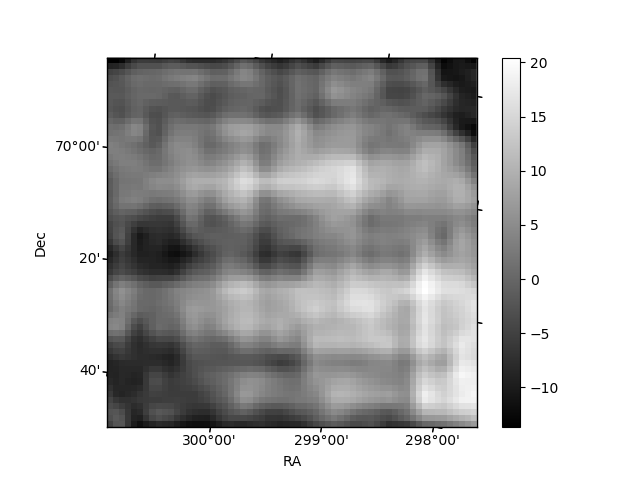
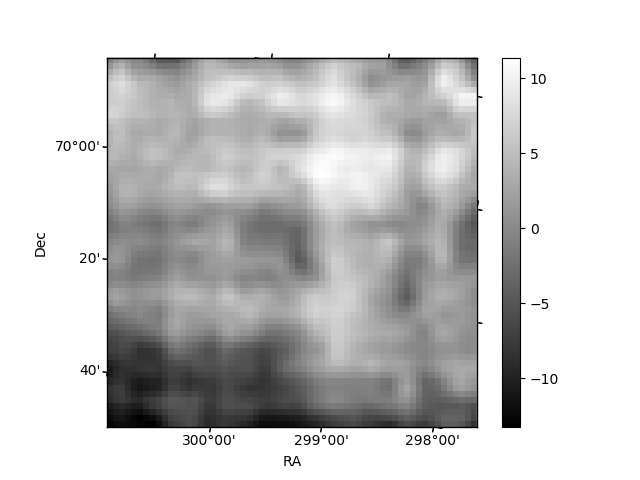
Histogram calculated using DETX and DETY for each event in the final _common_clean file
| Quadrant A | 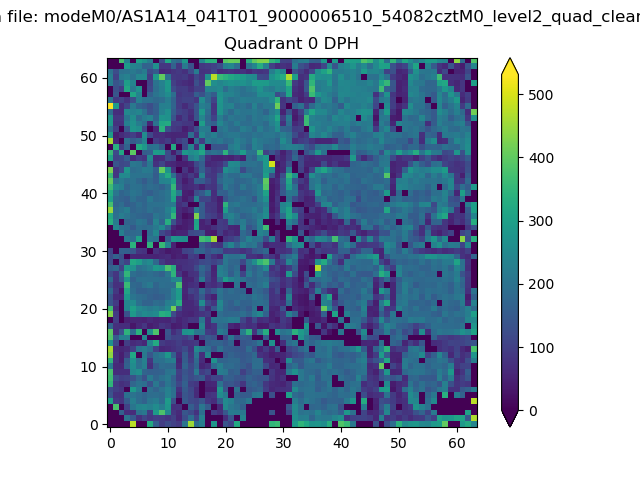 |
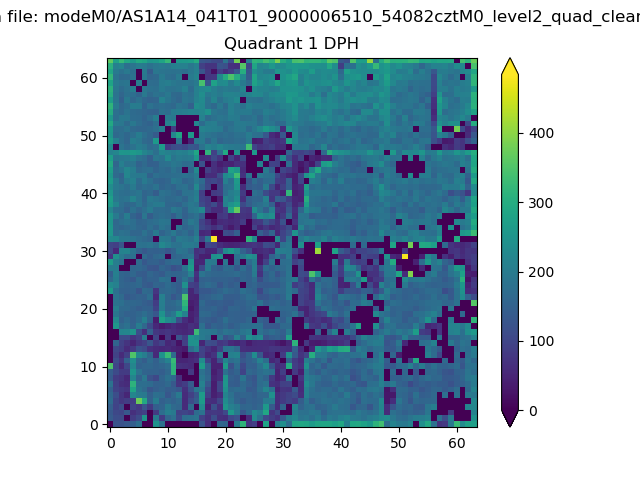 |
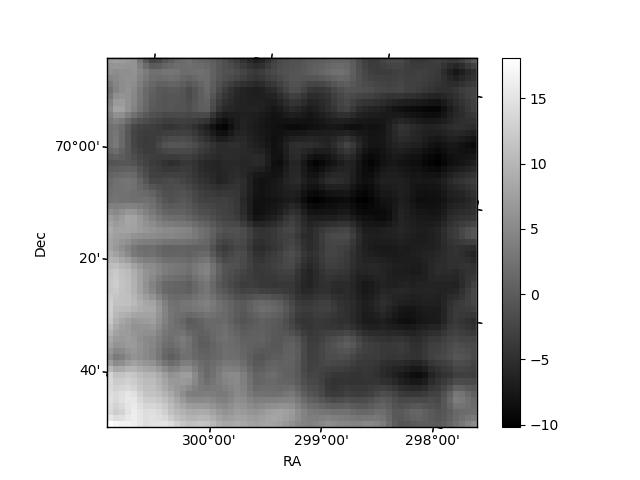
Quadrant B |
|---|---|---|---|
| Quadrant D | 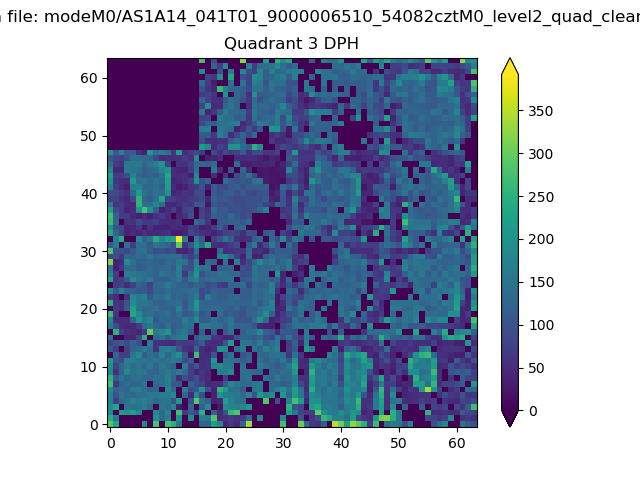 |
 |
Quadrant C |
| Plot type | Count rate plots | Images |
|---|---|---|
| Comparison with Poisson distribution Blue bars denote a histogram of data divided into 1 sec bins. Red curve is a Poisson curve with rate = median count rate of data. |
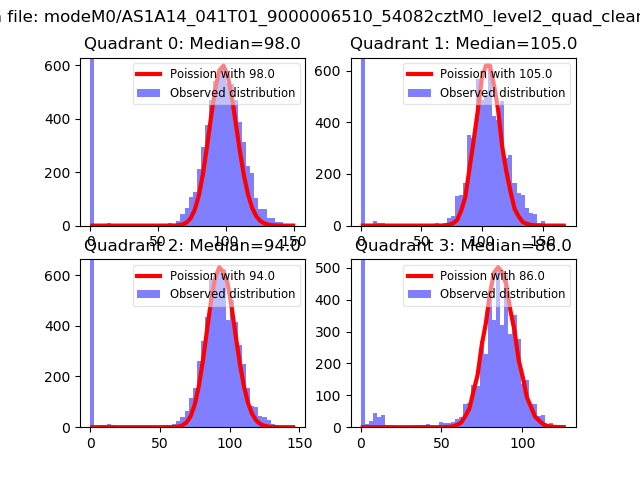 |
 |
| Quadrant-wise count rates Data is divided into 100 sec bins |
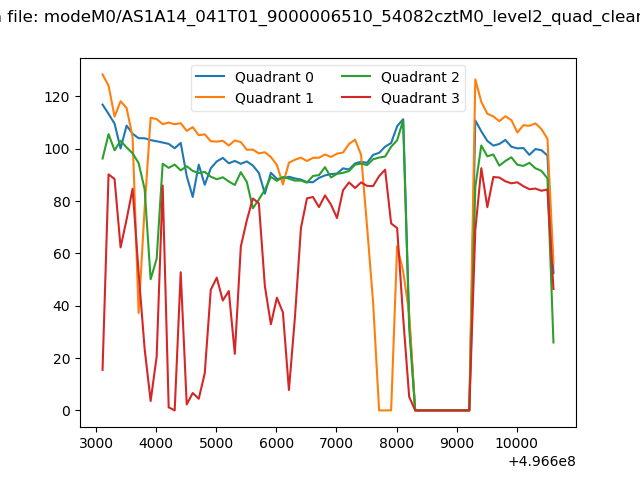 |
|
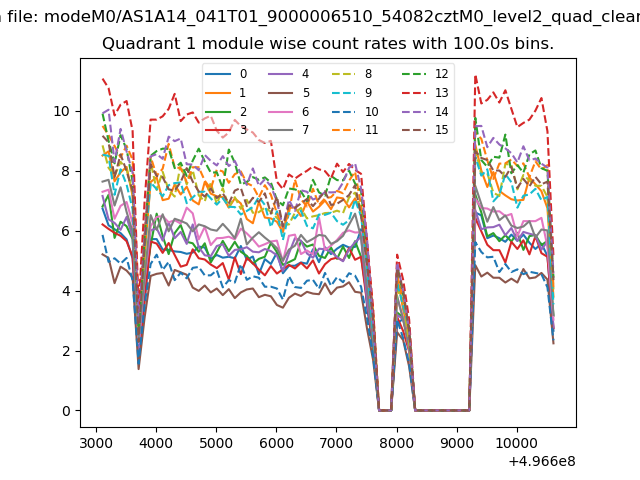
| Module-wise count rates for Quadrant A Data is divided into 100 sec bins |
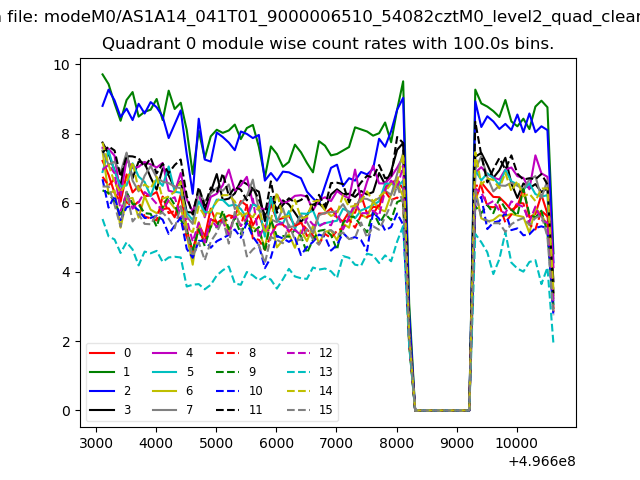 |
 |
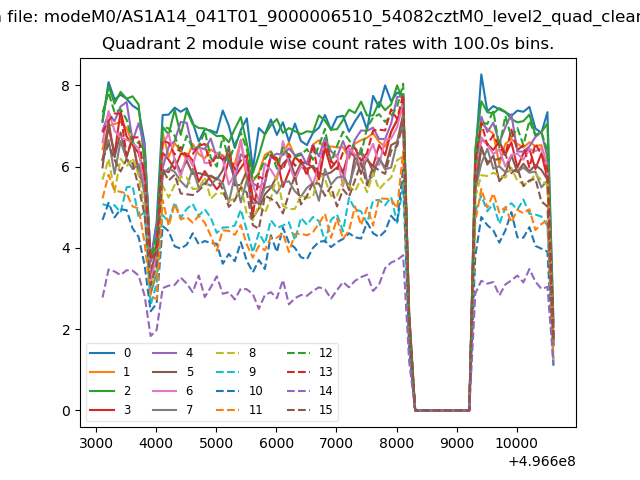
| Module-wise count rates for Quadrant B Data is divided into 100 sec bins |
 |
 |
| Module-wise count rates for Quadrant C Data is divided into 100 sec bins |
 |
 |
| Module-wise count rates for Quadrant D Data is divided into 100 sec bins |
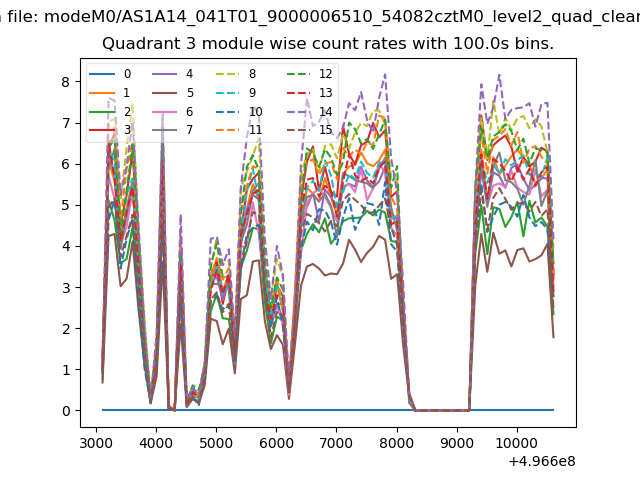 |
 |
| Parameter | Plot |
|---|---|
| CZT HV Monitor | 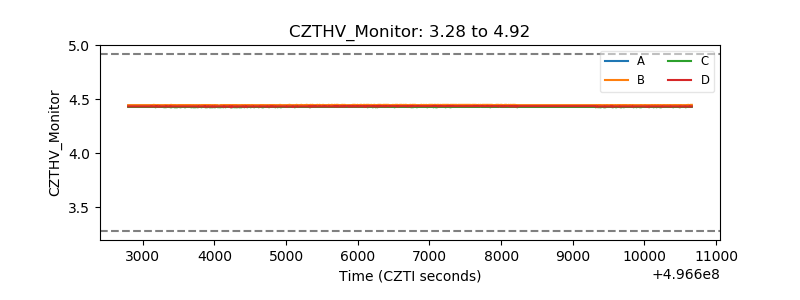 |
| D_VDD | 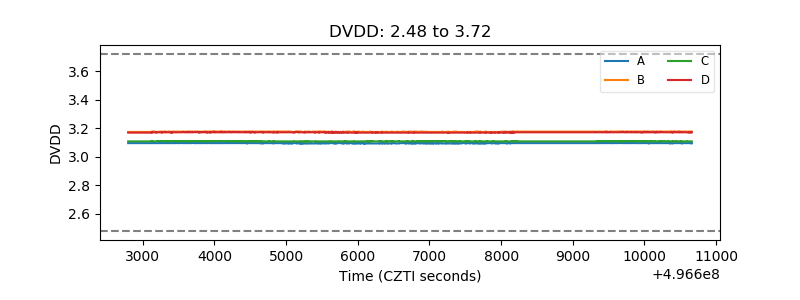 |
| Temperature 1 | 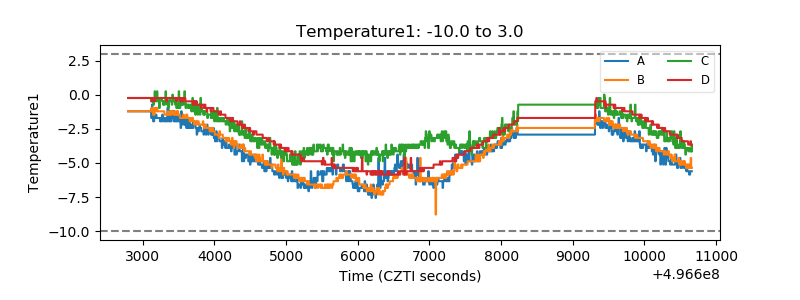 |
| Veto HV Monitor | 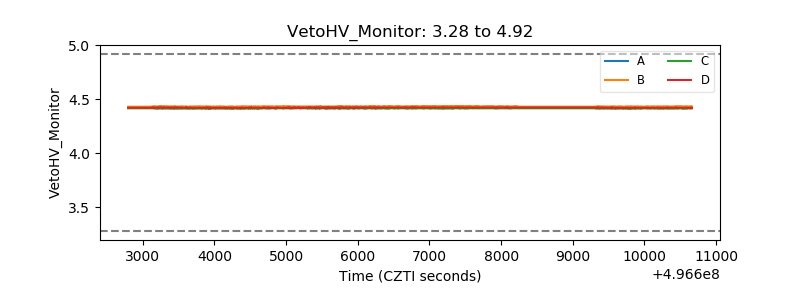 |
| Veto LLD | 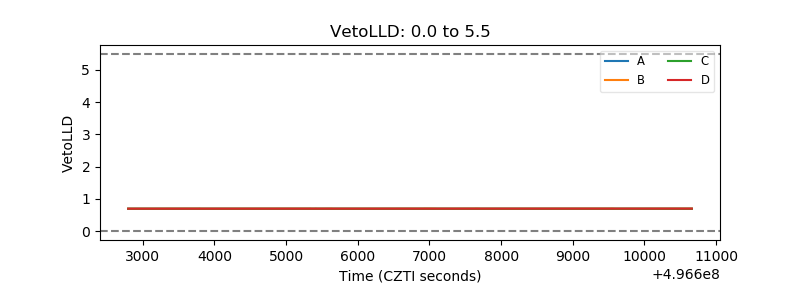 |
| Alpha Counter | 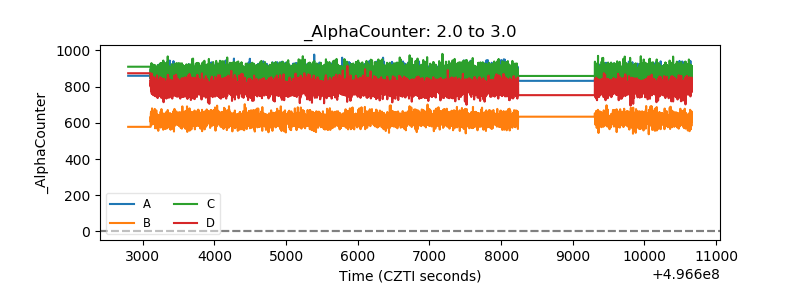 |
| _CPM_Rate | 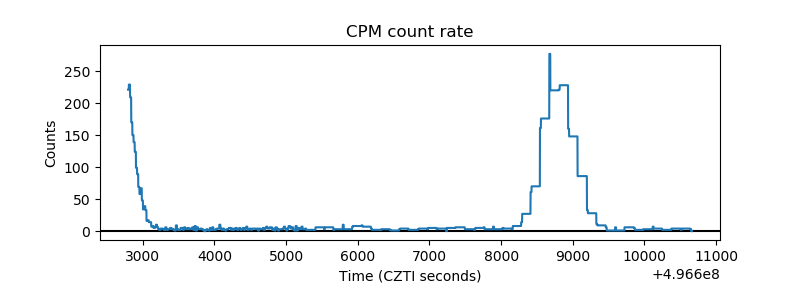 |
| CZT Counter | 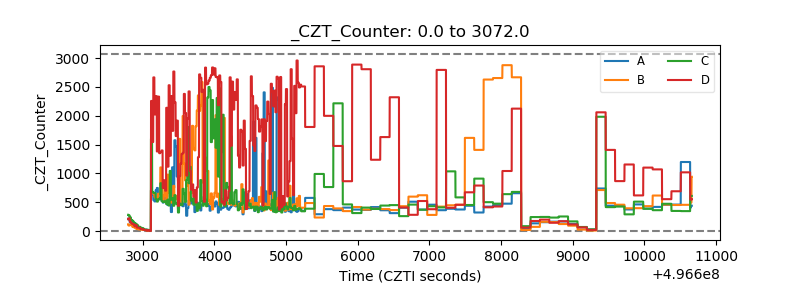 |
| +2.5 Volts monitor |  |
| +5 Volts monitor |  |
| _ROLL_ROT | 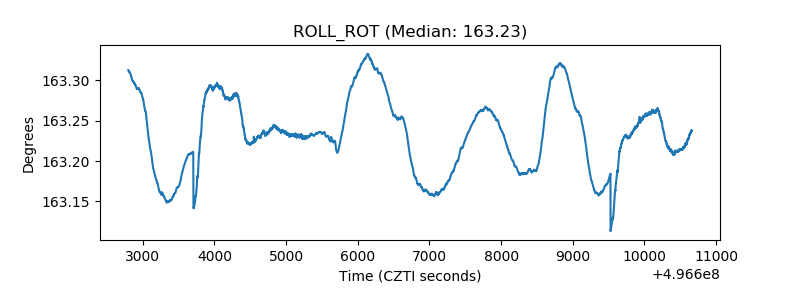 |
| _Roll_DEC | 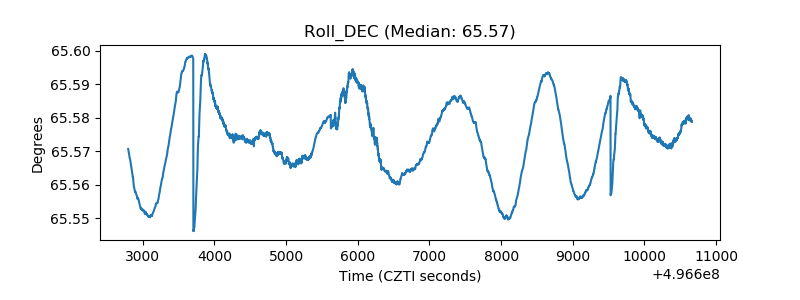 |
| _Roll_RA | 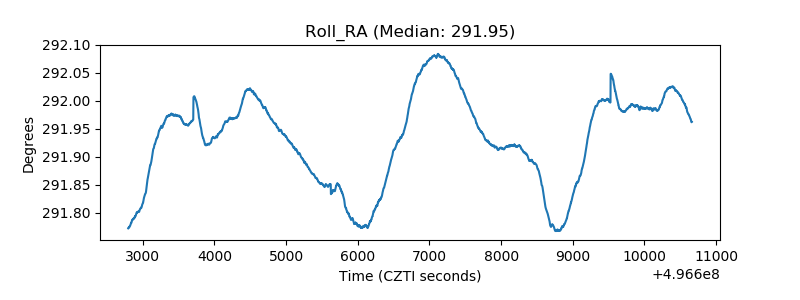 |
| Veto Counter | 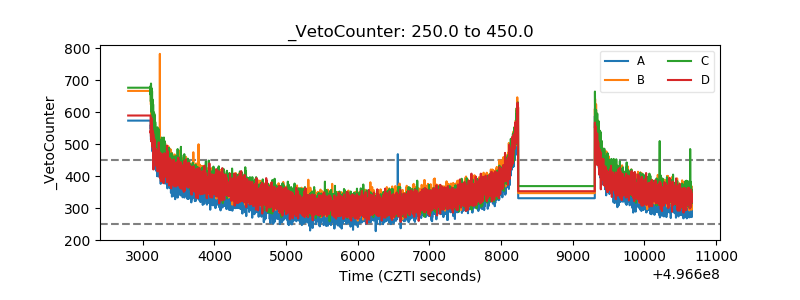 |