| Param | Original file | Final file |
|---|---|---|
| Filename | modeM0/AS1A14_041T01_9000006510_54083cztM0_level2.fits | modeM0/AS1A14_041T01_9000006510_54083cztM0_level2_quad_clean.evt |
| Size (bytes) | 542,640,960 | 96,632,640 |
| Size | 517.5 MB | 92.2 MB |
| Events in quadrant A | 3,129,213 | 664,674 |
| Events in quadrant B | 3,536,680 | 717,542 |
| Events in quadrant C | 4,352,820 | 614,343 |
| Events in quadrant D | 8,528,998 | 446,455 |
| Mode M9 | |||
|---|---|---|---|
| Quadrant | BADHDUFLAG | Total packets | Discarded packets |
| A | 0 | 15 | 0 |
| B | 0 | 16 | 0 |
| C | 0 | 16 | 0 |
| D | 0 | 16 | 0 |
| Mode SS | |||
|---|---|---|---|
| Quadrant | BADHDUFLAG | Total packets | Discarded packets |
| A | 0 | 140 | 0 |
| B | 0 | 140 | 0 |
| C | 0 | 140 | 0 |
| D | 0 | 140 | 0 |
| Mode M0 | |||
|---|---|---|---|
| Quadrant | BADHDUFLAG | Total packets | Discarded packets |
| A | 0 | 14670 | 2 |
| B | 0 | 15749 | 2 |
| C | 0 | 17949 | 2 |
| D | 0 | 30202 | 2 |
| Quadrant | Total seconds | Saturated seconds | Saturation percentage |
|---|---|---|---|
| A | 6934 | 48 | 0.692241% |
| B | 6934 | 148 | 2.134410% |
| C | 6934 | 330 | 4.759158% |
| D | 6934 | 1837 | 26.492645% |
Noise dominated data is calculated using 1-second bins in cleaned event files. If a bin has >2000 counts, and if more than 50% of those come from <1% of pixels, then it is considered to be noise-dominated and hence unusable.
| Quadrant | # 1 sec bins | Bins with >0 counts | Bins with >2000 counts | High rate bins dominated by noise | Noise dominated (total time) | Noise dominated (detector-on time) | Marked lightcurve |
|---|---|---|---|---|---|---|---|
| A | 7684 | 6936 | 8 | 8 | 0.10% | 0.12% | 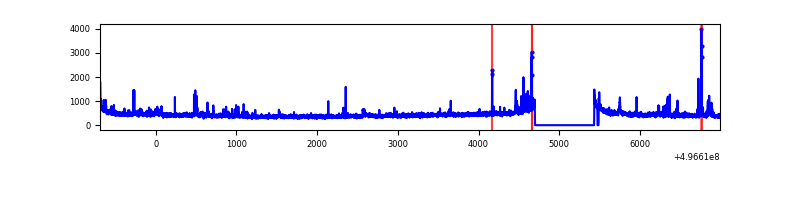 |
| B | 7684 | 6936 | 50 | 50 | 0.65% | 0.72% | 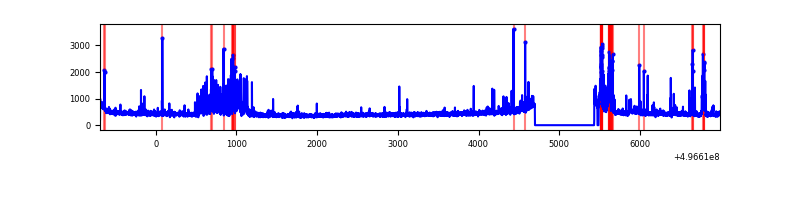 |
| C | 7684 | 6936 | 289 | 289 | 3.76% | 4.17% | 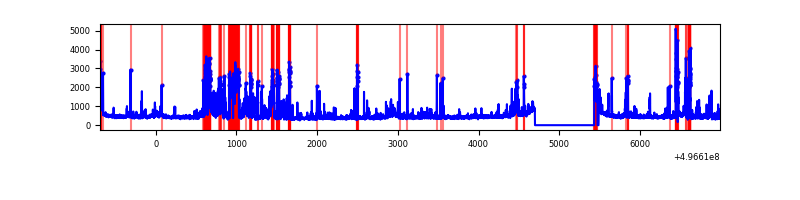 |
| D | 7684 | 6936 | 1692 | 1692 | 22.02% | 24.39% | 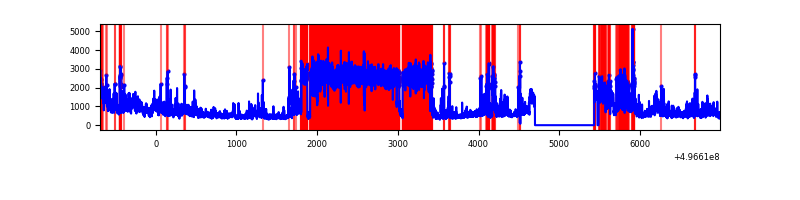 |
Top three noisy pixels from each quadrant. If the there are fewer than three noisy pixels in the level2.evt file, extra rows are filled as -1
| Pixel properties | Quadrant properties | ||||||
|---|---|---|---|---|---|---|---|
| Quadrant | DetID | PixID | Counts | Sigma | Mean | Median | Sigma |
| A | 15 | 174 | 120868 | 664.23 | 730 | 713 | 180.9 |
| A | 12 | 15 | 38013 | 206.2 | 730 | 713 | 180.9 |
| A | 3 | 14 | 38005 | 206.15 | 730 | 713 | 180.9 |
| B | 5 | 236 | 245513 | 1572.65 | 728 | 702 | 155.7 |
| B | 5 | 185 | 214740 | 1374.97 | 728 | 702 | 155.7 |
| B | 0 | 213 | 53611 | 339.88 | 728 | 702 | 155.7 |
| C | 12 | 249 | 858241 | 4419.14 | 707 | 697 | 194.1 |
| C | 13 | 3 | 204502 | 1050.26 | 707 | 697 | 194.1 |
| C | 15 | 233 | 160398 | 822.98 | 707 | 697 | 194.1 |
| D | 2 | 165 | 3727513 | 20857.34 | 629 | 599 | 178.7 |
| D | 2 | 172 | 623157 | 3484.09 | 629 | 599 | 178.7 |
| D | 10 | 199 | 606652 | 3391.72 | 629 | 599 | 178.7 |
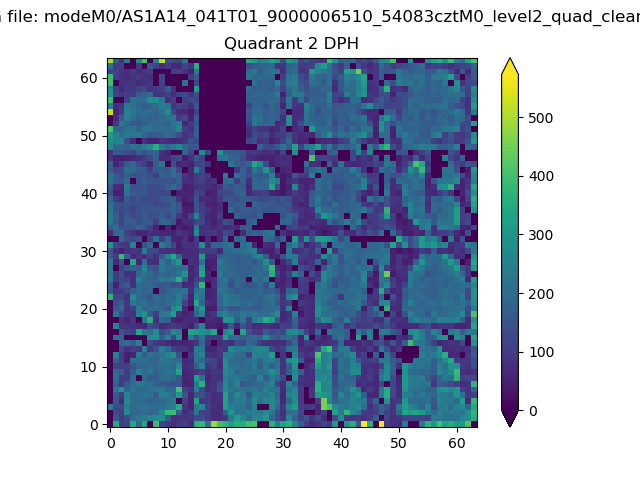
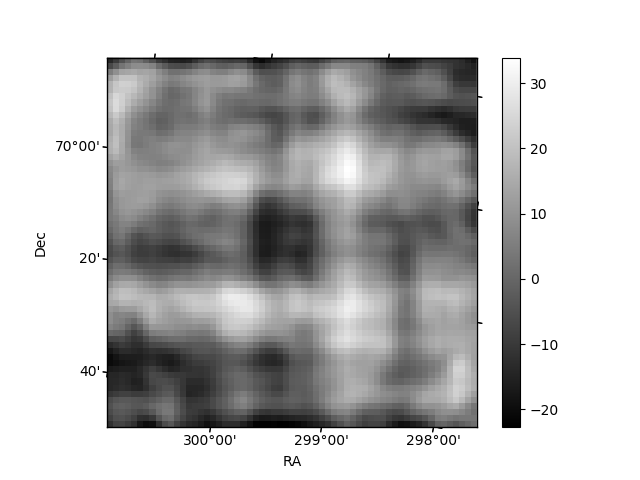
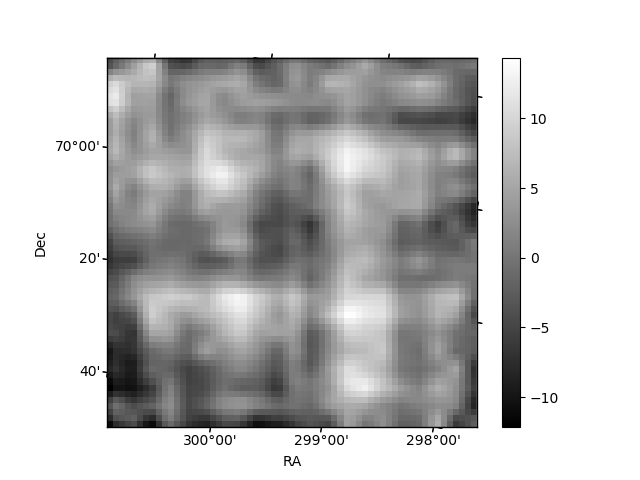
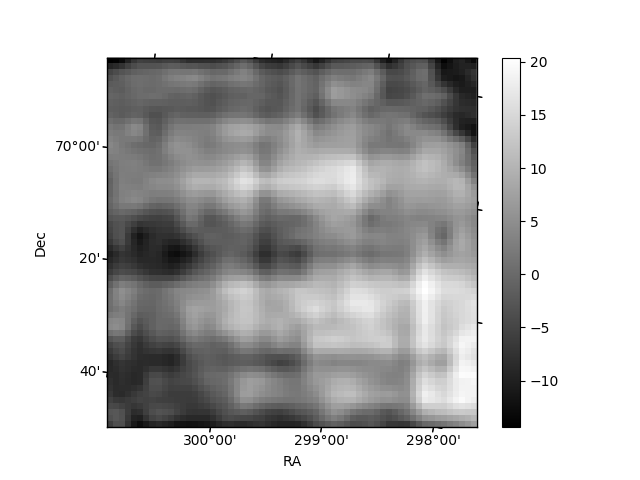
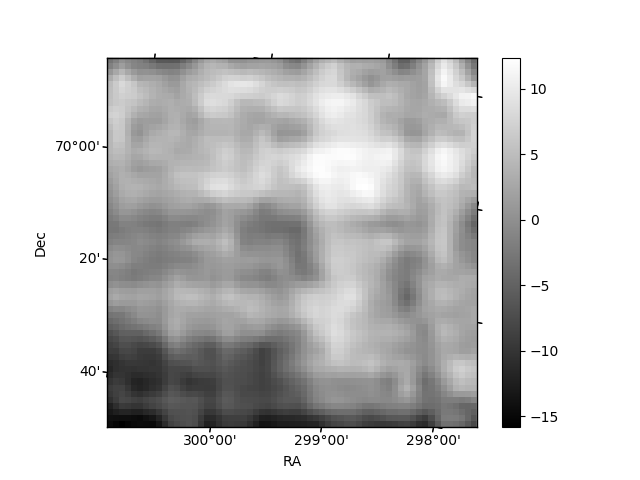
Histogram calculated using DETX and DETY for each event in the final _common_clean file
| Quadrant A | 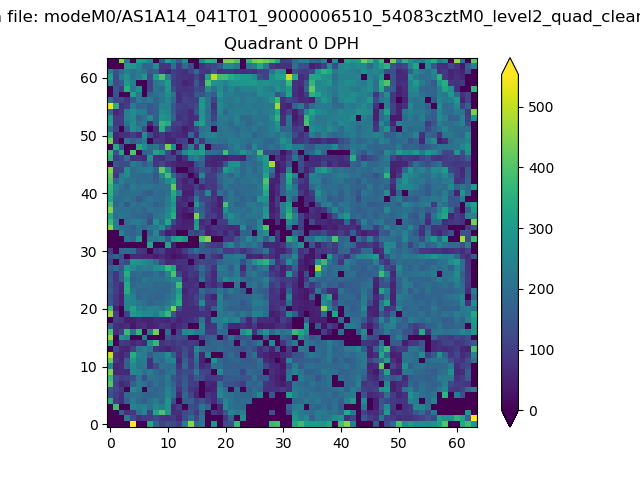 |
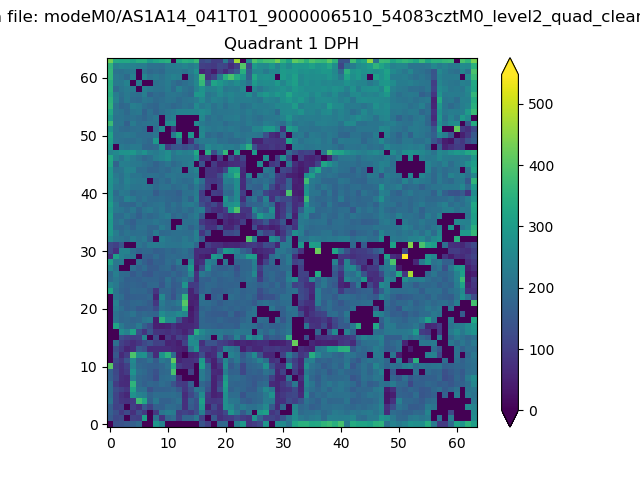 |
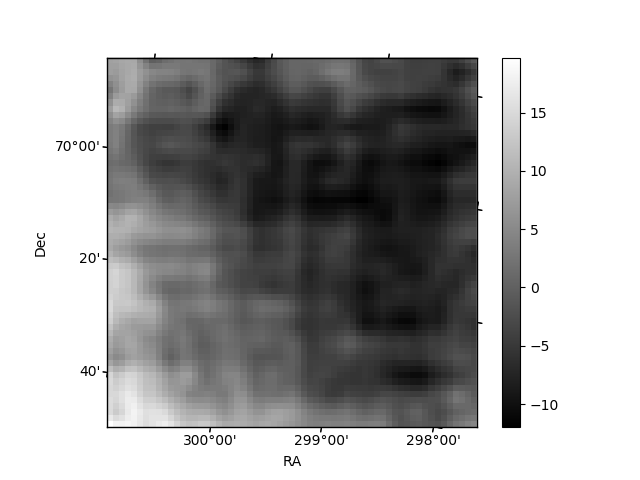
Quadrant B |
|---|---|---|---|
| Quadrant D | 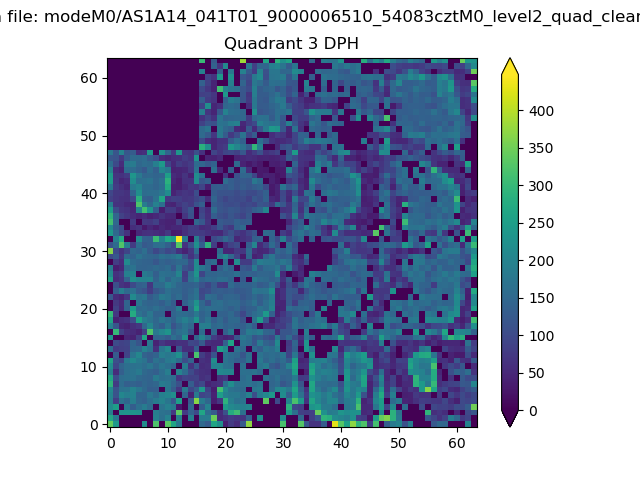 |
 |
Quadrant C |
| Plot type | Count rate plots | Images |
|---|---|---|
| Comparison with Poisson distribution Blue bars denote a histogram of data divided into 1 sec bins. Red curve is a Poisson curve with rate = median count rate of data. |
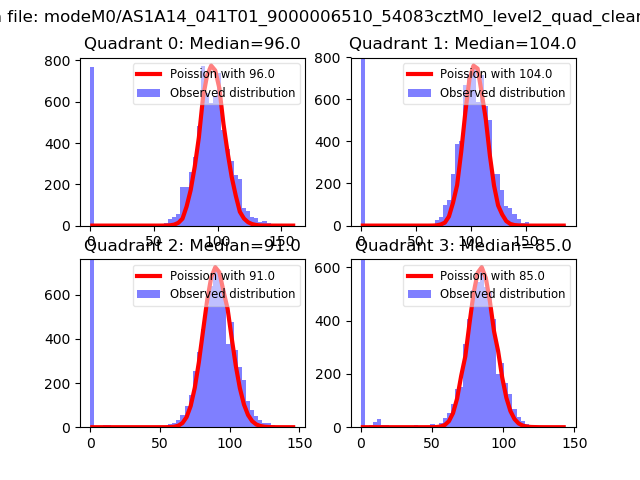 |
 |
| Quadrant-wise count rates Data is divided into 100 sec bins |
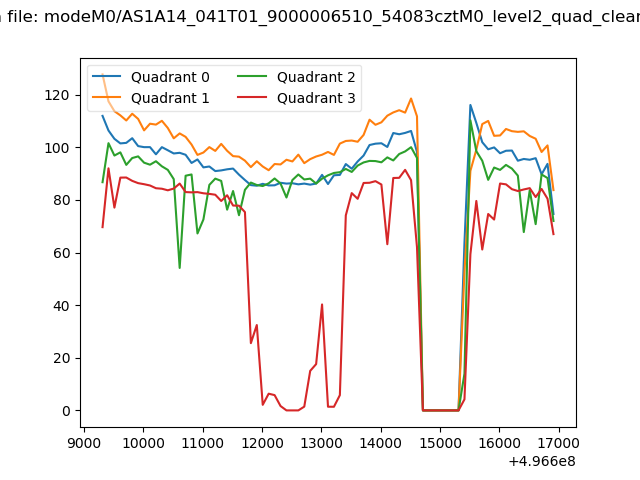 |
|
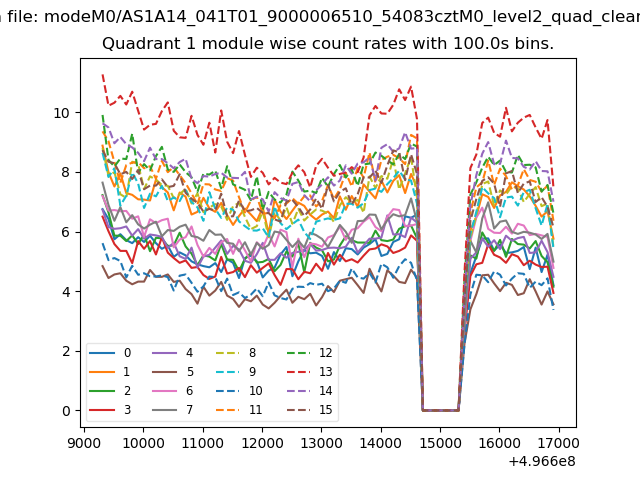
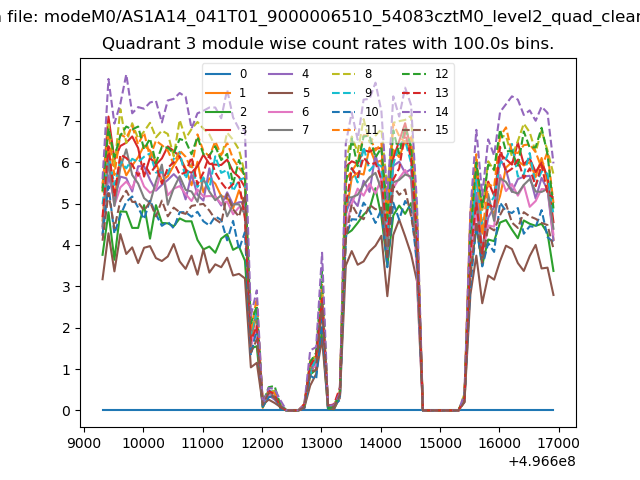
| Module-wise count rates for Quadrant A Data is divided into 100 sec bins |
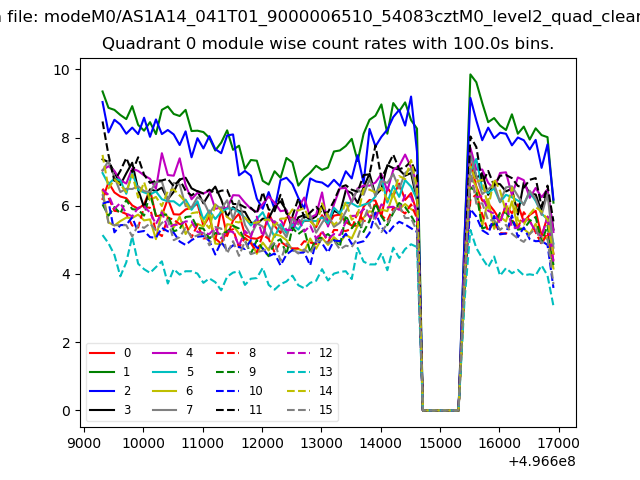 |
 |
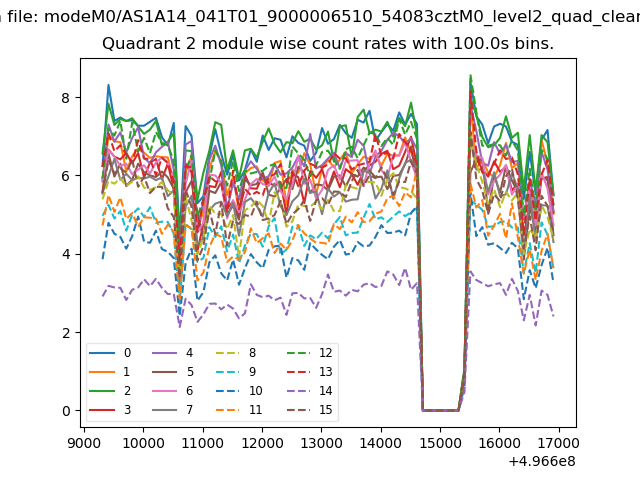
| Module-wise count rates for Quadrant B Data is divided into 100 sec bins |
 |
 |
| Module-wise count rates for Quadrant C Data is divided into 100 sec bins |
 |
 |
| Module-wise count rates for Quadrant D Data is divided into 100 sec bins |
 |
 |
| Parameter | Plot |
|---|---|
| CZT HV Monitor | 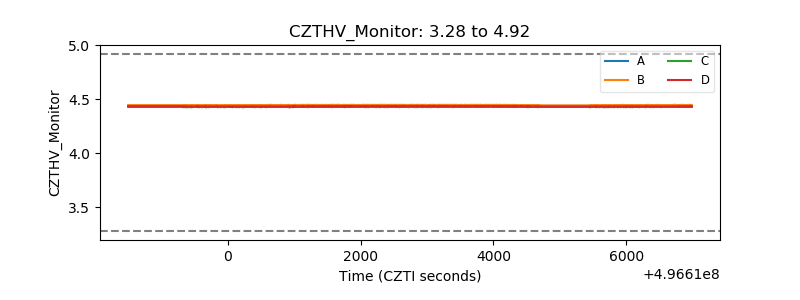 |
| D_VDD | 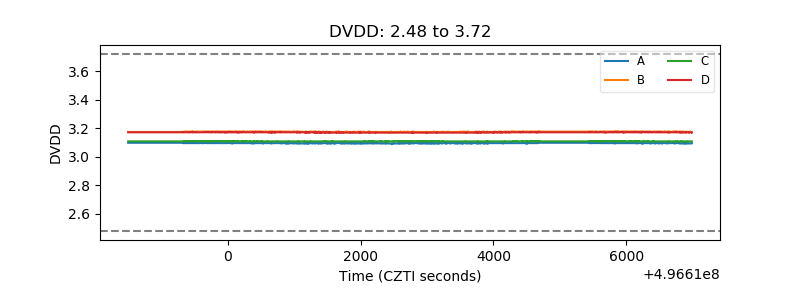 |
| Temperature 1 | 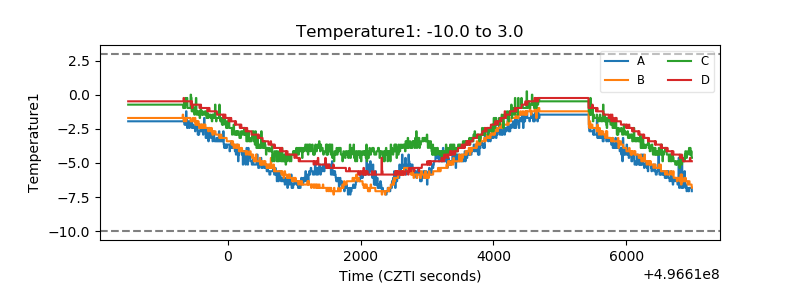 |
| Veto HV Monitor | 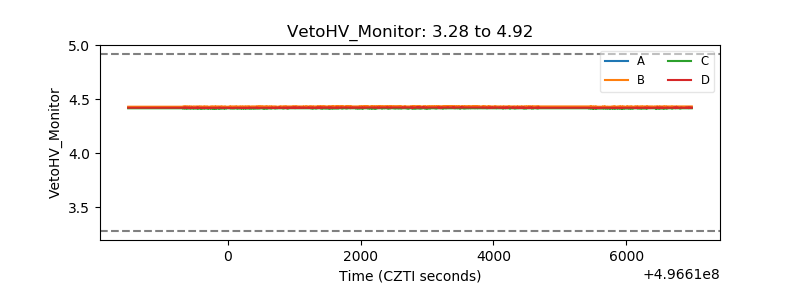 |
| Veto LLD | 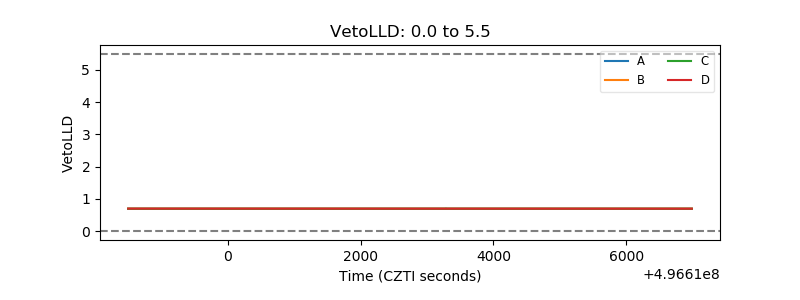 |
| Alpha Counter | 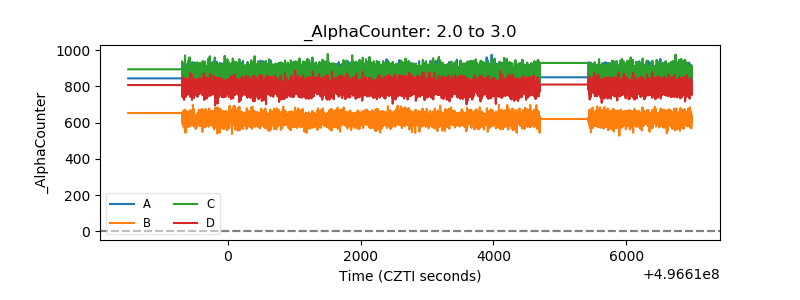 |
| _CPM_Rate | 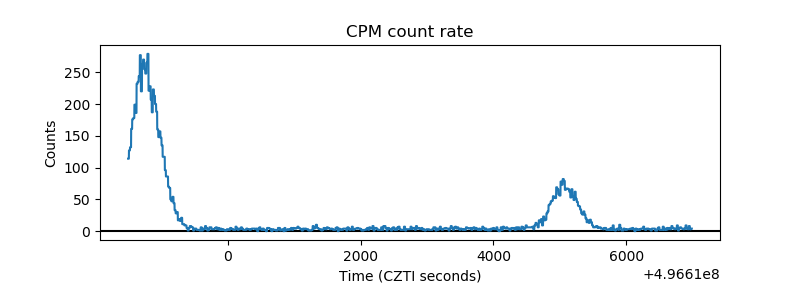 |
| CZT Counter | 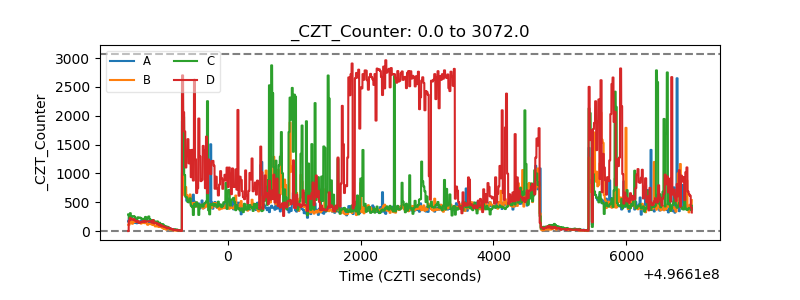 |
| +2.5 Volts monitor |  |
| +5 Volts monitor |  |
| _ROLL_ROT | 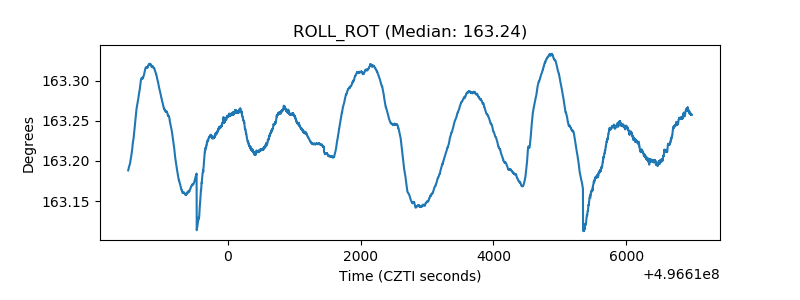 |
| _Roll_DEC | 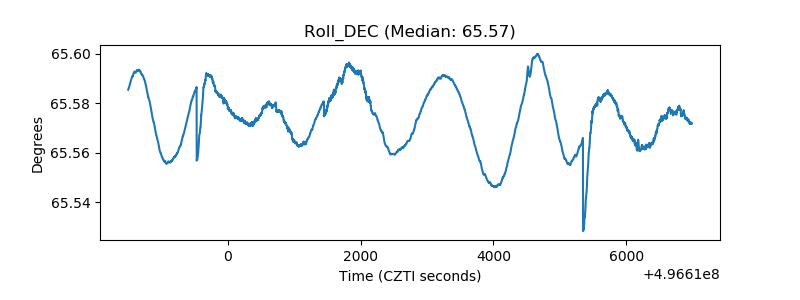 |
| _Roll_RA | 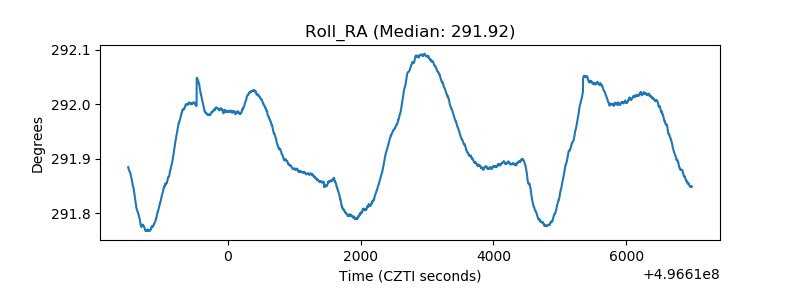 |
| Veto Counter | 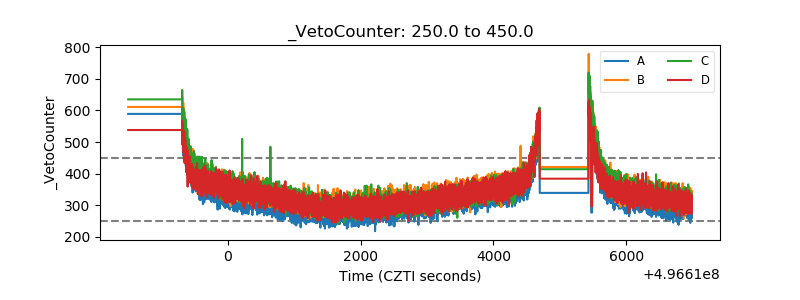 |