| Param | Original file | Final file |
|---|---|---|
| Filename | modeM0/AS1A14_041T01_9000006510_54084cztM0_level2.fits | modeM0/AS1A14_041T01_9000006510_54084cztM0_level2_quad_clean.evt |
| Size (bytes) | 500,143,680 | 106,963,200 |
| Size | 477.0 MB | 102.0 MB |
| Events in quadrant A | 3,650,518 | 706,512 |
| Events in quadrant B | 4,110,561 | 756,430 |
| Events in quadrant C | 4,052,968 | 665,655 |
| Events in quadrant D | 6,117,243 | 589,100 |
| Mode M9 | |||
|---|---|---|---|
| Quadrant | BADHDUFLAG | Total packets | Discarded packets |
| A | 0 | 3 | 0 |
| B | 0 | 3 | 0 |
| C | 0 | 4 | 0 |
| D | 0 | 4 | 0 |
| Mode SS | |||
|---|---|---|---|
| Quadrant | BADHDUFLAG | Total packets | Discarded packets |
| A | 0 | 152 | 0 |
| B | 0 | 152 | 0 |
| C | 0 | 152 | 0 |
| D | 0 | 152 | 0 |
| Mode M0 | |||
|---|---|---|---|
| Quadrant | BADHDUFLAG | Total packets | Discarded packets |
| A | 0 | 16638 | 2 |
| B | 0 | 17785 | 2 |
| C | 0 | 17679 | 2 |
| D | 0 | 23335 | 2 |
| Quadrant | Total seconds | Saturated seconds | Saturation percentage |
|---|---|---|---|
| A | 7492 | 145 | 1.935398% |
| B | 7492 | 305 | 4.071009% |
| C | 7492 | 220 | 2.936466% |
| D | 7492 | 626 | 8.355579% |
Noise dominated data is calculated using 1-second bins in cleaned event files. If a bin has >2000 counts, and if more than 50% of those come from <1% of pixels, then it is considered to be noise-dominated and hence unusable.
| Quadrant | # 1 sec bins | Bins with >0 counts | Bins with >2000 counts | High rate bins dominated by noise | Noise dominated (total time) | Noise dominated (detector-on time) | Marked lightcurve |
|---|---|---|---|---|---|---|---|
| A | 7717 | 7495 | 74 | 74 | 0.96% | 0.99% | 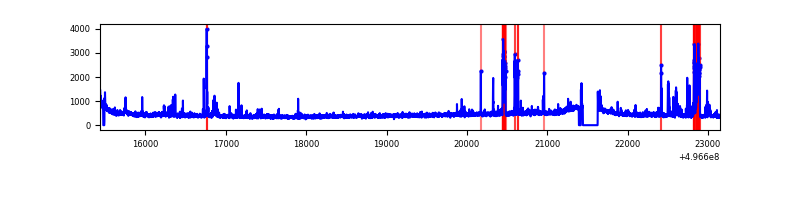 |
| B | 7717 | 7495 | 120 | 120 | 1.56% | 1.60% | 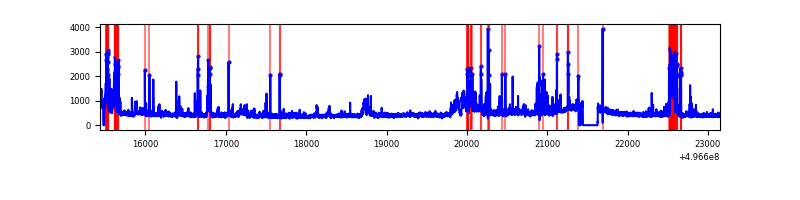 |
| C | 7717 | 7495 | 130 | 130 | 1.68% | 1.73% | 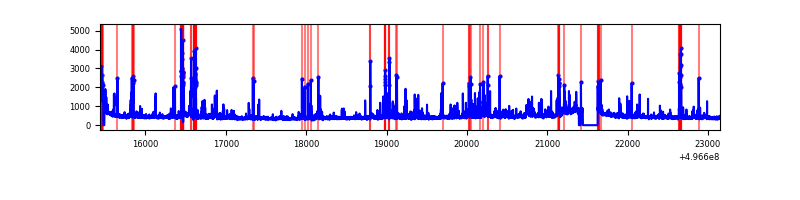 |
| D | 7717 | 7495 | 479 | 479 | 6.21% | 6.39% | 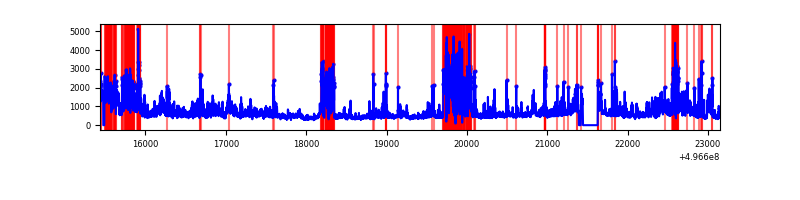 |
Top three noisy pixels from each quadrant. If the there are fewer than three noisy pixels in the level2.evt file, extra rows are filled as -1
| Pixel properties | Quadrant properties | ||||||
|---|---|---|---|---|---|---|---|
| Quadrant | DetID | PixID | Counts | Sigma | Mean | Median | Sigma |
| A | 15 | 174 | 404596 | 2036.5 | 798 | 775 | 198.3 |
| A | 12 | 15 | 39455 | 195.07 | 798 | 775 | 198.3 |
| A | 1 | 7 | 21807 | 106.07 | 798 | 775 | 198.3 |
| B | 5 | 236 | 217172 | 1285.4 | 793 | 762 | 168.4 |
| B | 7 | 252 | 198425 | 1174.05 | 793 | 762 | 168.4 |
| B | 5 | 185 | 193204 | 1143.04 | 793 | 762 | 168.4 |
| C | 13 | 3 | 349181 | 1643.86 | 778 | 769 | 211.9 |
| C | 15 | 233 | 176604 | 829.61 | 778 | 769 | 211.9 |
| C | 12 | 249 | 104425 | 489.06 | 778 | 769 | 211.9 |
| D | 8 | 176 | 1553241 | 7332.84 | 748 | 715 | 211.7 |
| D | 2 | 172 | 695550 | 3281.82 | 748 | 715 | 211.7 |
| D | 10 | 199 | 323356 | 1523.89 | 748 | 715 | 211.7 |
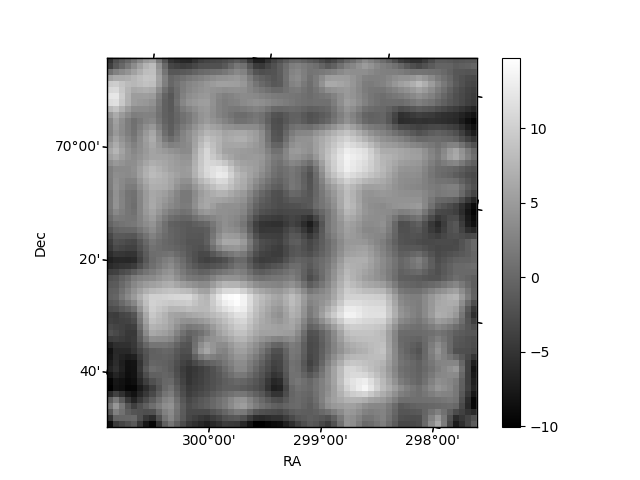
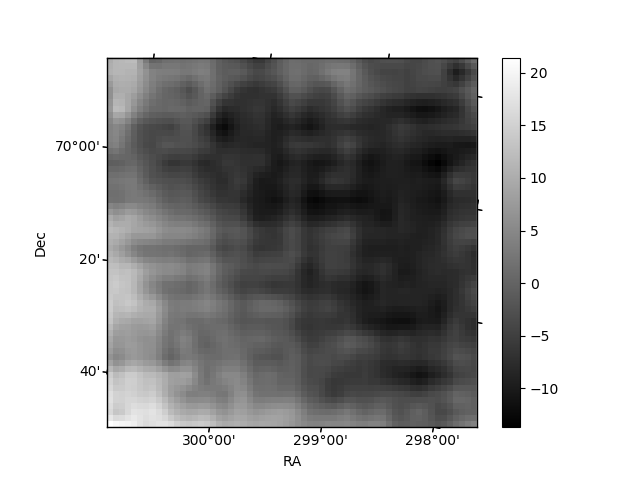
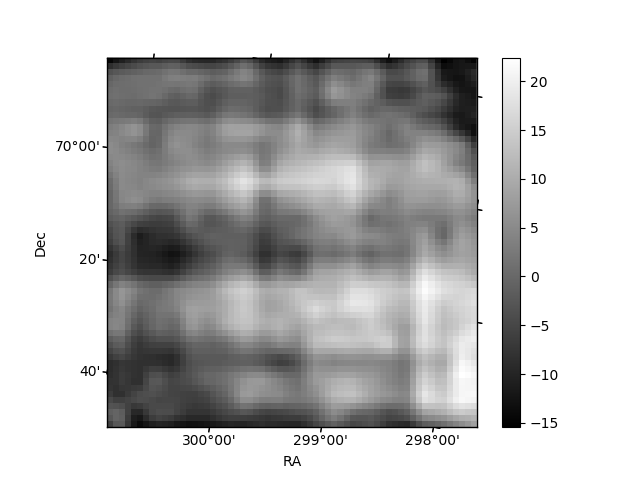
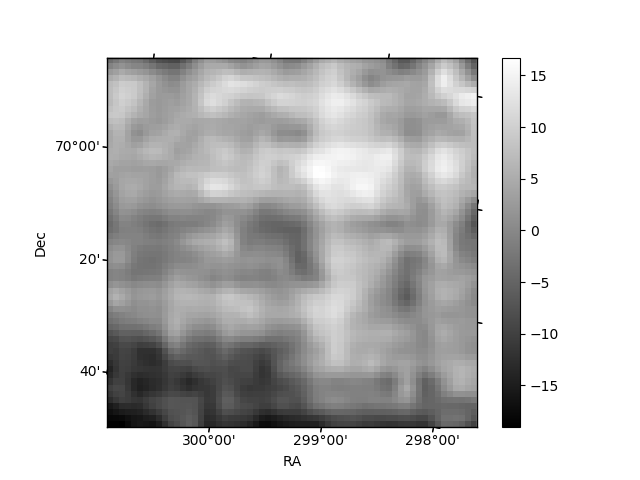
Histogram calculated using DETX and DETY for each event in the final _common_clean file
| Quadrant A | 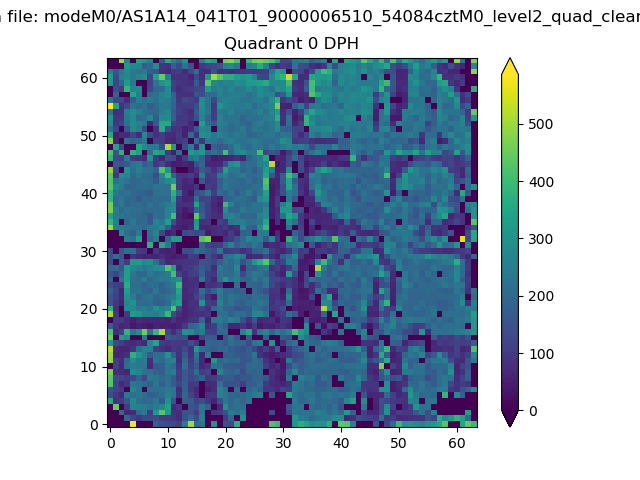 |
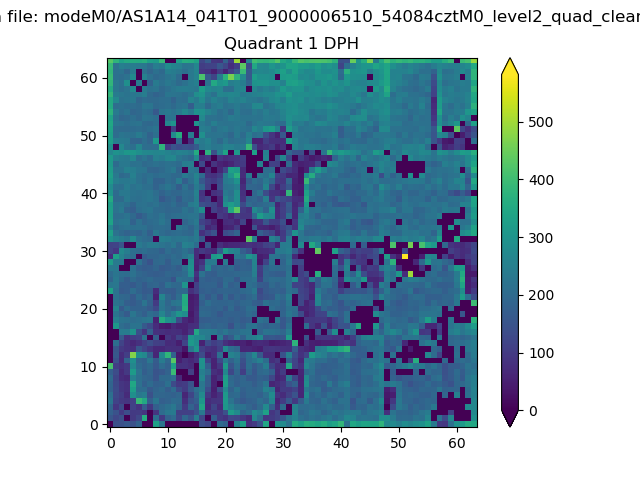 |
Quadrant B |
|---|---|---|---|
| Quadrant D | 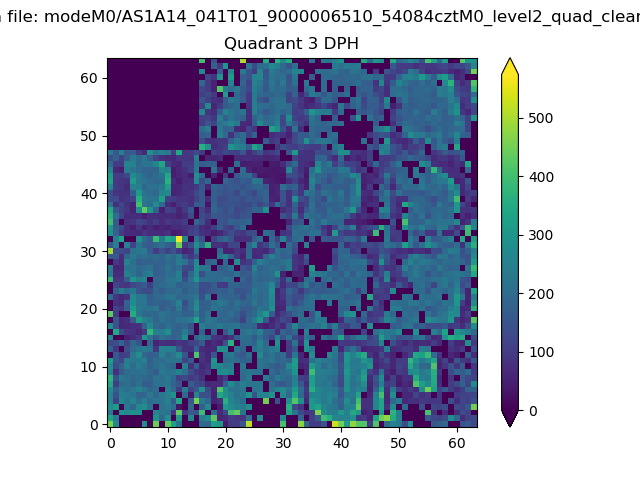 |
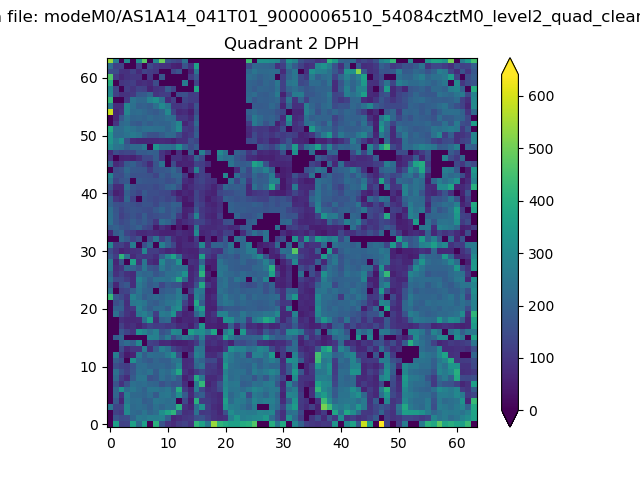 |
Quadrant C |
| Plot type | Count rate plots | Images |
|---|---|---|
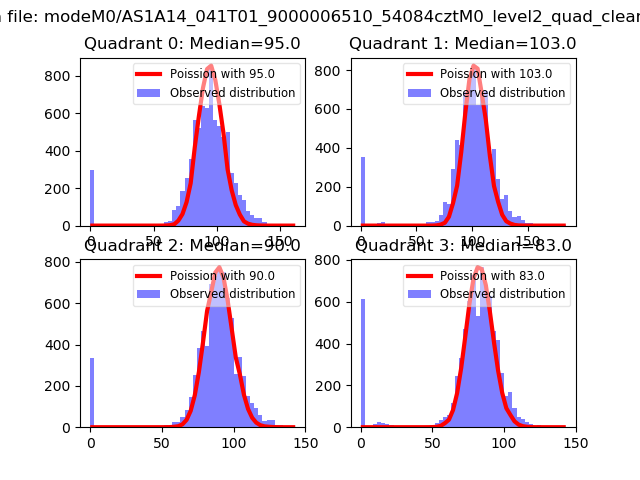
| Comparison with Poisson distribution Blue bars denote a histogram of data divided into 1 sec bins. Red curve is a Poisson curve with rate = median count rate of data. |
 |
 |
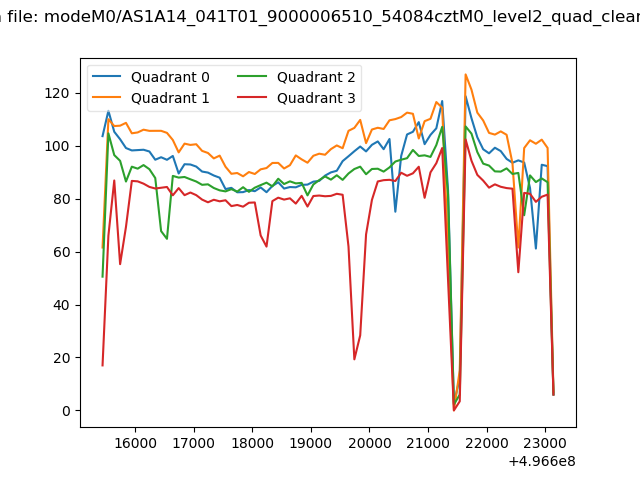
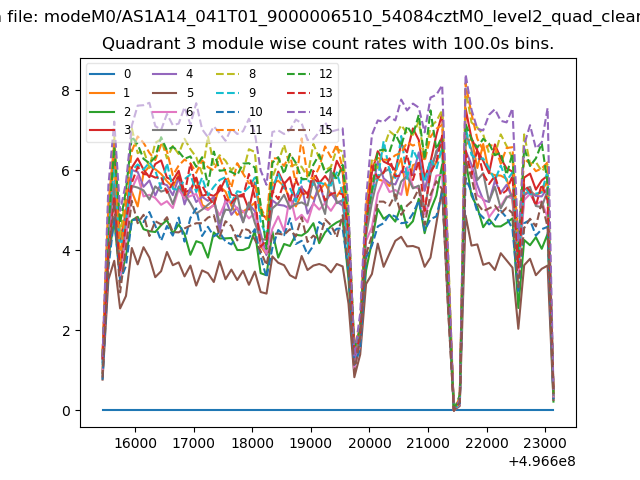
| Quadrant-wise count rates Data is divided into 100 sec bins |
 |
|
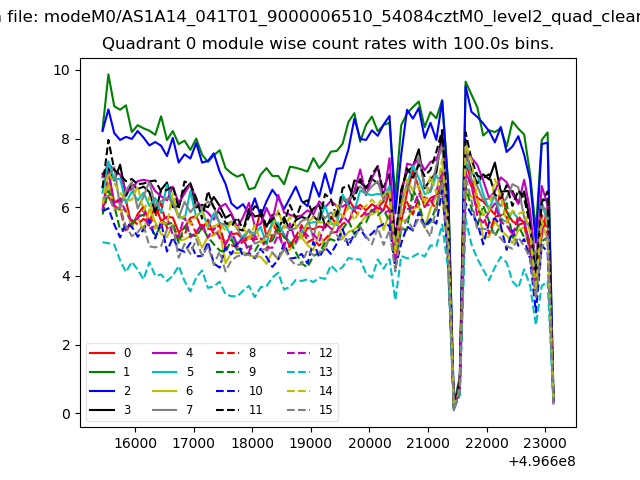
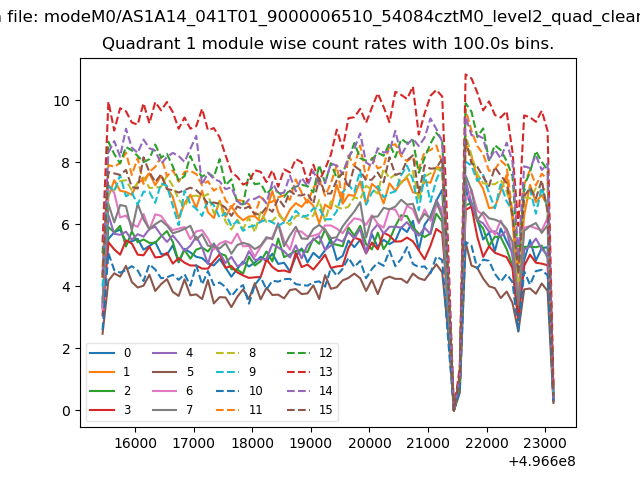
| Module-wise count rates for Quadrant A Data is divided into 100 sec bins |
 |
 |
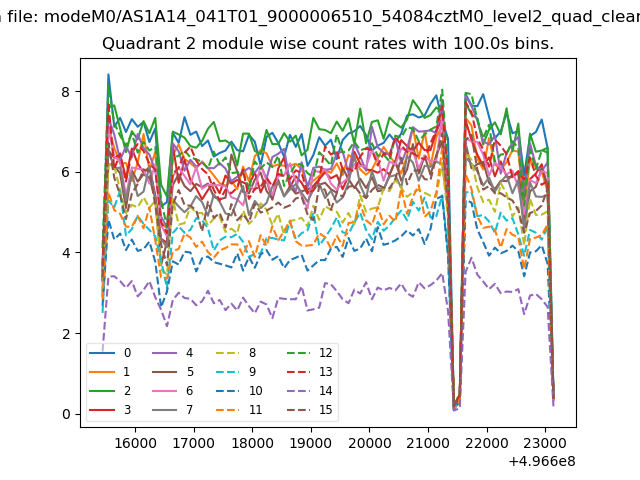
| Module-wise count rates for Quadrant B Data is divided into 100 sec bins |
 |
 |
| Module-wise count rates for Quadrant C Data is divided into 100 sec bins |
 |
 |
| Module-wise count rates for Quadrant D Data is divided into 100 sec bins |
 |
 |
| Parameter | Plot |
|---|---|
| CZT HV Monitor | 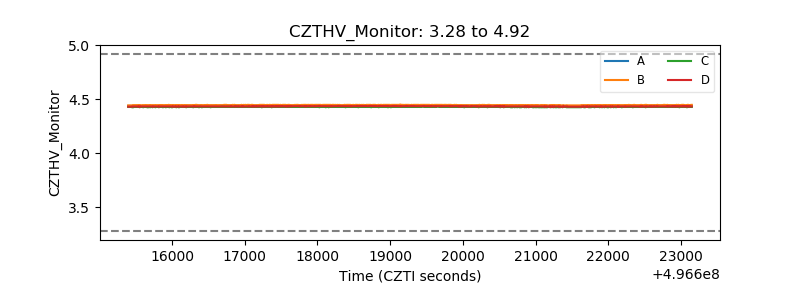 |
| D_VDD | 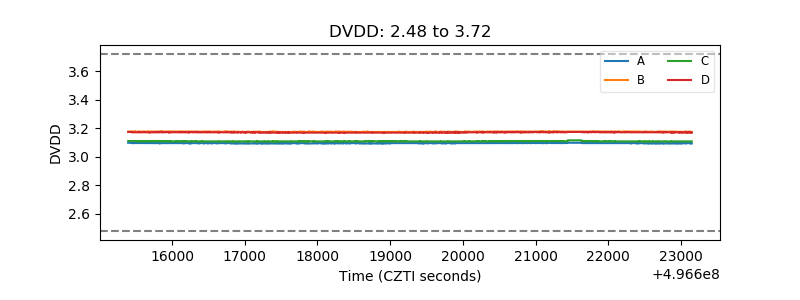 |
| Temperature 1 | 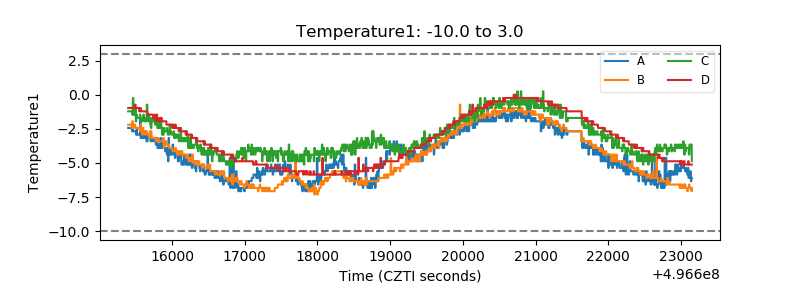 |
| Veto HV Monitor | 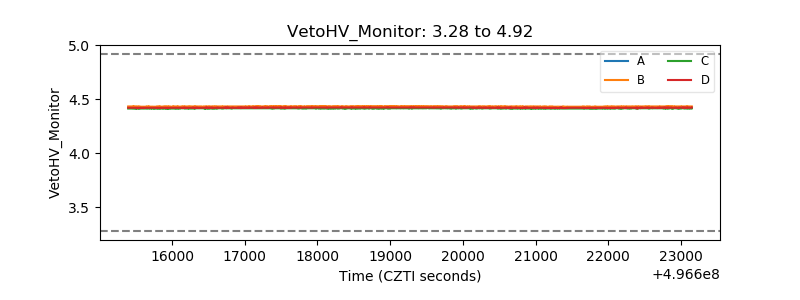 |
| Veto LLD | 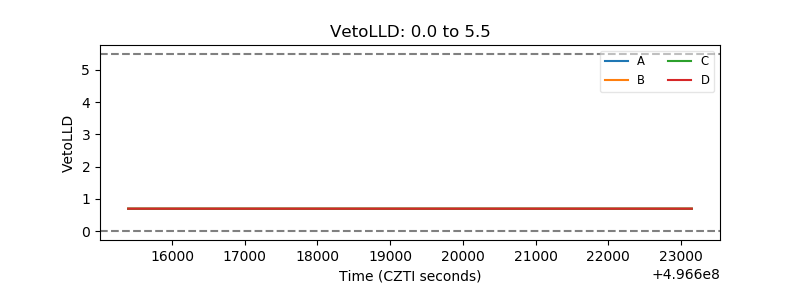 |
| Alpha Counter | 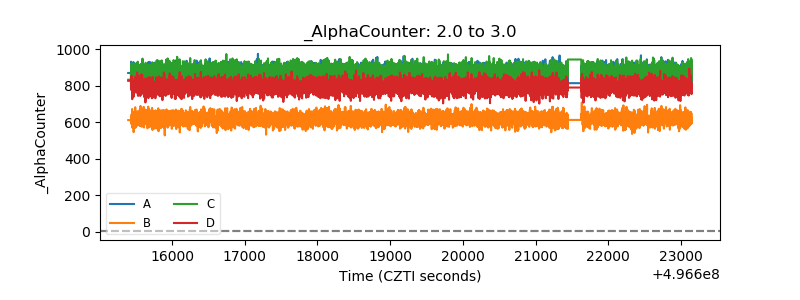 |
| _CPM_Rate |  |
| CZT Counter | 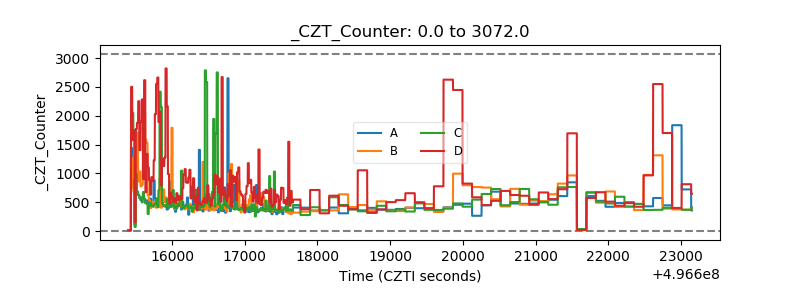 |
| +2.5 Volts monitor |  |
| +5 Volts monitor |  |
| _ROLL_ROT | 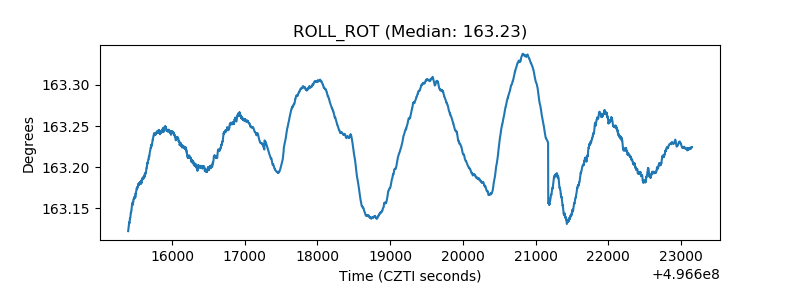 |
| _Roll_DEC | 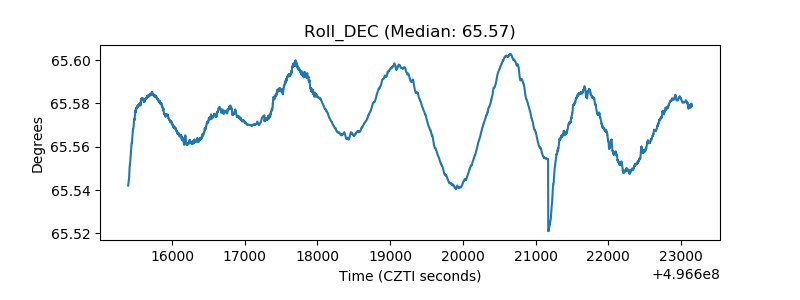 |
| _Roll_RA | 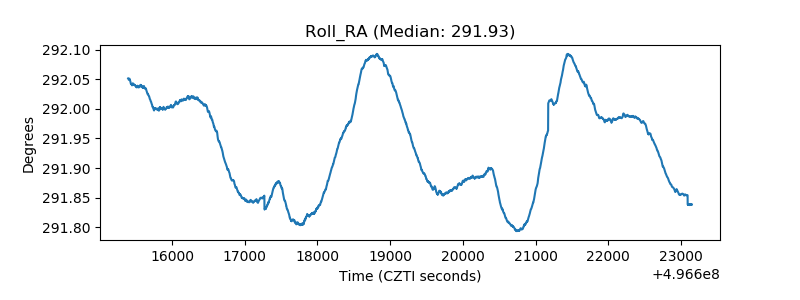 |
| Veto Counter | 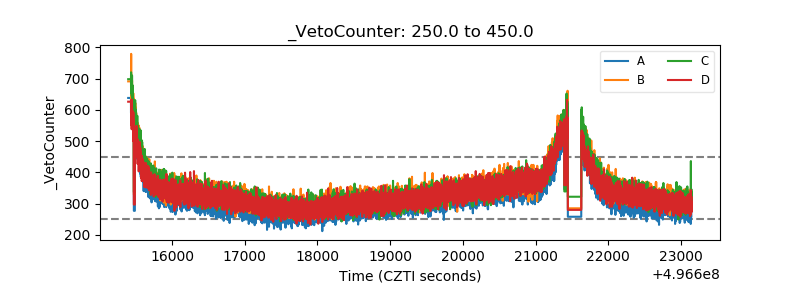 |