| Param | Original file | Final file |
|---|---|---|
| Filename | modeM0/AS1A14_041T01_9000006510_54085cztM0_level2.fits | modeM0/AS1A14_041T01_9000006510_54085cztM0_level2_quad_clean.evt |
| Size (bytes) | 523,872,000 | 114,166,080 |
| Size | 499.6 MB | 108.9 MB |
| Events in quadrant A | 4,297,237 | 735,966 |
| Events in quadrant B | 4,083,953 | 811,507 |
| Events in quadrant C | 4,207,506 | 712,604 |
| Events in quadrant D | 6,180,350 | 639,720 |
| Mode M9 | |||
|---|---|---|---|
| Quadrant | BADHDUFLAG | Total packets | Discarded packets |
| A | 0 | 3 | 0 |
| B | 0 | 3 | 0 |
| C | 0 | 3 | 0 |
| D | 0 | 3 | 0 |
| Mode SS | |||
|---|---|---|---|
| Quadrant | BADHDUFLAG | Total packets | Discarded packets |
| A | 0 | 164 | 0 |
| B | 0 | 164 | 0 |
| C | 0 | 162 | 0 |
| D | 0 | 162 | 0 |
| Mode M0 | |||
|---|---|---|---|
| Quadrant | BADHDUFLAG | Total packets | Discarded packets |
| A | 0 | 19014 | 1 |
| B | 0 | 18161 | 1 |
| C | 0 | 18397 | 1 |
| D | 0 | 24122 | 1 |
| Quadrant | Total seconds | Saturated seconds | Saturation percentage |
|---|---|---|---|
| A | 8017 | 281 | 3.505052% |
| B | 8017 | 190 | 2.369964% |
| C | 8016 | 150 | 1.871257% |
| D | 8017 | 473 | 5.899963% |
Noise dominated data is calculated using 1-second bins in cleaned event files. If a bin has >2000 counts, and if more than 50% of those come from <1% of pixels, then it is considered to be noise-dominated and hence unusable.
| Quadrant | # 1 sec bins | Bins with >0 counts | Bins with >2000 counts | High rate bins dominated by noise | Noise dominated (total time) | Noise dominated (detector-on time) | Marked lightcurve |
|---|---|---|---|---|---|---|---|
| A | 8227 | 8019 | 188 | 188 | 2.29% | 2.34% | 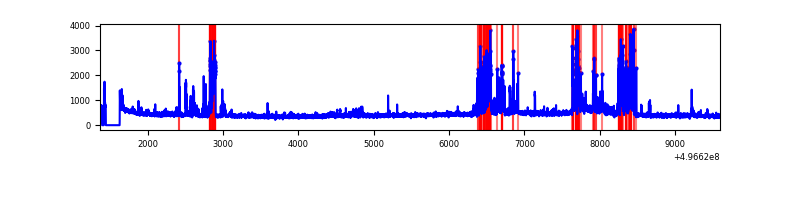 |
| B | 8227 | 8019 | 99 | 99 | 1.20% | 1.23% | 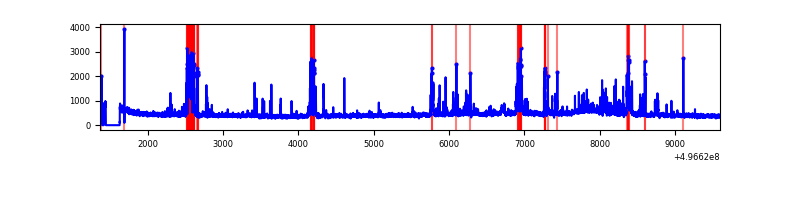 |
| C | 8226 | 8018 | 111 | 111 | 1.35% | 1.38% | 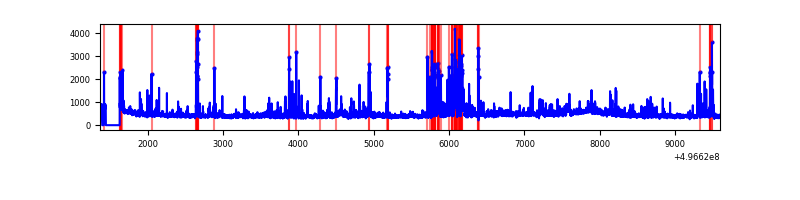 |
| D | 8227 | 8019 | 420 | 420 | 5.11% | 5.24% | 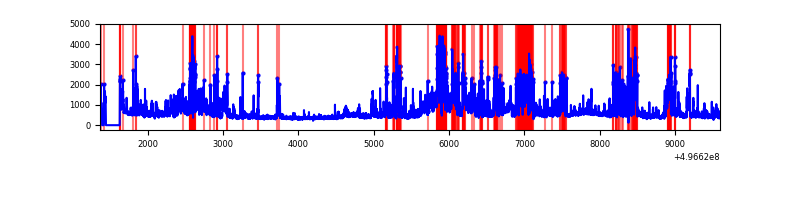 |
Top three noisy pixels from each quadrant. If the there are fewer than three noisy pixels in the level2.evt file, extra rows are filled as -1
| Pixel properties | Quadrant properties | ||||||
|---|---|---|---|---|---|---|---|
| Quadrant | DetID | PixID | Counts | Sigma | Mean | Median | Sigma |
| A | 15 | 174 | 860749 | 4183.46 | 834 | 811 | 205.6 |
| A | 0 | 8 | 57752 | 277.01 | 834 | 811 | 205.6 |
| A | 3 | 14 | 46388 | 221.72 | 834 | 811 | 205.6 |
| B | 7 | 252 | 242472 | 1337.33 | 844 | 811 | 180.7 |
| B | 5 | 236 | 148109 | 815.13 | 844 | 811 | 180.7 |
| B | 0 | 213 | 136998 | 753.65 | 844 | 811 | 180.7 |
| C | 15 | 233 | 352401 | 1541.0 | 830 | 821 | 228.2 |
| C | 12 | 252 | 236552 | 1033.22 | 830 | 821 | 228.2 |
| C | 13 | 3 | 113262 | 492.84 | 830 | 821 | 228.2 |
| D | 8 | 176 | 1739535 | 7634.49 | 803 | 767 | 227.8 |
| D | 11 | 176 | 302820 | 1326.24 | 803 | 767 | 227.8 |
| D | 2 | 165 | 262571 | 1149.52 | 803 | 767 | 227.8 |
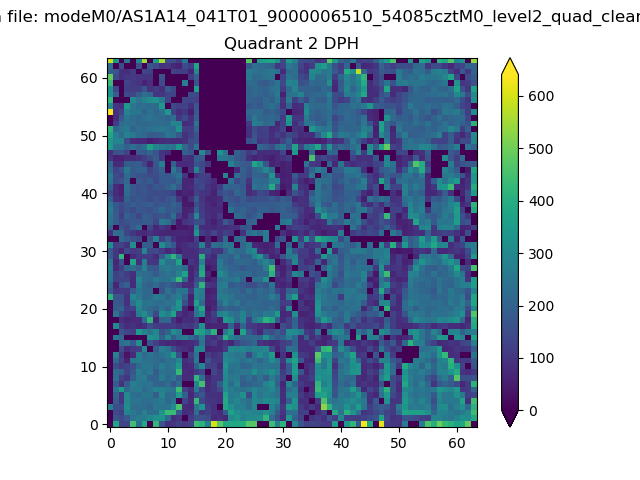
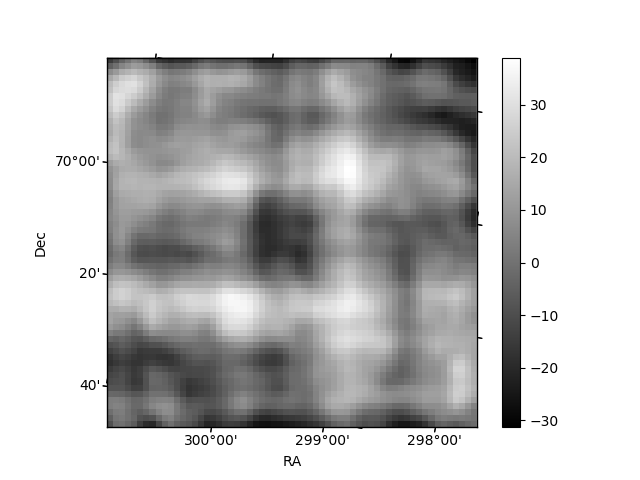
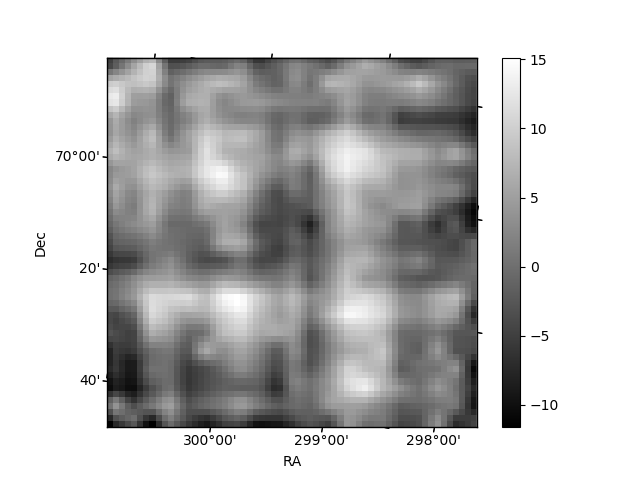
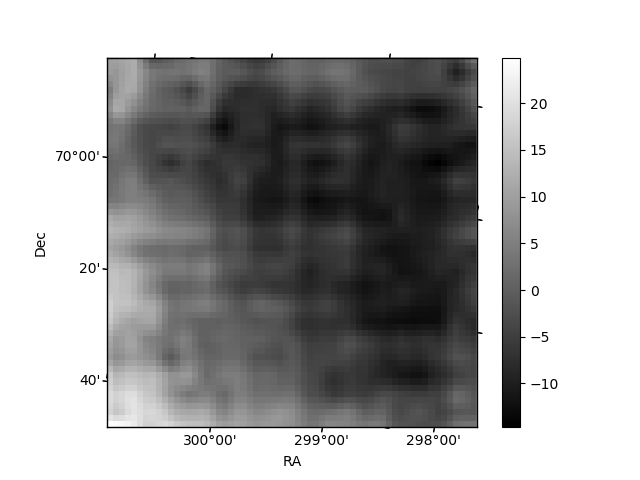
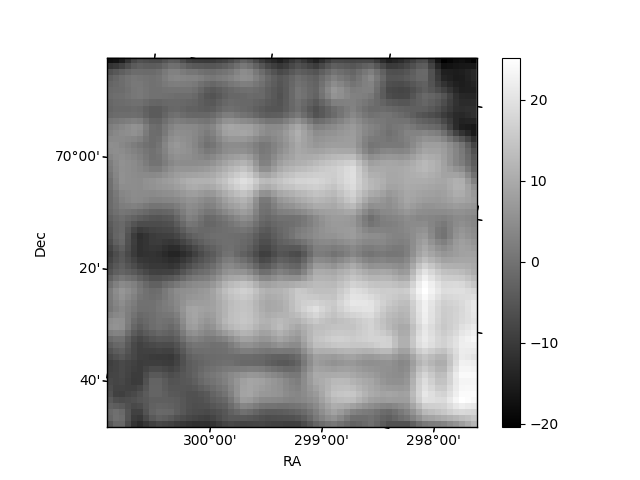
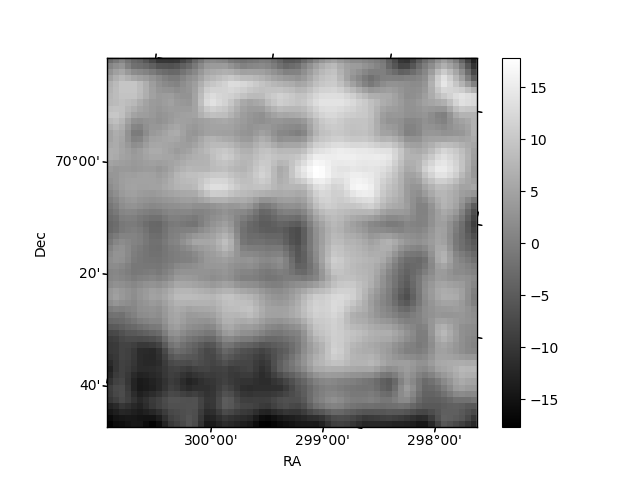
Histogram calculated using DETX and DETY for each event in the final _common_clean file
| Quadrant A | 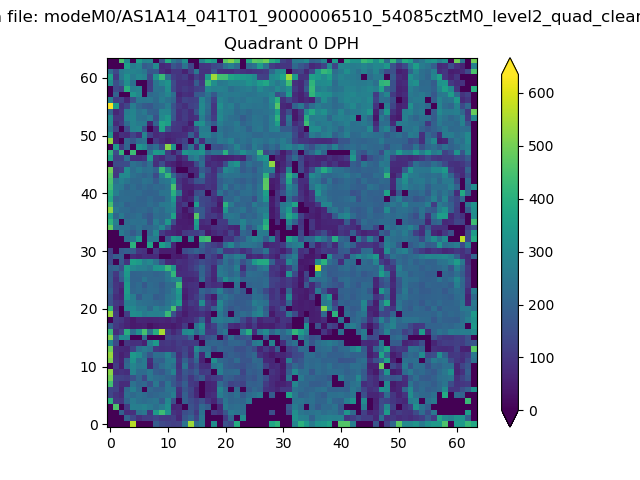 |
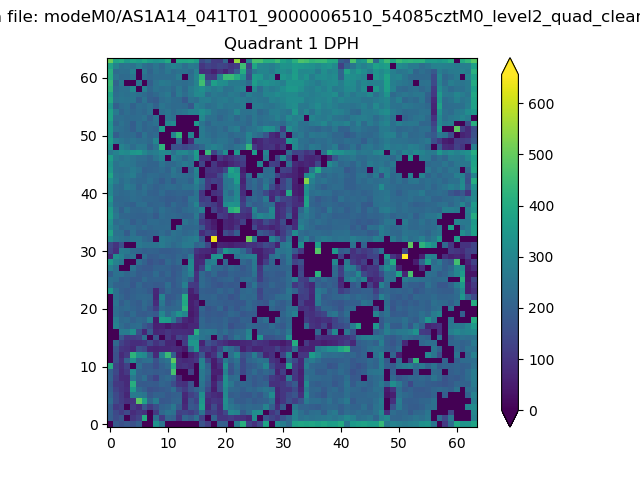 |
Quadrant B |
|---|---|---|---|
| Quadrant D | 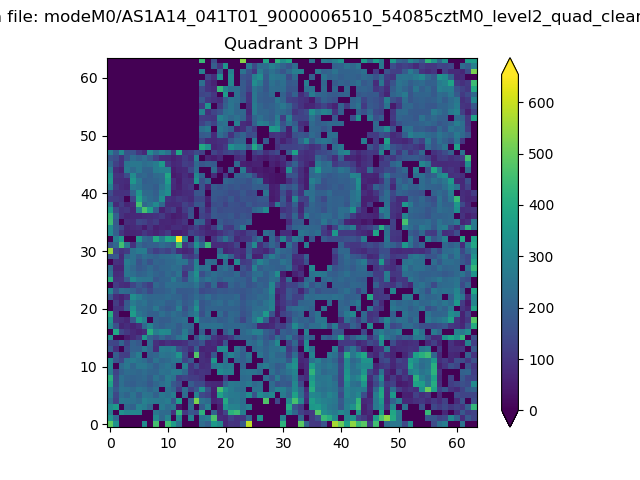 |
 |
Quadrant C |
| Plot type | Count rate plots | Images |
|---|---|---|
| Comparison with Poisson distribution Blue bars denote a histogram of data divided into 1 sec bins. Red curve is a Poisson curve with rate = median count rate of data. |
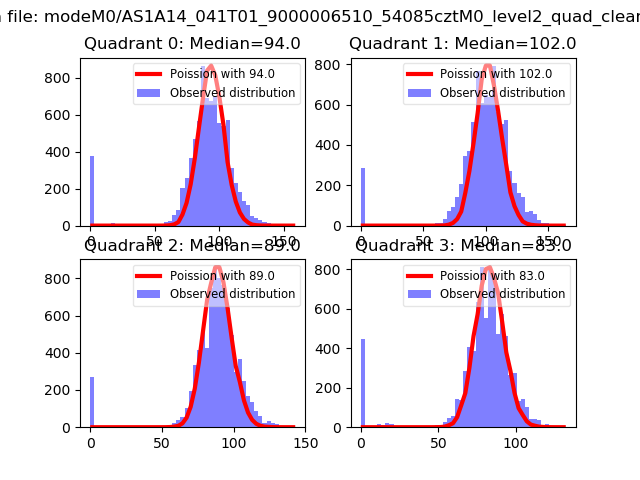 |
 |
| Quadrant-wise count rates Data is divided into 100 sec bins |
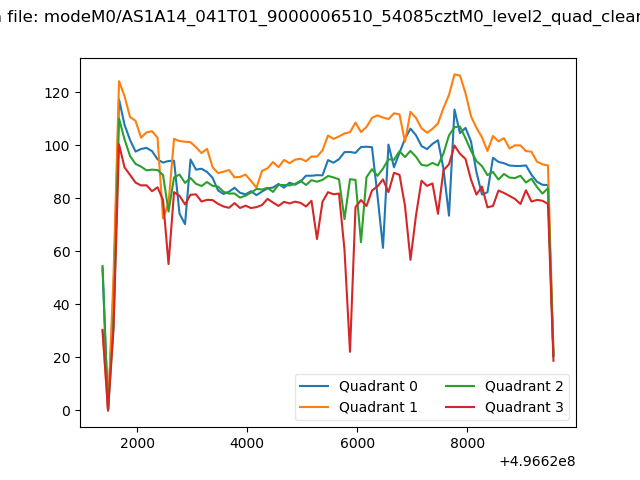 |
|
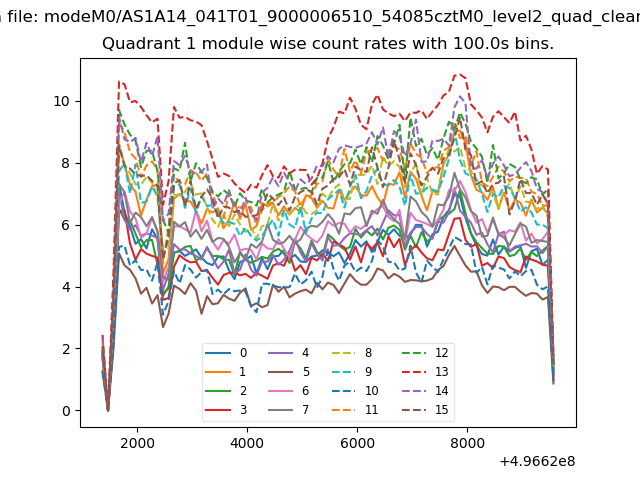
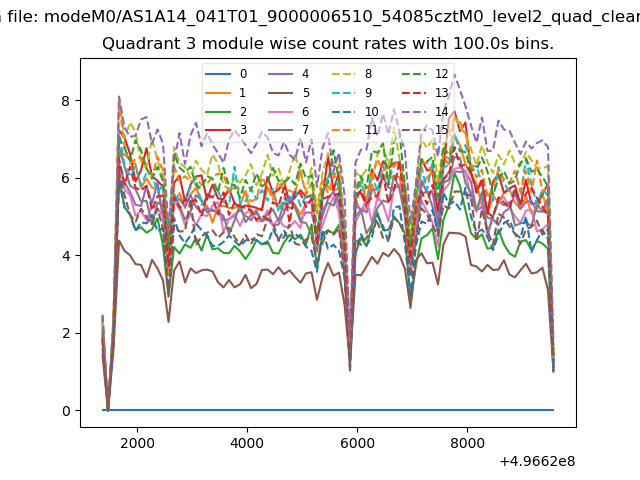
| Module-wise count rates for Quadrant A Data is divided into 100 sec bins |
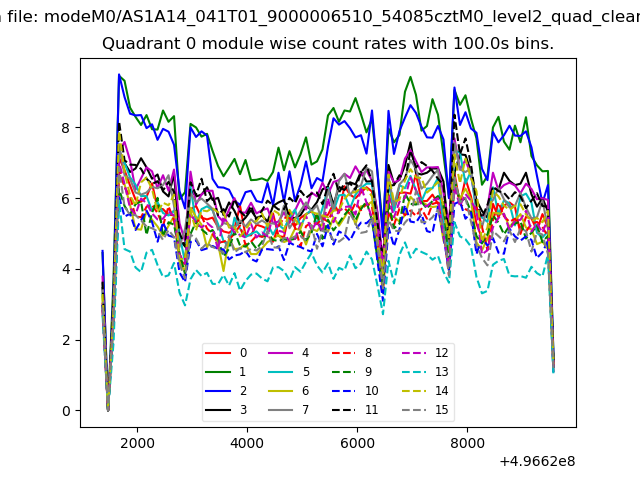 |
 |
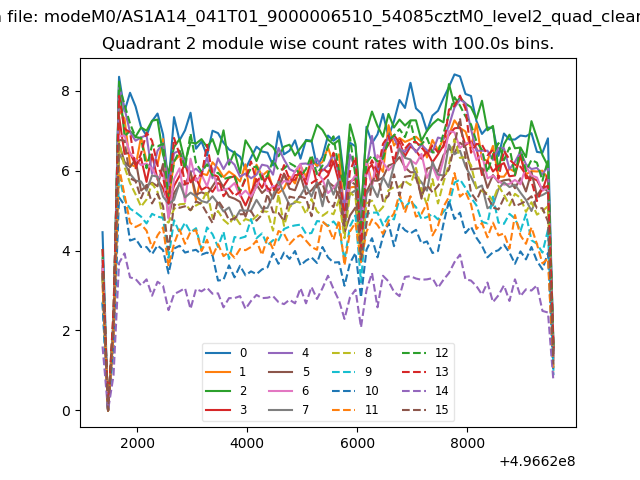
| Module-wise count rates for Quadrant B Data is divided into 100 sec bins |
 |
 |
| Module-wise count rates for Quadrant C Data is divided into 100 sec bins |
 |
 |
| Module-wise count rates for Quadrant D Data is divided into 100 sec bins |
 |
 |
| Parameter | Plot |
|---|---|
| CZT HV Monitor | 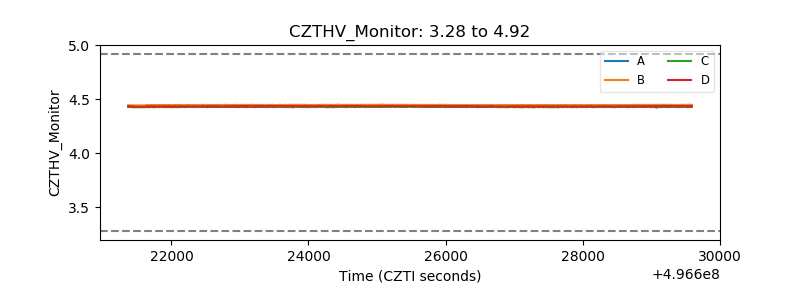 |
| D_VDD | 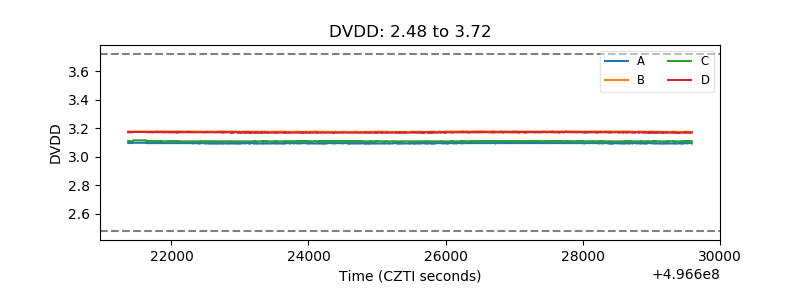 |
| Temperature 1 | 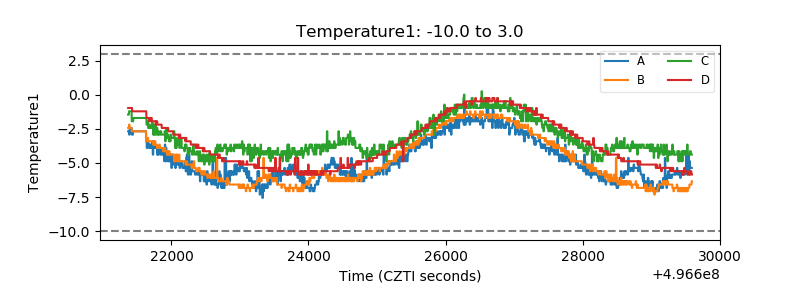 |
| Veto HV Monitor | 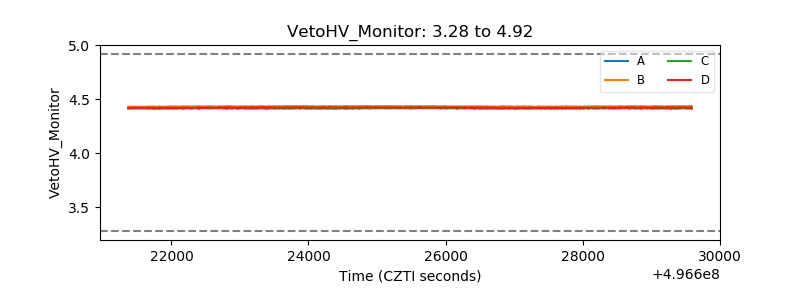 |
| Veto LLD | 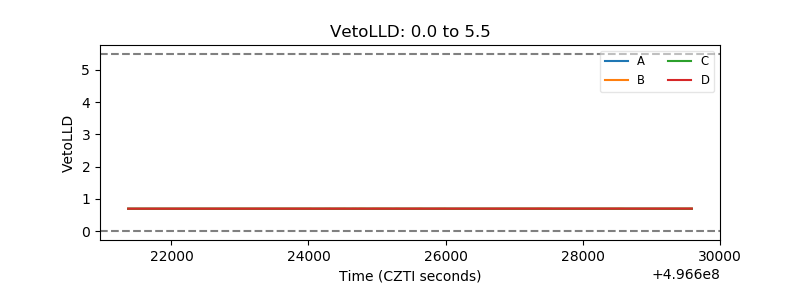 |
| Alpha Counter | 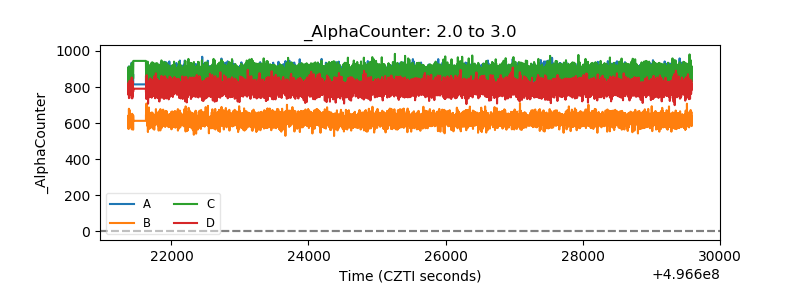 |
| _CPM_Rate | 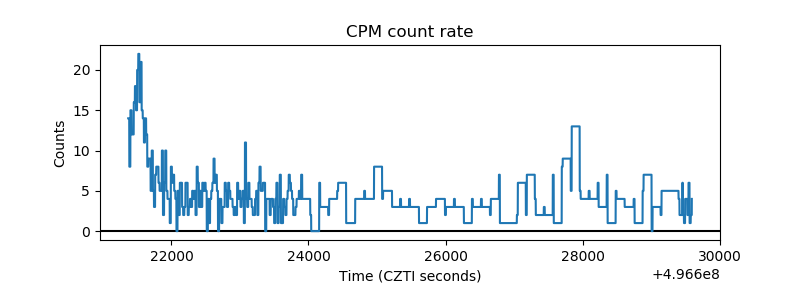 |
| CZT Counter | 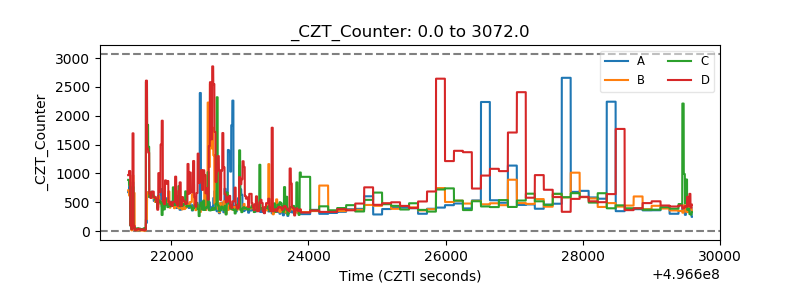 |
| +2.5 Volts monitor |  |
| +5 Volts monitor |  |
| _ROLL_ROT | 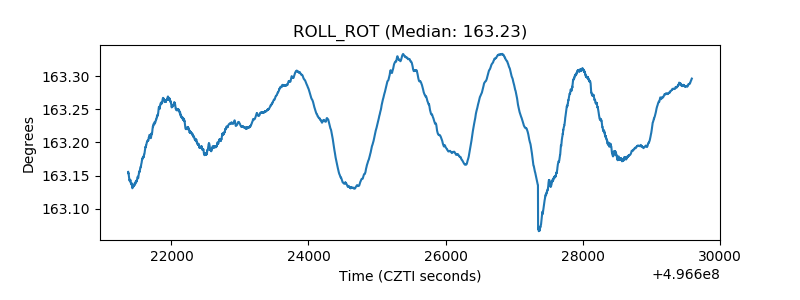 |
| _Roll_DEC | 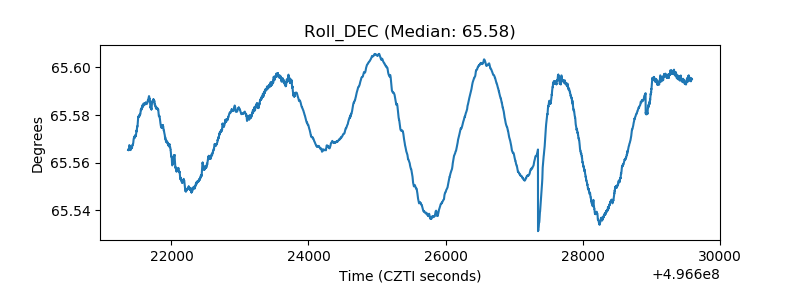 |
| _Roll_RA | 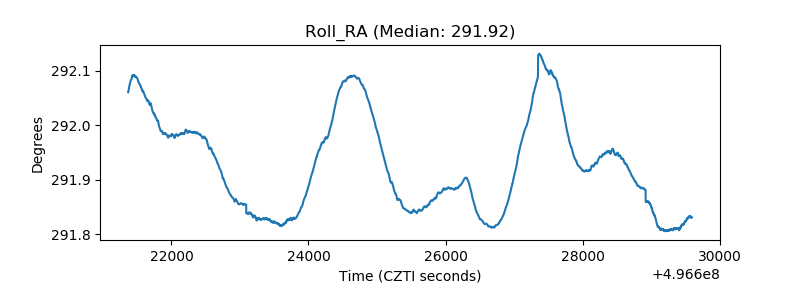 |
| Veto Counter | 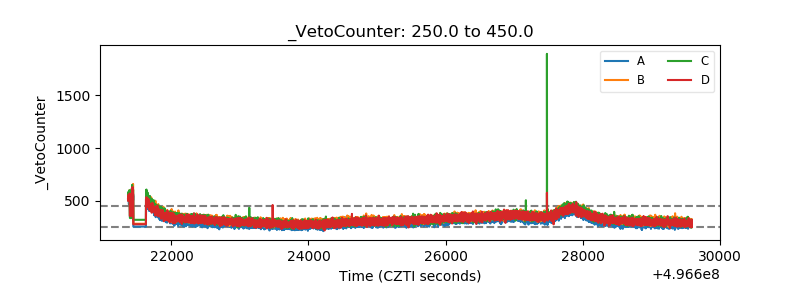 |