| Param | Original file | Final file |
|---|---|---|
| Filename | modeM0/AS1A14_041T01_9000006510_54086cztM0_level2.fits | modeM0/AS1A14_041T01_9000006510_54086cztM0_level2_quad_clean.evt |
| Size (bytes) | 531,976,320 | 119,966,400 |
| Size | 507.3 MB | 114.4 MB |
| Events in quadrant A | 4,423,350 | 766,284 |
| Events in quadrant B | 4,209,230 | 845,487 |
| Events in quadrant C | 4,460,106 | 747,193 |
| Events in quadrant D | 5,946,384 | 689,187 |
| Mode SS | |||
|---|---|---|---|
| Quadrant | BADHDUFLAG | Total packets | Discarded packets |
| A | 0 | 170 | 0 |
| B | 0 | 170 | 0 |
| C | 0 | 170 | 0 |
| D | 0 | 170 | 0 |
| Mode M0 | |||
|---|---|---|---|
| Quadrant | BADHDUFLAG | Total packets | Discarded packets |
| A | 0 | 19672 | 0 |
| B | 0 | 18929 | 0 |
| C | 0 | 19566 | 0 |
| D | 0 | 23348 | 0 |
| Quadrant | Total seconds | Saturated seconds | Saturation percentage |
|---|---|---|---|
| A | 8406 | 276 | 3.283369% |
| B | 8407 | 218 | 2.593077% |
| C | 8407 | 148 | 1.760438% |
| D | 8406 | 259 | 3.081133% |
Noise dominated data is calculated using 1-second bins in cleaned event files. If a bin has >2000 counts, and if more than 50% of those come from <1% of pixels, then it is considered to be noise-dominated and hence unusable.
| Quadrant | # 1 sec bins | Bins with >0 counts | Bins with >2000 counts | High rate bins dominated by noise | Noise dominated (total time) | Noise dominated (detector-on time) | Marked lightcurve |
|---|---|---|---|---|---|---|---|
| A | 8406 | 8406 | 167 | 167 | 1.99% | 1.99% | 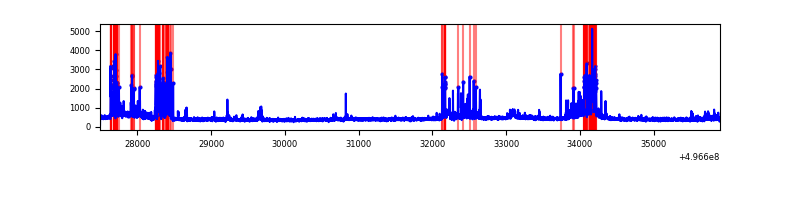 |
| B | 8407 | 8407 | 75 | 75 | 0.89% | 0.89% | 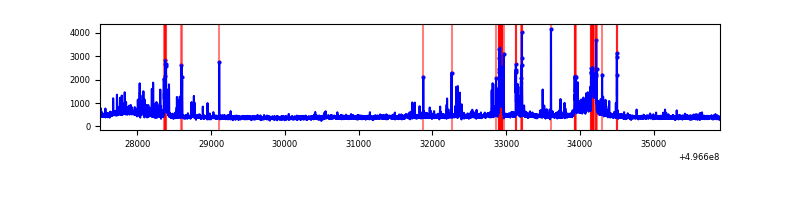 |
| C | 8407 | 8407 | 105 | 105 | 1.25% | 1.25% | 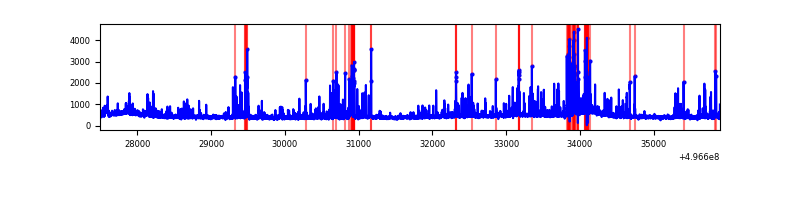 |
| D | 8406 | 8406 | 263 | 263 | 3.13% | 3.13% | 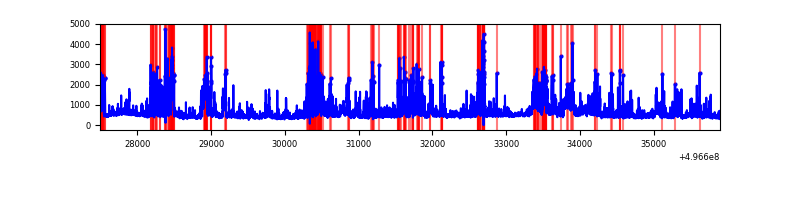 |
Top three noisy pixels from each quadrant. If the there are fewer than three noisy pixels in the level2.evt file, extra rows are filled as -1
| Pixel properties | Quadrant properties | ||||||
|---|---|---|---|---|---|---|---|
| Quadrant | DetID | PixID | Counts | Sigma | Mean | Median | Sigma |
| A | 15 | 174 | 826011 | 3805.76 | 874 | 853 | 216.8 |
| A | 5 | 243 | 36756 | 165.59 | 874 | 853 | 216.8 |
| A | 3 | 14 | 33894 | 152.39 | 874 | 853 | 216.8 |
| B | 7 | 252 | 220726 | 1167.7 | 885 | 853 | 188.3 |
| B | 0 | 213 | 195153 | 1031.89 | 885 | 853 | 188.3 |
| B | 5 | 185 | 80566 | 423.34 | 885 | 853 | 188.3 |
| C | 13 | 3 | 344411 | 1442.95 | 867 | 856 | 238.1 |
| C | 1 | 16 | 230035 | 962.56 | 867 | 856 | 238.1 |
| C | 12 | 252 | 137157 | 572.47 | 867 | 856 | 238.1 |
| D | 8 | 176 | 760469 | 3141.43 | 855 | 819 | 241.8 |
| D | 2 | 165 | 617475 | 2550.1 | 855 | 819 | 241.8 |
| D | 1 | 4 | 309303 | 1275.69 | 855 | 819 | 241.8 |
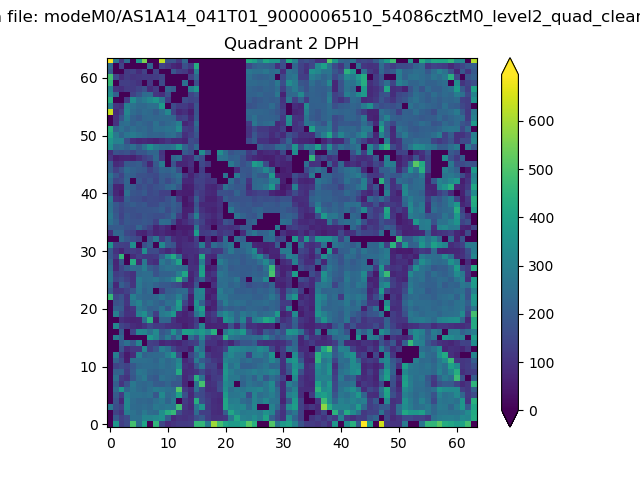
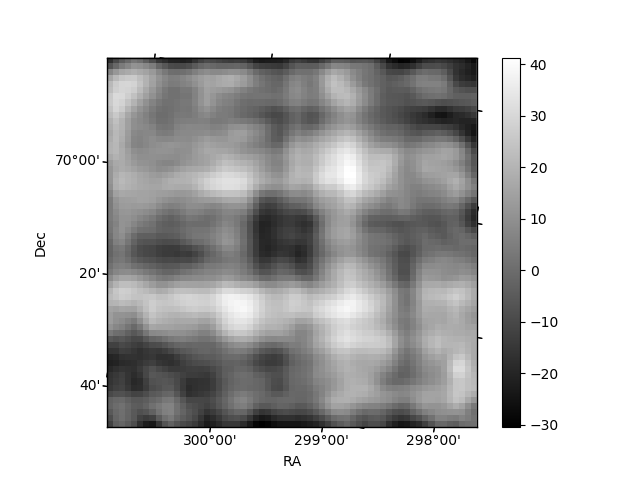
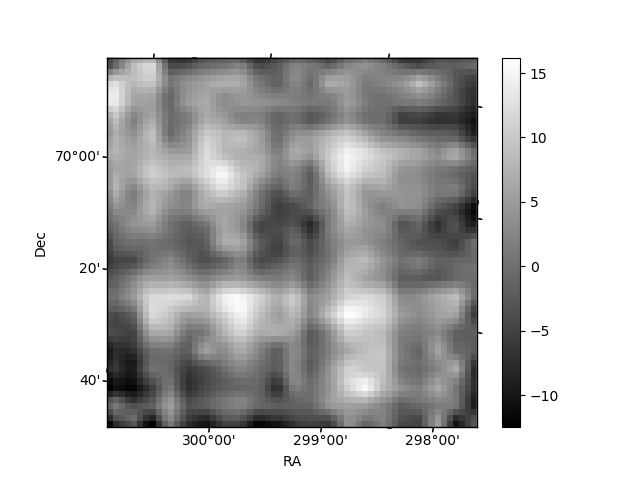
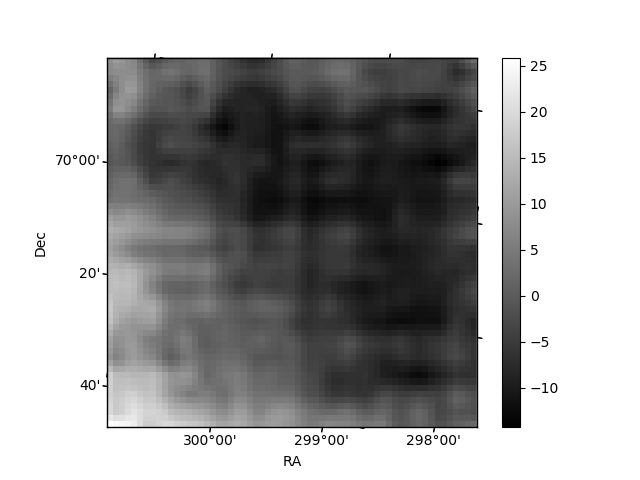
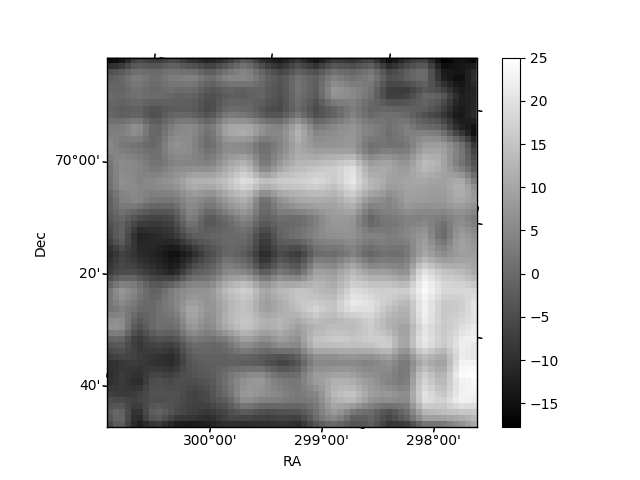
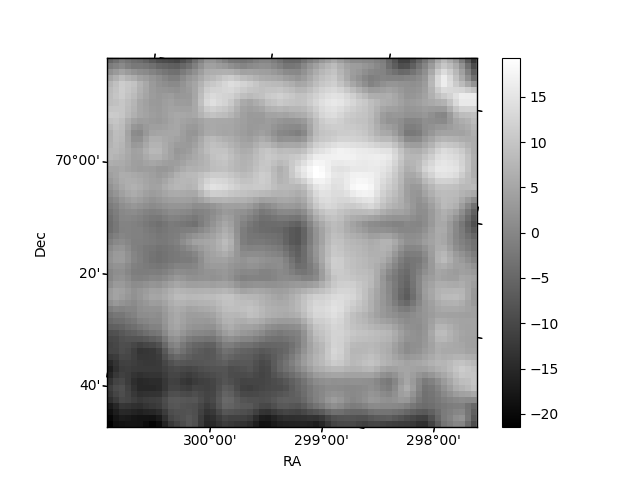
Histogram calculated using DETX and DETY for each event in the final _common_clean file
| Quadrant A | 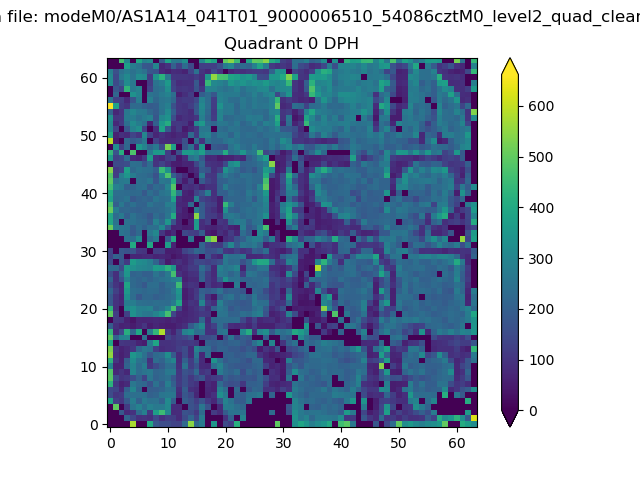 |
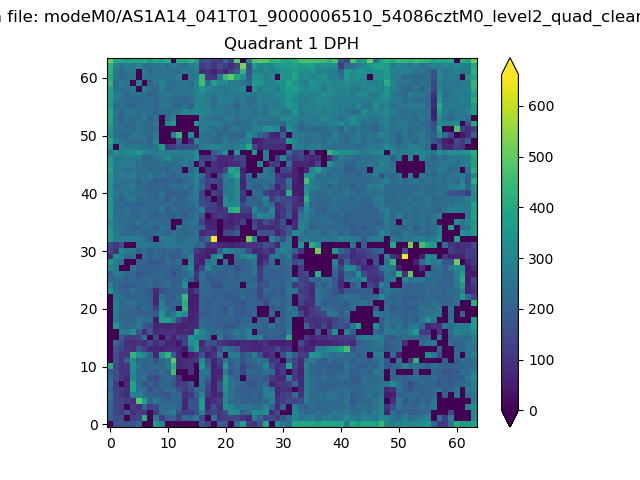 |
Quadrant B |
|---|---|---|---|
| Quadrant D | 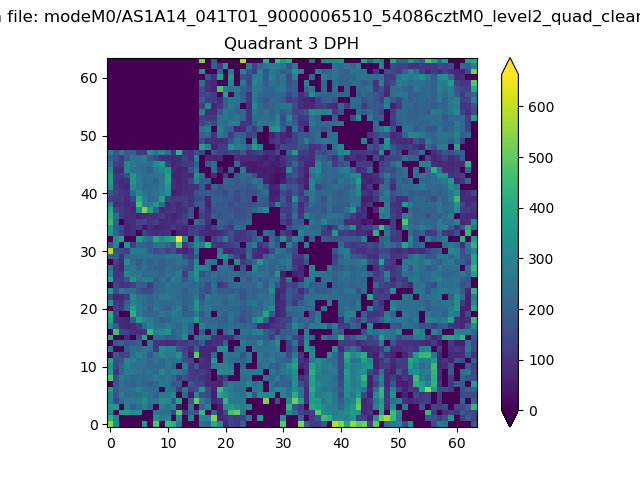 |
 |
Quadrant C |
| Plot type | Count rate plots | Images |
|---|---|---|
| Comparison with Poisson distribution Blue bars denote a histogram of data divided into 1 sec bins. Red curve is a Poisson curve with rate = median count rate of data. |
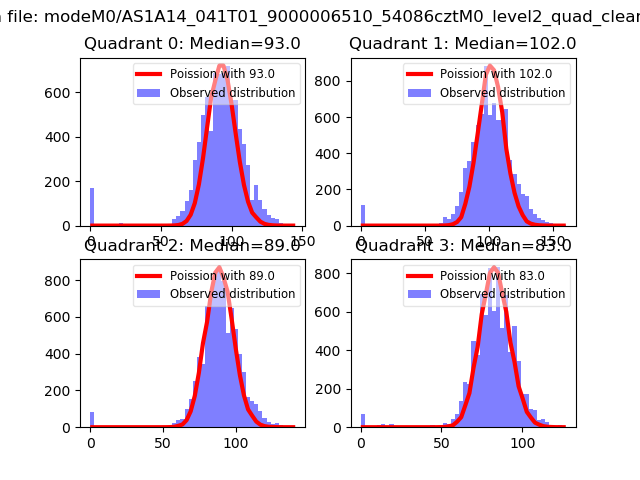 |
 |
| Quadrant-wise count rates Data is divided into 100 sec bins |
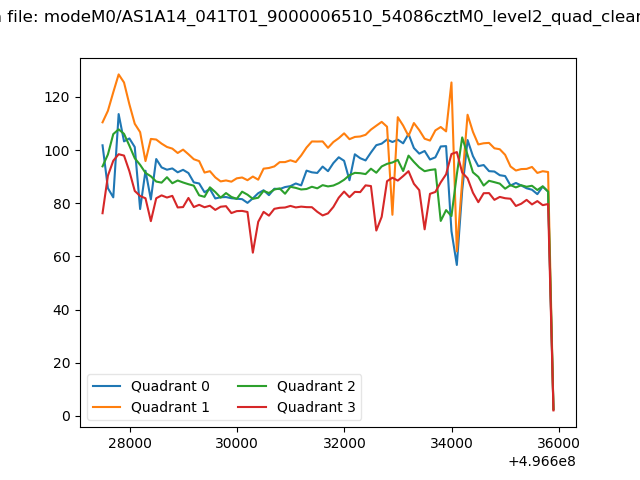 |
|
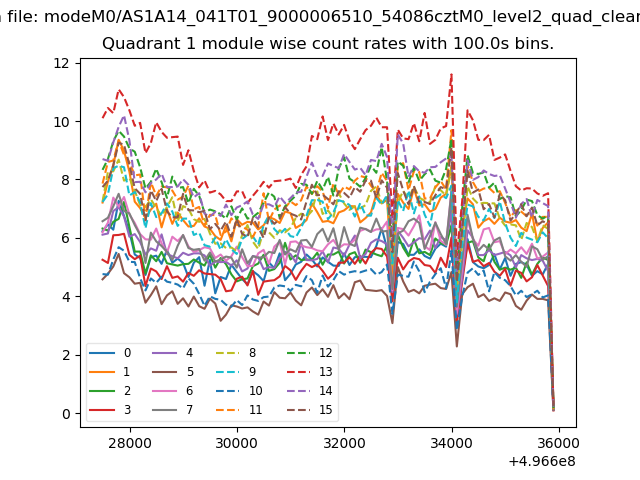
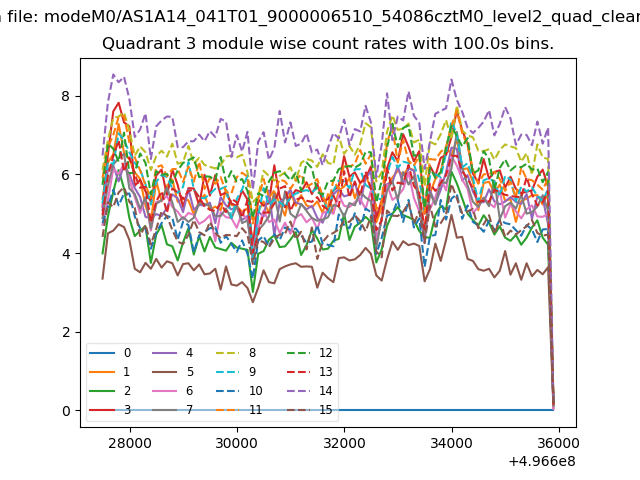
| Module-wise count rates for Quadrant A Data is divided into 100 sec bins |
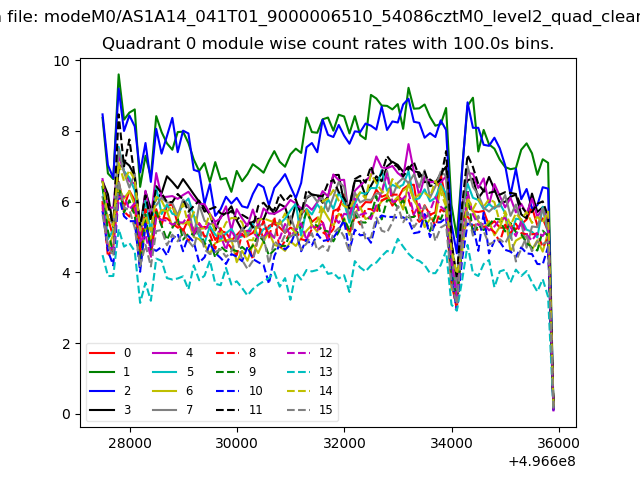 |
 |
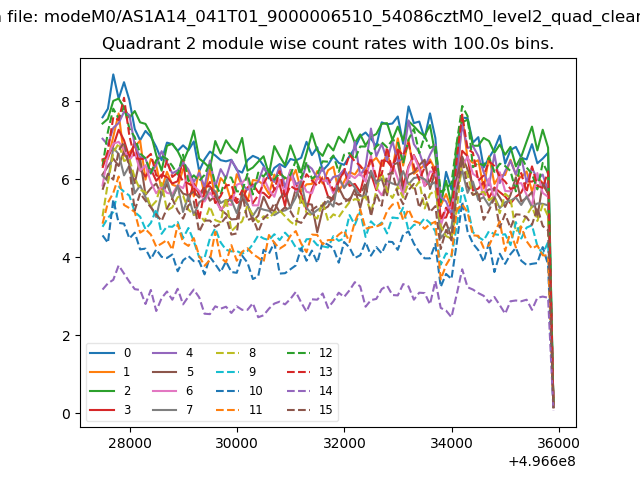
| Module-wise count rates for Quadrant B Data is divided into 100 sec bins |
 |
 |
| Module-wise count rates for Quadrant C Data is divided into 100 sec bins |
 |
 |
| Module-wise count rates for Quadrant D Data is divided into 100 sec bins |
 |
 |
| Parameter | Plot |
|---|---|
| CZT HV Monitor | 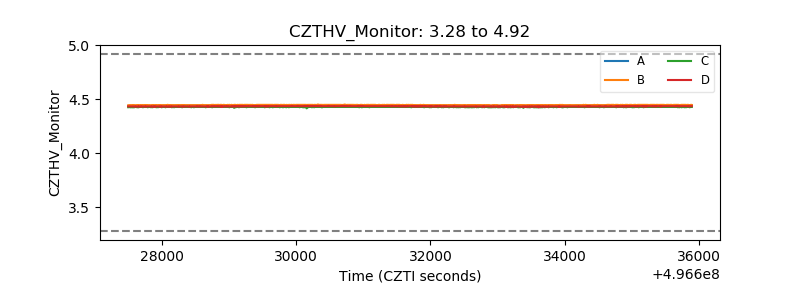 |
| D_VDD | 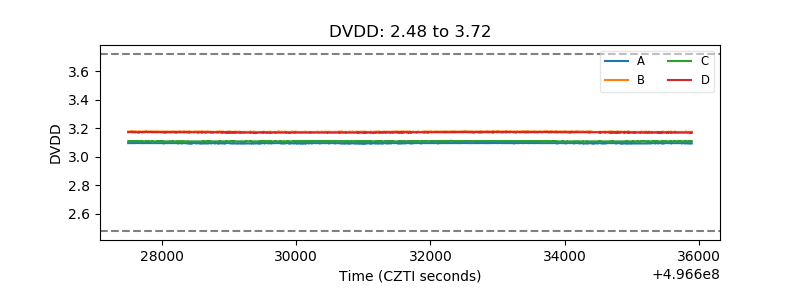 |
| Temperature 1 | 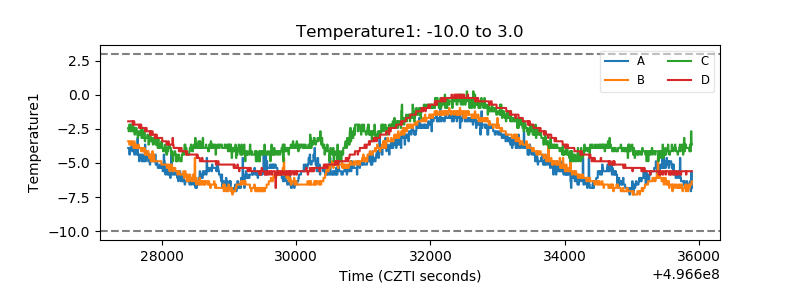 |
| Veto HV Monitor | 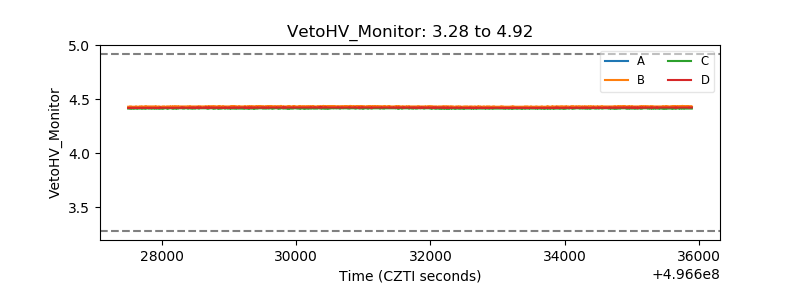 |
| Veto LLD | 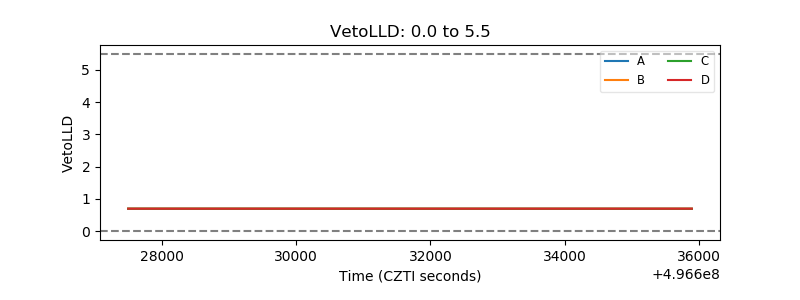 |
| Alpha Counter | 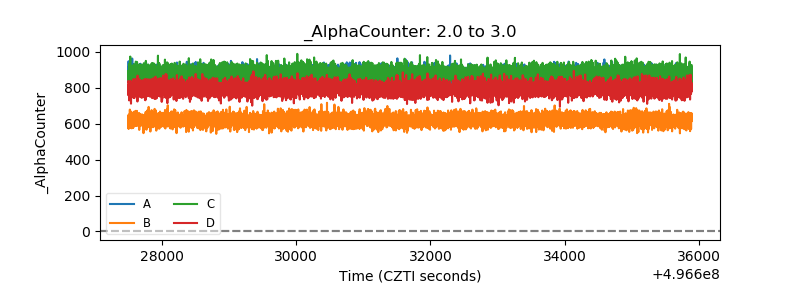 |
| _CPM_Rate | 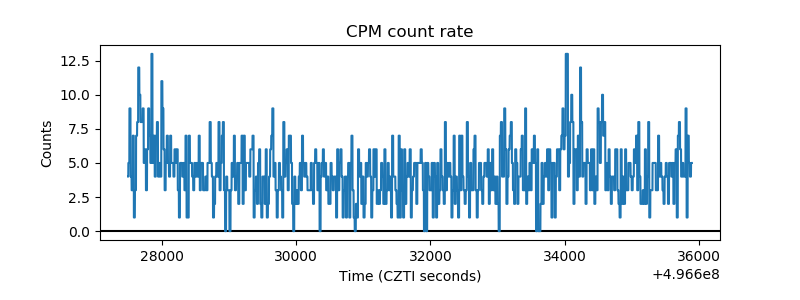 |
| CZT Counter | 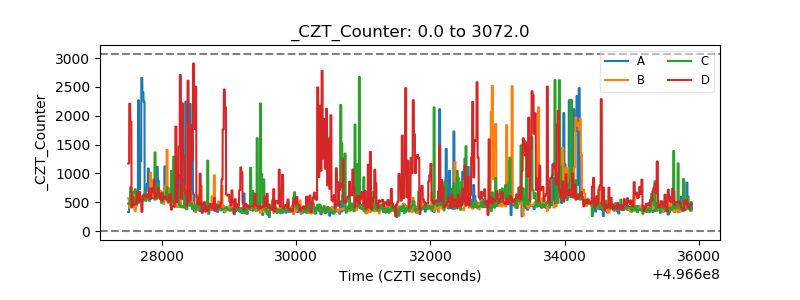 |
| +2.5 Volts monitor |  |
| +5 Volts monitor |  |
| _ROLL_ROT | 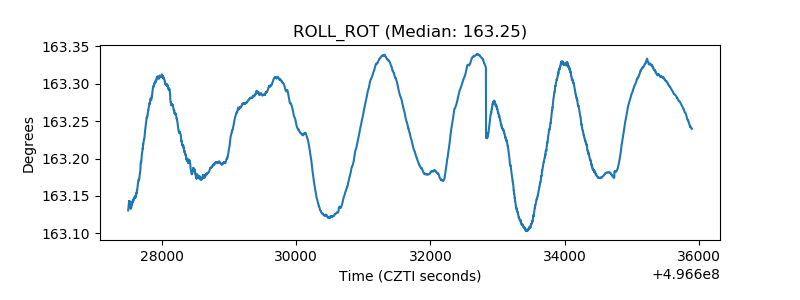 |
| _Roll_DEC | 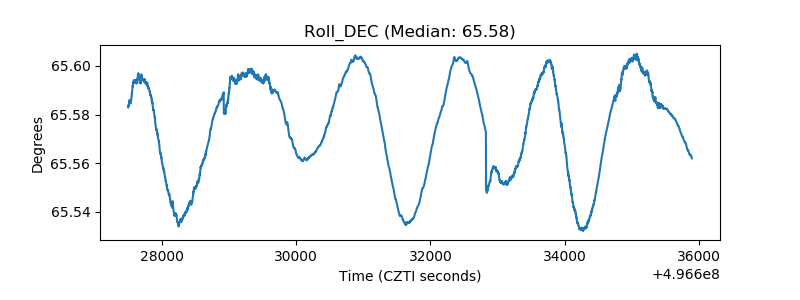 |
| _Roll_RA | 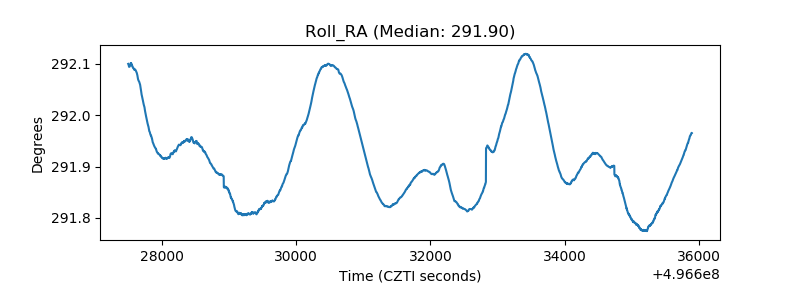 |
| Veto Counter | 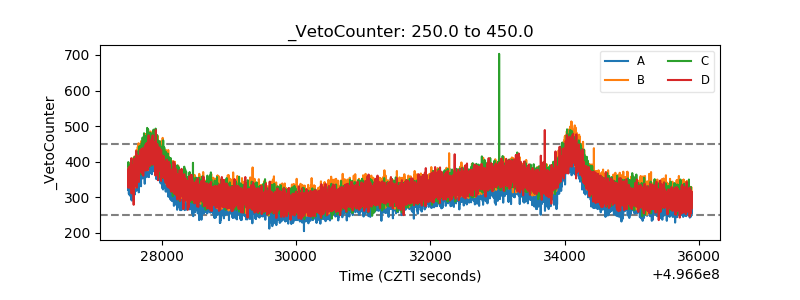 |