| Param | Original file | Final file |
|---|---|---|
| Filename | modeM0/AS1A14_041T01_9000006510_54089cztM0_level2.fits | modeM0/AS1A14_041T01_9000006510_54089cztM0_level2_quad_clean.evt |
| Size (bytes) | 1,428,022,080 | 273,409,920 |
| Size | 1.3 GB | 260.7 MB |
| Events in quadrant A | 12,680,216 | 1,728,652 |
| Events in quadrant B | 10,330,149 | 1,945,586 |
| Events in quadrant C | 10,972,119 | 1,725,669 |
| Events in quadrant D | 17,338,571 | 1,506,555 |
| Mode M9 | |||
|---|---|---|---|
| Quadrant | BADHDUFLAG | Total packets | Discarded packets |
| A | 0 | 11 | 0 |
| B | 0 | 11 | 0 |
| C | 0 | 11 | 0 |
| D | 0 | 11 | 0 |
| Mode SS | |||
|---|---|---|---|
| Quadrant | BADHDUFLAG | Total packets | Discarded packets |
| A | 0 | 404 | 0 |
| B | 0 | 404 | 0 |
| C | 0 | 404 | 0 |
| D | 0 | 404 | 0 |
| Mode M0 | |||
|---|---|---|---|
| Quadrant | BADHDUFLAG | Total packets | Discarded packets |
| A | 0 | 52405 | 3 |
| B | 0 | 45439 | 3 |
| C | 0 | 47174 | 3 |
| D | 0 | 65137 | 3 |
| Quadrant | Total seconds | Saturated seconds | Saturation percentage |
|---|---|---|---|
| A | 19906 | 1289 | 6.475435% |
| B | 19907 | 766 | 3.847893% |
| C | 19907 | 429 | 2.155021% |
| D | 19907 | 1528 | 7.675692% |
Noise dominated data is calculated using 1-second bins in cleaned event files. If a bin has >2000 counts, and if more than 50% of those come from <1% of pixels, then it is considered to be noise-dominated and hence unusable.
| Quadrant | # 1 sec bins | Bins with >0 counts | Bins with >2000 counts | High rate bins dominated by noise | Noise dominated (total time) | Noise dominated (detector-on time) | Marked lightcurve |
|---|---|---|---|---|---|---|---|
| A | 21051 | 19909 | 807 | 807 | 3.83% | 4.05% | 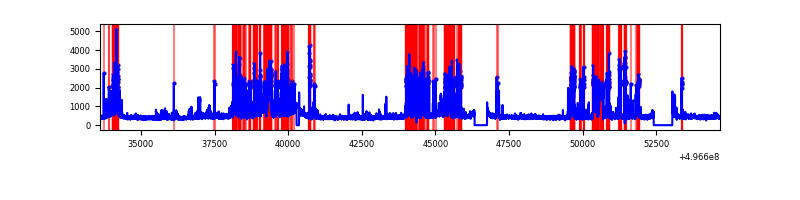 |
| B | 21052 | 19910 | 226 | 226 | 1.07% | 1.14% | 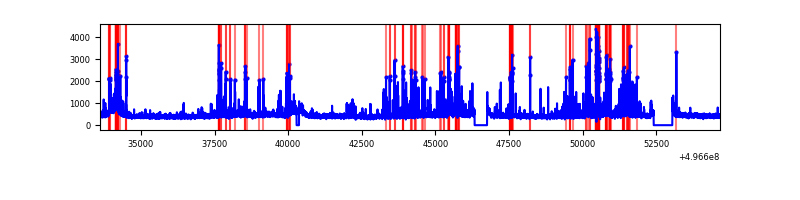 |
| C | 21052 | 19910 | 184 | 184 | 0.87% | 0.92% | 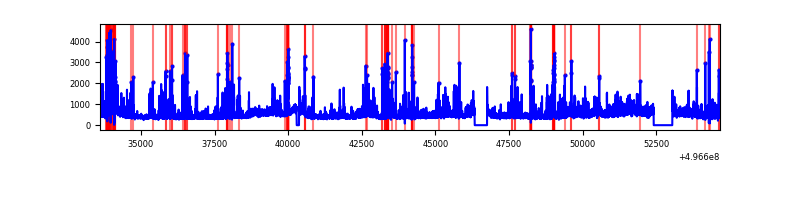 |
| D | 21052 | 19910 | 1129 | 1129 | 5.36% | 5.67% | 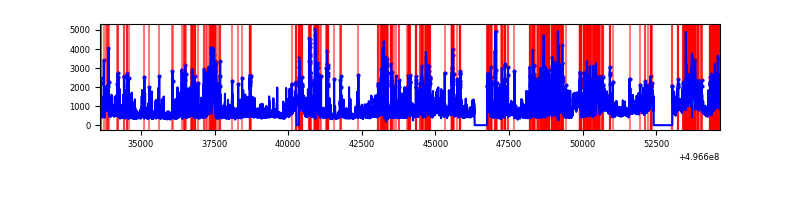 |
Top three noisy pixels from each quadrant. If the there are fewer than three noisy pixels in the level2.evt file, extra rows are filled as -1
| Pixel properties | Quadrant properties | ||||||
|---|---|---|---|---|---|---|---|
| Quadrant | DetID | PixID | Counts | Sigma | Mean | Median | Sigma |
| A | 15 | 174 | 3272690 | 6388.95 | 2085 | 2031 | 511.9 |
| A | 0 | 8 | 303364 | 588.63 | 2085 | 2031 | 511.9 |
| A | 4 | 5 | 296911 | 576.02 | 2085 | 2031 | 511.9 |
| B | 0 | 213 | 511244 | 1135.75 | 2102 | 2026 | 448.4 |
| B | 5 | 236 | 340025 | 753.86 | 2102 | 2026 | 448.4 |
| B | 7 | 252 | 285419 | 632.07 | 2102 | 2026 | 448.4 |
| C | 1 | 16 | 1260911 | 2236.91 | 2061 | 2040 | 562.8 |
| C | 13 | 3 | 639520 | 1132.75 | 2061 | 2040 | 562.8 |
| C | 12 | 252 | 193356 | 339.95 | 2061 | 2040 | 562.8 |
| D | 2 | 165 | 3881701 | 6850.11 | 2004 | 1917 | 566.4 |
| D | 8 | 176 | 2837910 | 5007.2 | 2004 | 1917 | 566.4 |
| D | 12 | 34 | 669904 | 1179.39 | 2004 | 1917 | 566.4 |
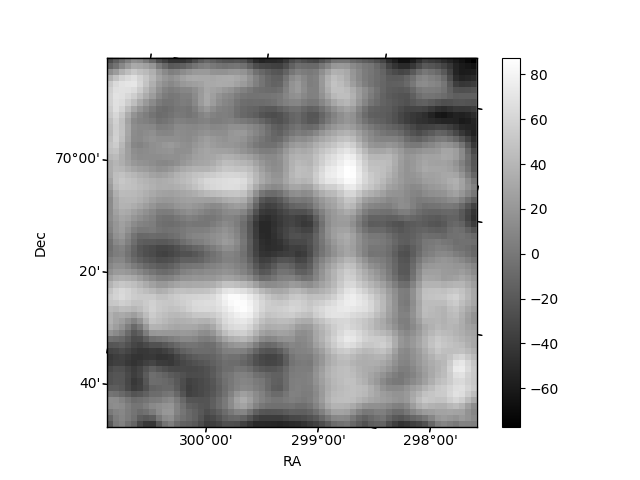
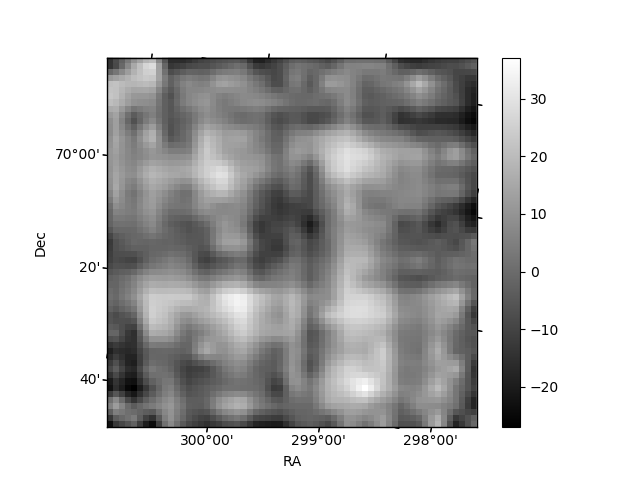
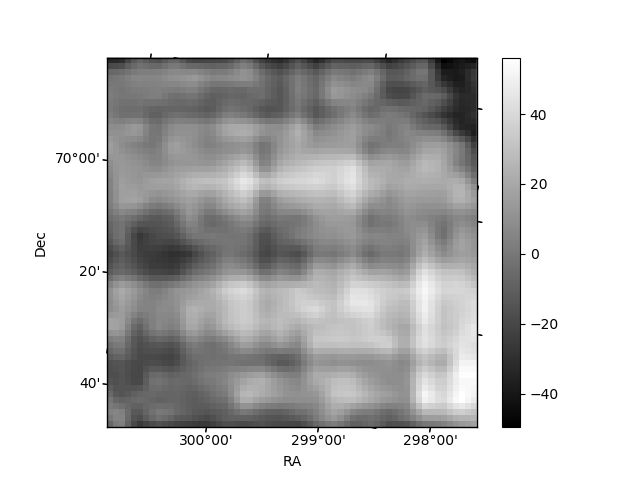
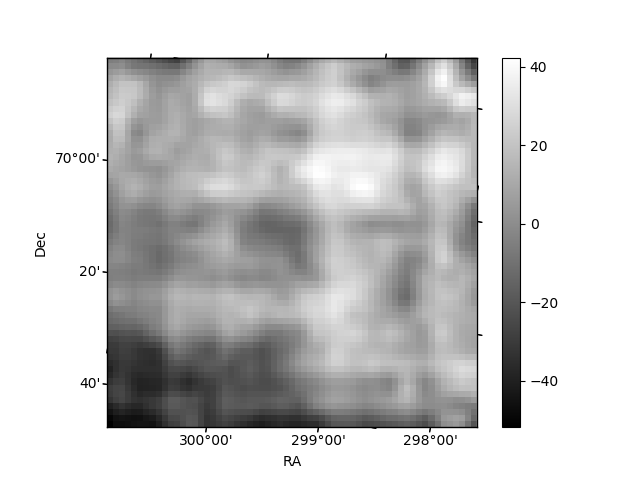
Histogram calculated using DETX and DETY for each event in the final _common_clean file
| Quadrant A | 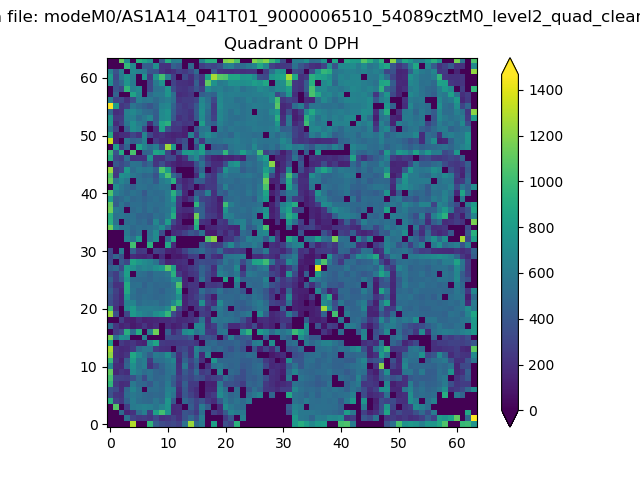 |
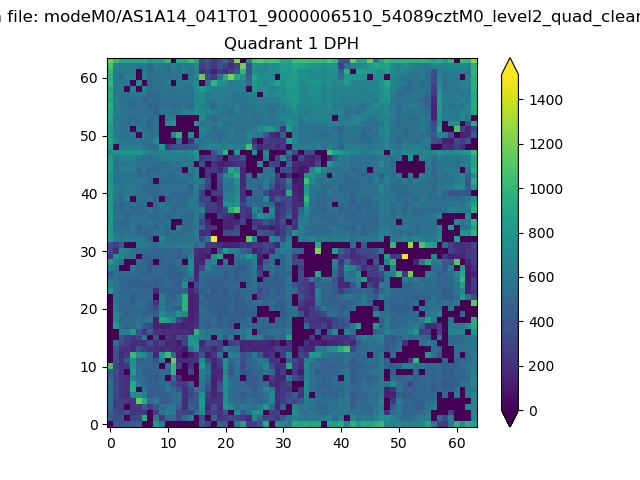 |
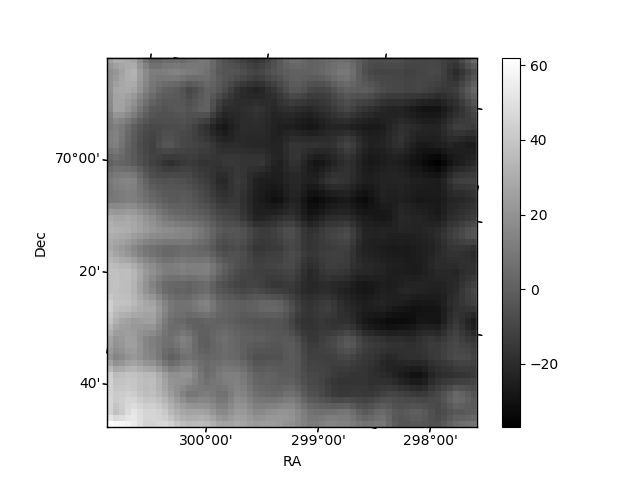
Quadrant B |
|---|---|---|---|
| Quadrant D | 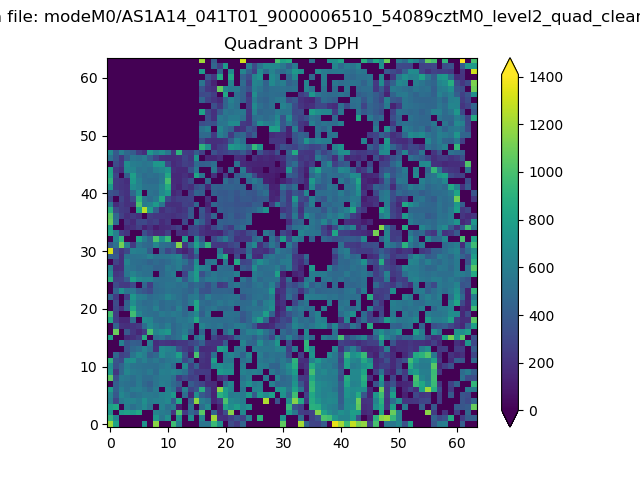 |
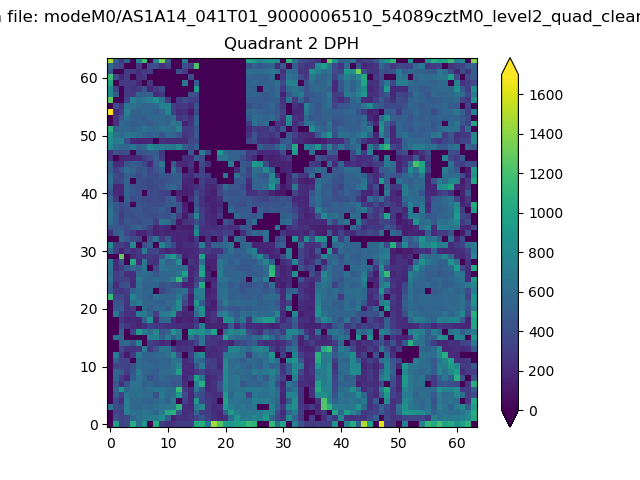 |
Quadrant C |
| Plot type | Count rate plots | Images |
|---|---|---|
| Comparison with Poisson distribution Blue bars denote a histogram of data divided into 1 sec bins. Red curve is a Poisson curve with rate = median count rate of data. |
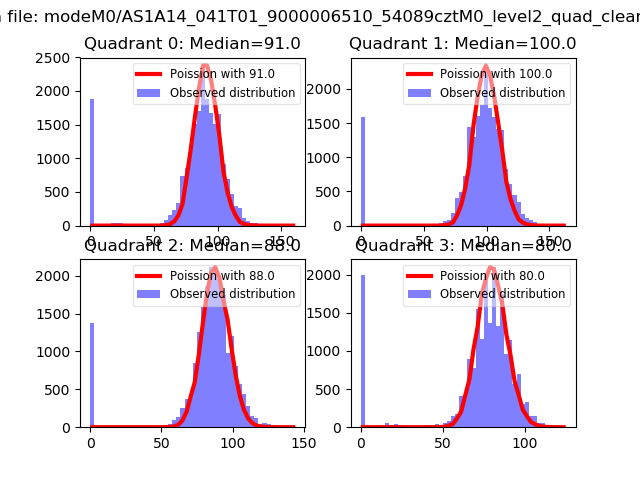 |
 |
| Quadrant-wise count rates Data is divided into 100 sec bins |
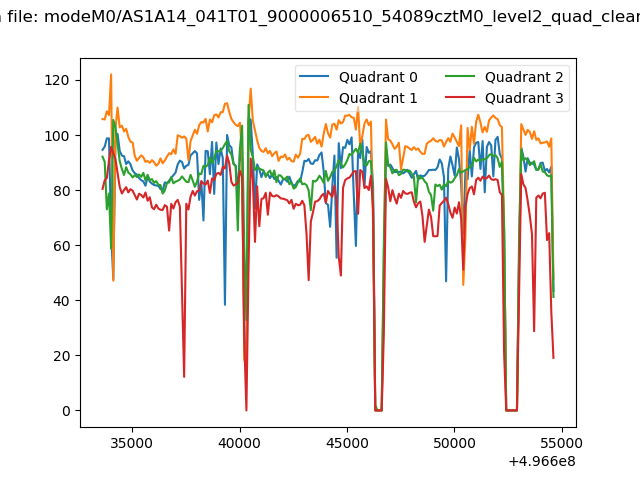 |
|
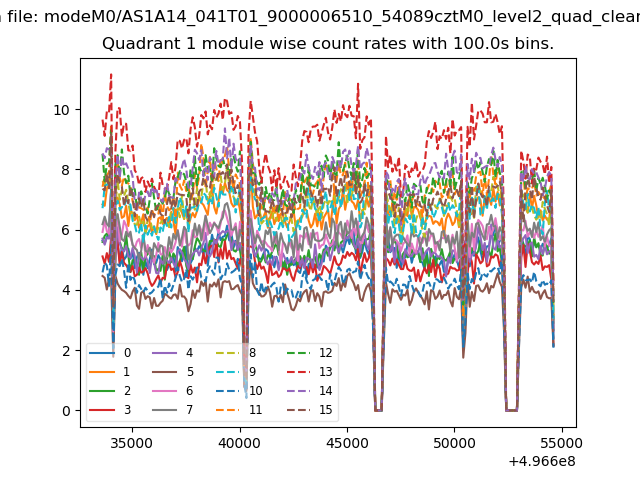
| Module-wise count rates for Quadrant A Data is divided into 100 sec bins |
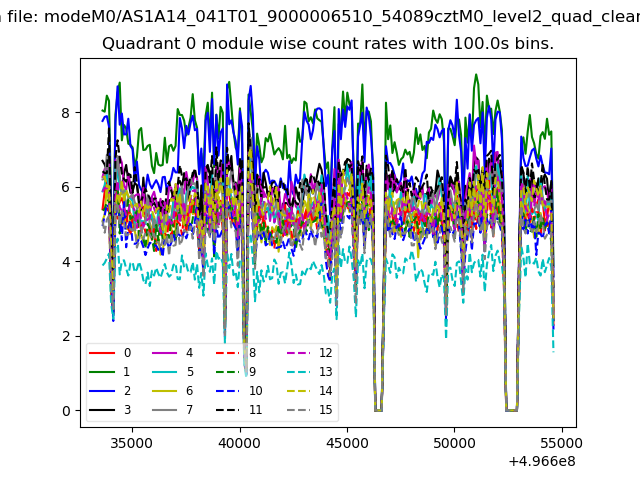 |
 |
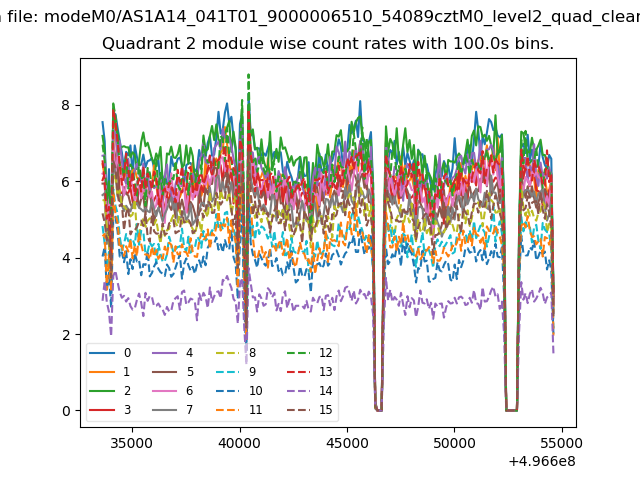
| Module-wise count rates for Quadrant B Data is divided into 100 sec bins |
 |
 |
| Module-wise count rates for Quadrant C Data is divided into 100 sec bins |
 |
 |
| Module-wise count rates for Quadrant D Data is divided into 100 sec bins |
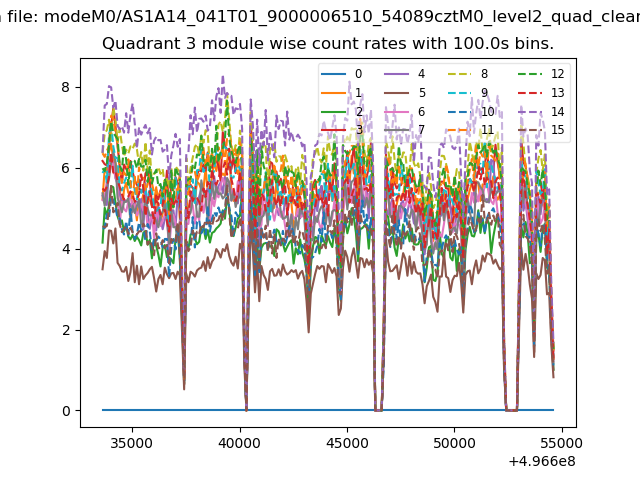 |
 |
| Parameter | Plot |
|---|---|
| CZT HV Monitor | 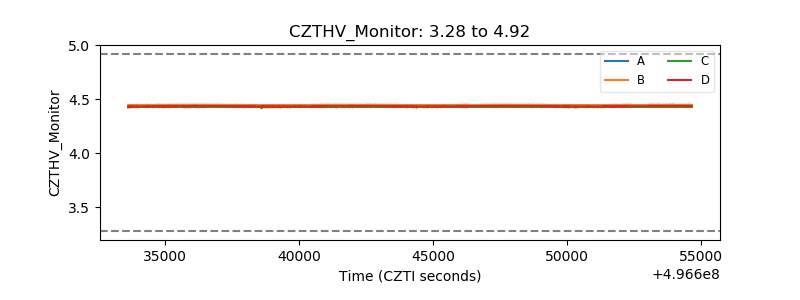 |
| D_VDD | 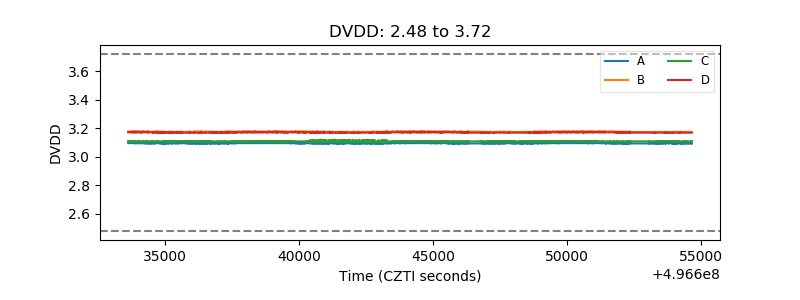 |
| Temperature 1 | 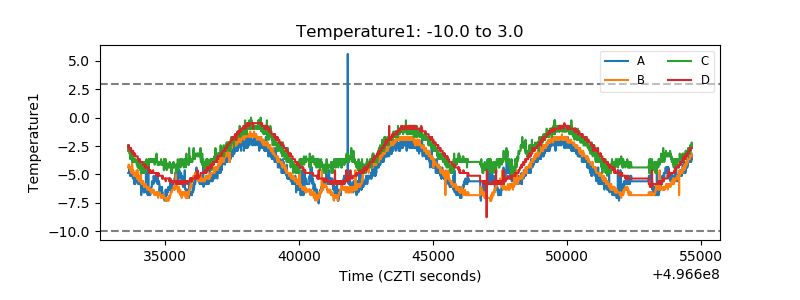 |
| Veto HV Monitor | 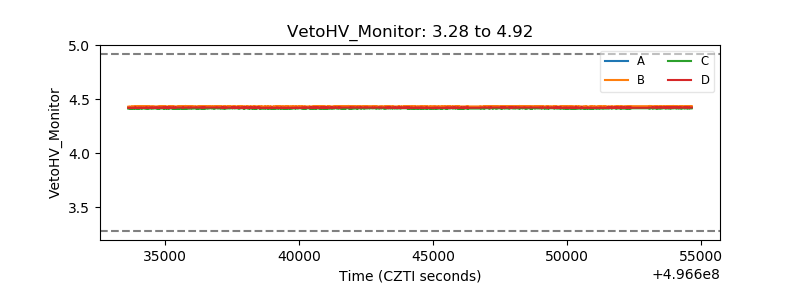 |
| Veto LLD | 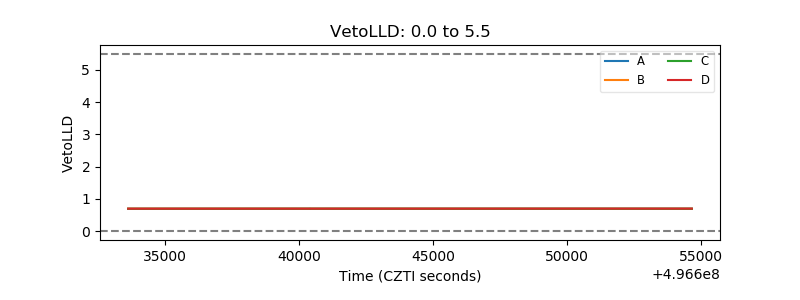 |
| Alpha Counter | 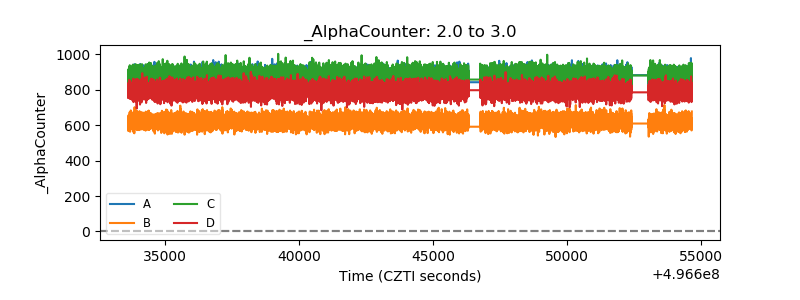 |
| _CPM_Rate | 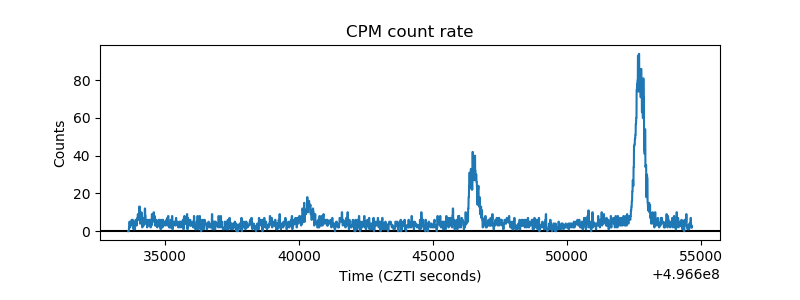 |
| CZT Counter | 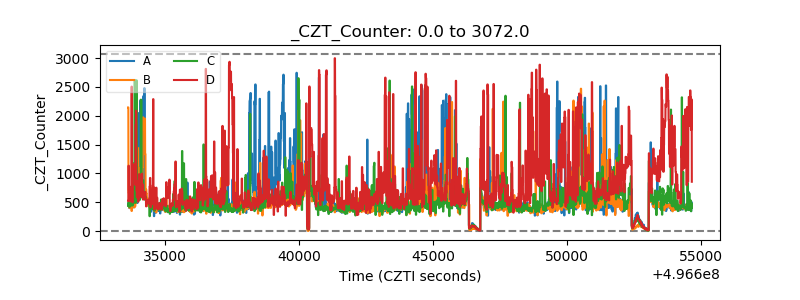 |
| +2.5 Volts monitor |  |
| +5 Volts monitor |  |
| _ROLL_ROT | 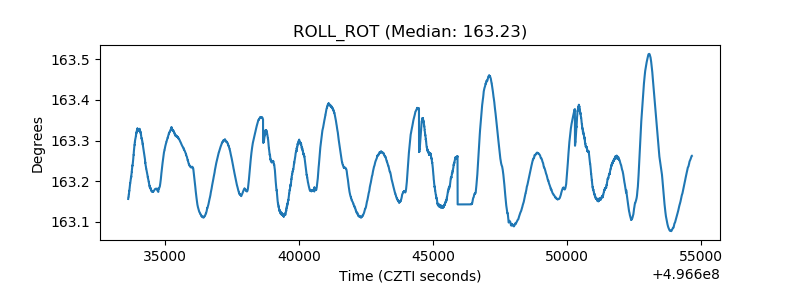 |
| _Roll_DEC | 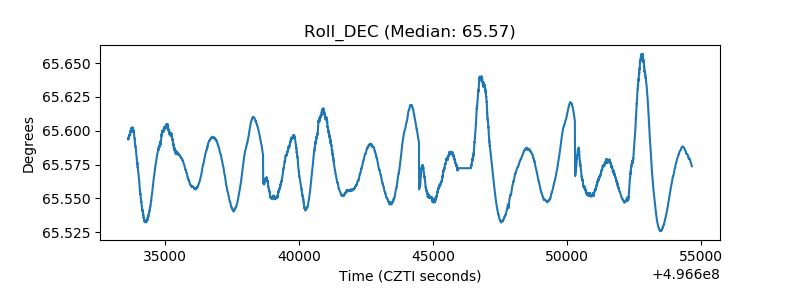 |
| _Roll_RA | 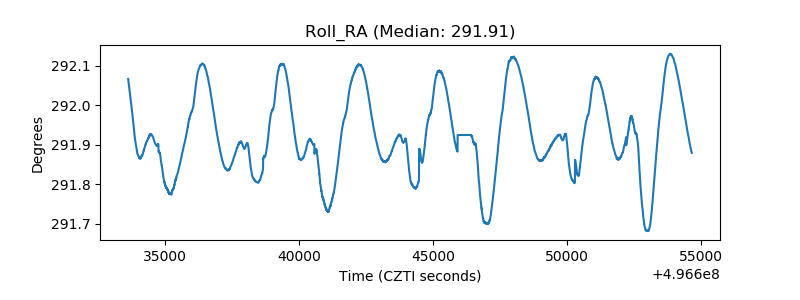 |
| Veto Counter | 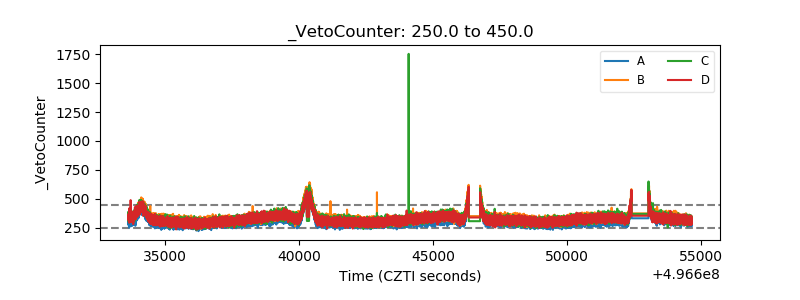 |