| Param | Original file | Final file |
|---|---|---|
| Filename | modeM0/AS1A14_041T01_9000006510_54090cztM0_level2.fits | modeM0/AS1A14_041T01_9000006510_54090cztM0_level2_quad_clean.evt |
| Size (bytes) | 552,473,280 | 95,808,960 |
| Size | 526.9 MB | 91.4 MB |
| Events in quadrant A | 4,249,116 | 611,702 |
| Events in quadrant B | 3,340,980 | 700,888 |
| Events in quadrant C | 3,859,593 | 604,268 |
| Events in quadrant D | 8,464,497 | 502,283 |
| Mode M9 | |||
|---|---|---|---|
| Quadrant | BADHDUFLAG | Total packets | Discarded packets |
| A | 0 | 8 | 0 |
| B | 0 | 8 | 0 |
| C | 0 | 8 | 0 |
| D | 0 | 8 | 0 |
| Mode SS | |||
|---|---|---|---|
| Quadrant | BADHDUFLAG | Total packets | Discarded packets |
| A | 0 | 140 | 0 |
| B | 0 | 140 | 0 |
| C | 0 | 140 | 0 |
| D | 0 | 140 | 0 |
| Mode M0 | |||
|---|---|---|---|
| Quadrant | BADHDUFLAG | Total packets | Discarded packets |
| A | 0 | 17692 | 31 |
| B | 0 | 14808 | 7 |
| C | 0 | 16479 | 13 |
| D | 0 | 30099 | 7 |
| Quadrant | Total seconds | Saturated seconds | Saturation percentage |
|---|---|---|---|
| A | 6912 | 480 | 6.944444% |
| B | 6914 | 134 | 1.938097% |
| C | 6911 | 175 | 2.532195% |
| D | 6915 | 1112 | 16.080983% |
Noise dominated data is calculated using 1-second bins in cleaned event files. If a bin has >2000 counts, and if more than 50% of those come from <1% of pixels, then it is considered to be noise-dominated and hence unusable.
| Quadrant | # 1 sec bins | Bins with >0 counts | Bins with >2000 counts | High rate bins dominated by noise | Noise dominated (total time) | Noise dominated (detector-on time) | Marked lightcurve |
|---|---|---|---|---|---|---|---|
| A | 7697 | 6917 | 325 | 325 | 4.22% | 4.70% | 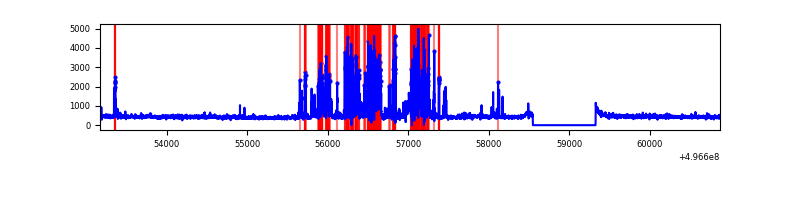 |
| B | 7698 | 6917 | 27 | 27 | 0.35% | 0.39% | 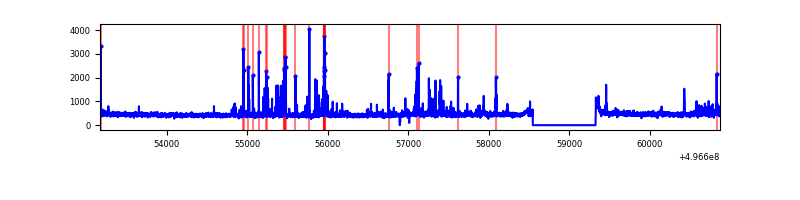 |
| C | 7698 | 6917 | 82 | 82 | 1.07% | 1.19% | 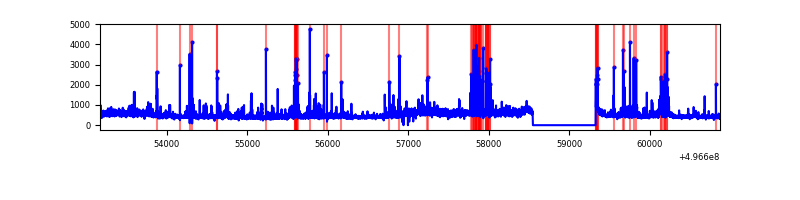 |
| D | 7697 | 6918 | 990 | 990 | 12.86% | 14.31% | 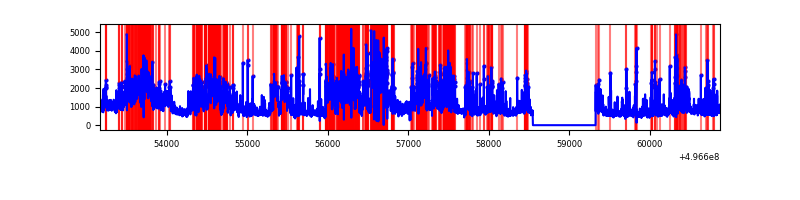 |
Top three noisy pixels from each quadrant. If the there are fewer than three noisy pixels in the level2.evt file, extra rows are filled as -1
| Pixel properties | Quadrant properties | ||||||
|---|---|---|---|---|---|---|---|
| Quadrant | DetID | PixID | Counts | Sigma | Mean | Median | Sigma |
| A | 13 | 248 | 738534 | 4224.85 | 718 | 702 | 174.6 |
| A | 0 | 8 | 509359 | 2912.59 | 718 | 702 | 174.6 |
| A | 14 | 235 | 101763 | 578.68 | 718 | 702 | 174.6 |
| B | 0 | 213 | 144473 | 913.81 | 732 | 707 | 157.3 |
| B | 5 | 236 | 55843 | 350.46 | 732 | 707 | 157.3 |
| B | 15 | 20 | 44309 | 277.15 | 732 | 707 | 157.3 |
| C | 1 | 16 | 507963 | 2618.79 | 705 | 698 | 193.7 |
| C | 15 | 233 | 186349 | 958.44 | 705 | 698 | 193.7 |
| C | 13 | 3 | 91637 | 469.48 | 705 | 698 | 193.7 |
| D | 2 | 165 | 2133166 | 11303.61 | 667 | 637 | 188.7 |
| D | 8 | 176 | 1761194 | 9331.95 | 667 | 637 | 188.7 |
| D | 2 | 172 | 687260 | 3639.49 | 667 | 637 | 188.7 |
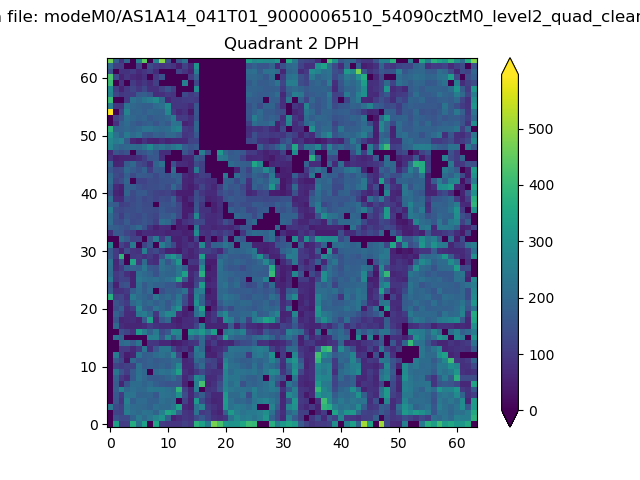
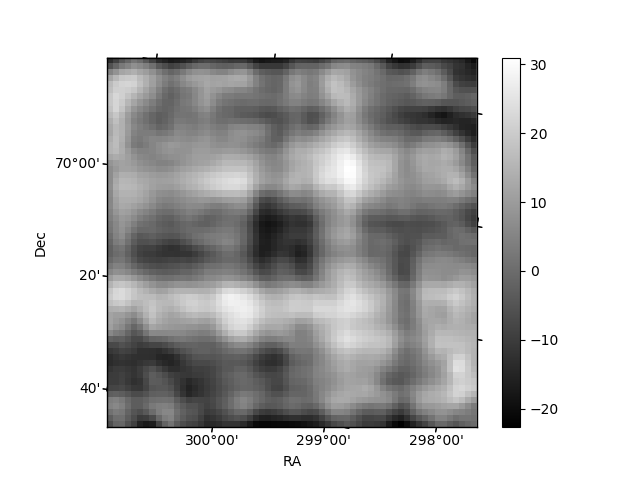
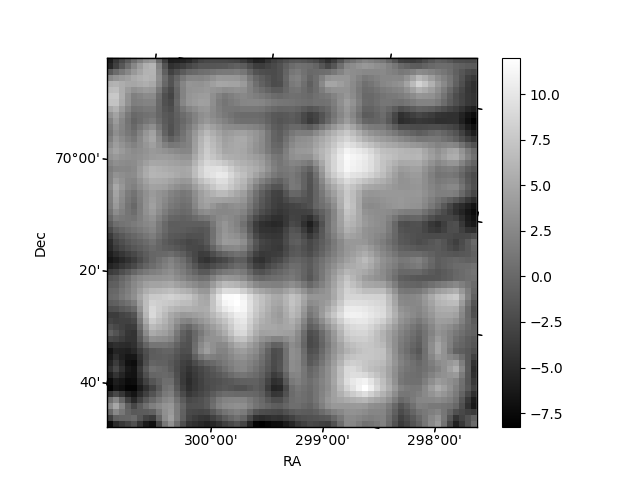
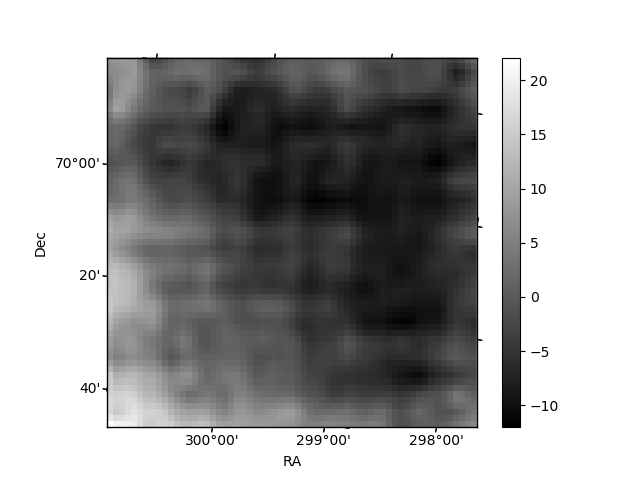
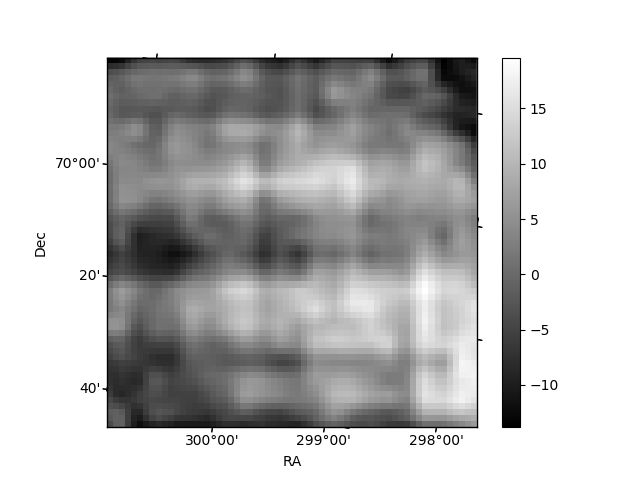
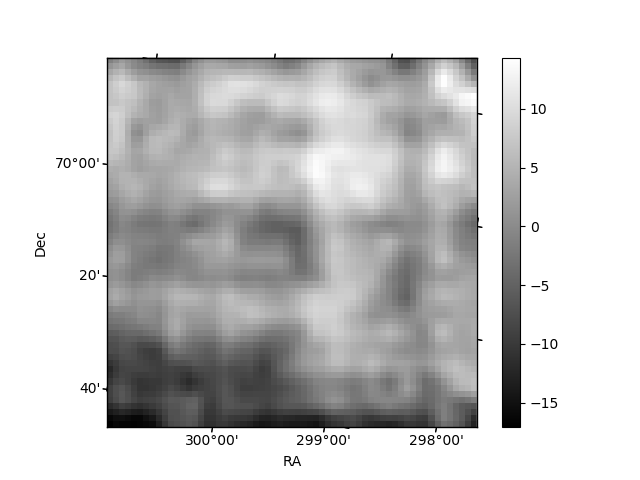
Histogram calculated using DETX and DETY for each event in the final _common_clean file
| Quadrant A | 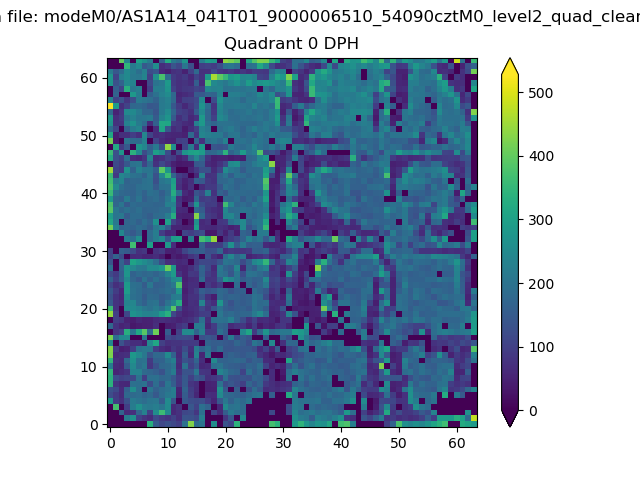 |
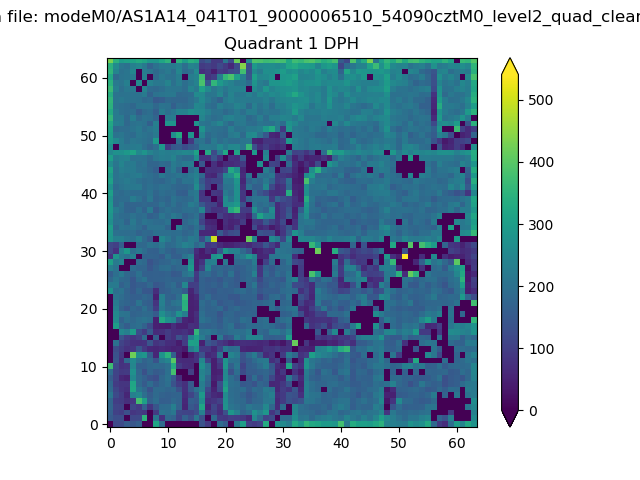 |
Quadrant B |
|---|---|---|---|
| Quadrant D | 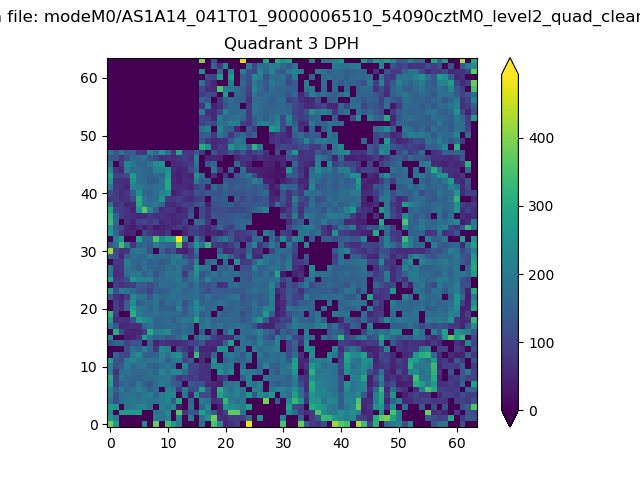 |
 |
Quadrant C |
| Plot type | Count rate plots | Images |
|---|---|---|
| Comparison with Poisson distribution Blue bars denote a histogram of data divided into 1 sec bins. Red curve is a Poisson curve with rate = median count rate of data. |
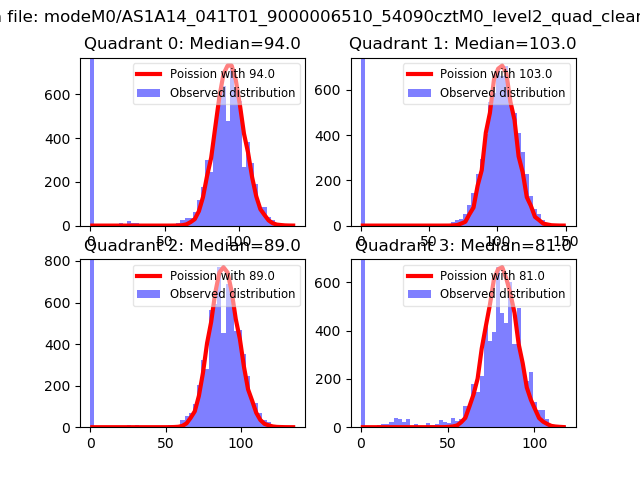 |
 |
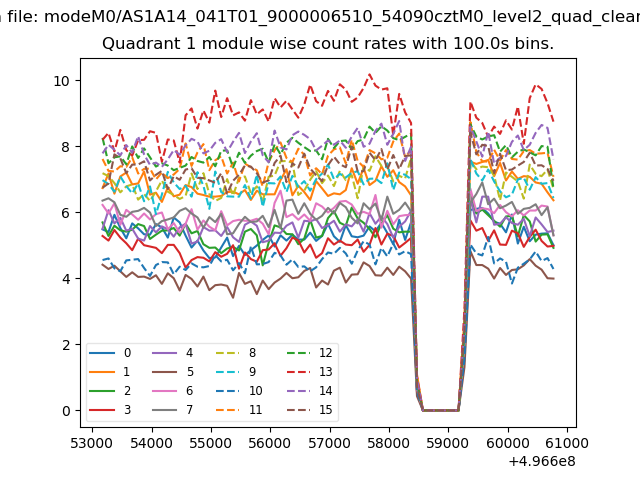
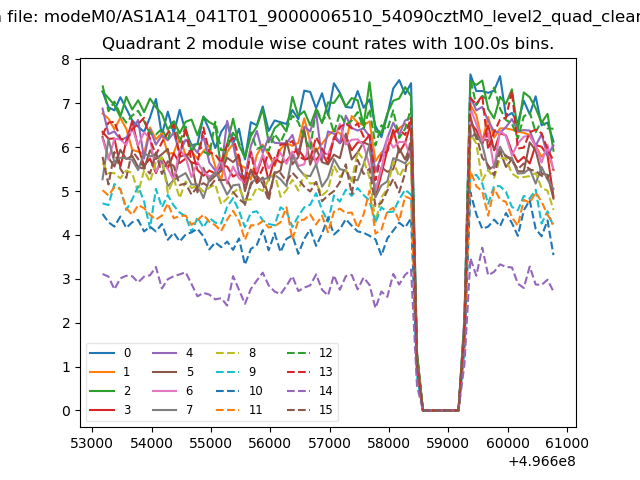
| Quadrant-wise count rates Data is divided into 100 sec bins |
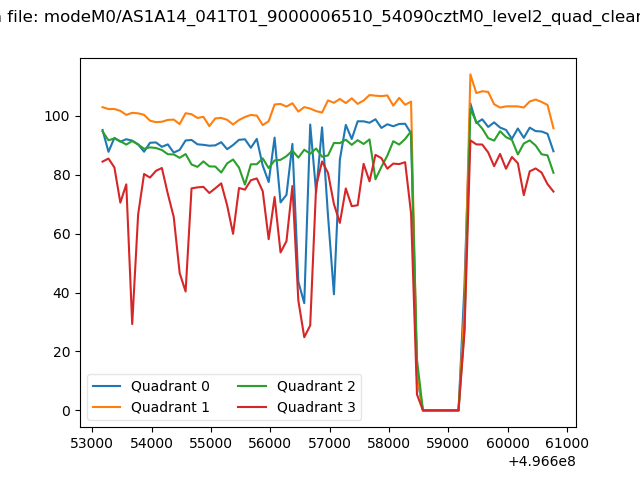 |
|
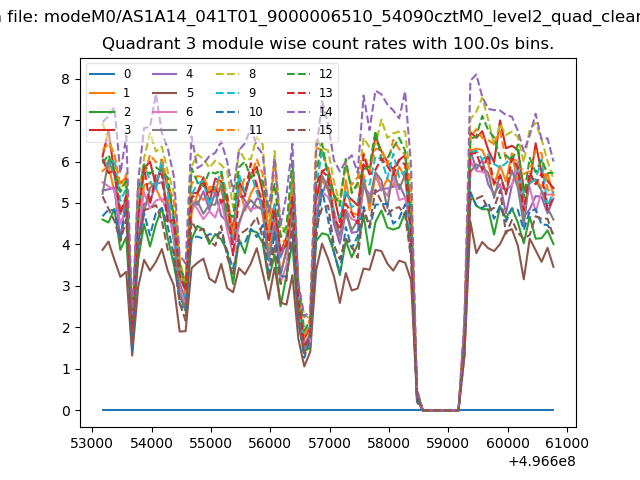
| Module-wise count rates for Quadrant A Data is divided into 100 sec bins |
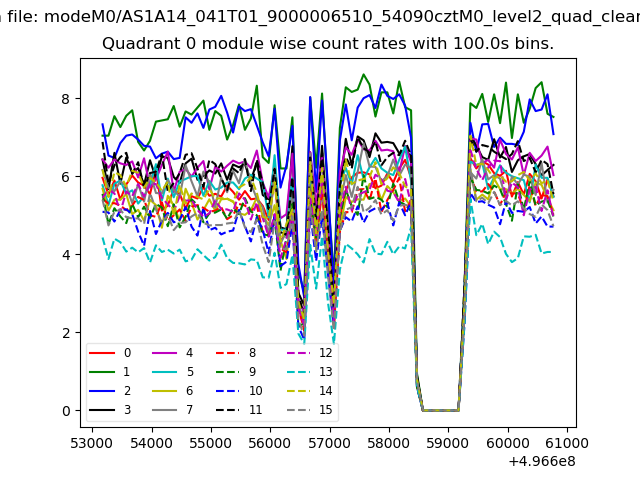 |
 |
| Module-wise count rates for Quadrant B Data is divided into 100 sec bins |
 |
 |
| Module-wise count rates for Quadrant C Data is divided into 100 sec bins |
 |
 |
| Module-wise count rates for Quadrant D Data is divided into 100 sec bins |
 |
 |
| Parameter | Plot |
|---|---|
| CZT HV Monitor | 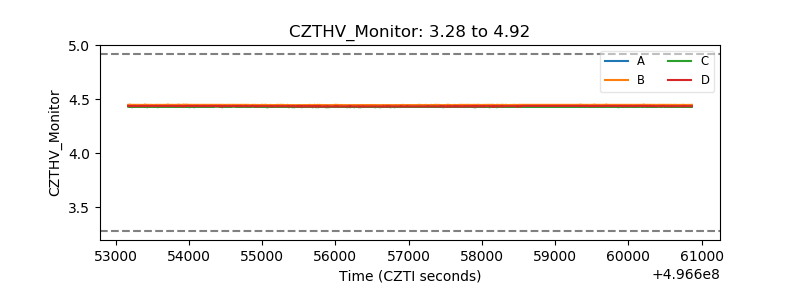 |
| D_VDD | 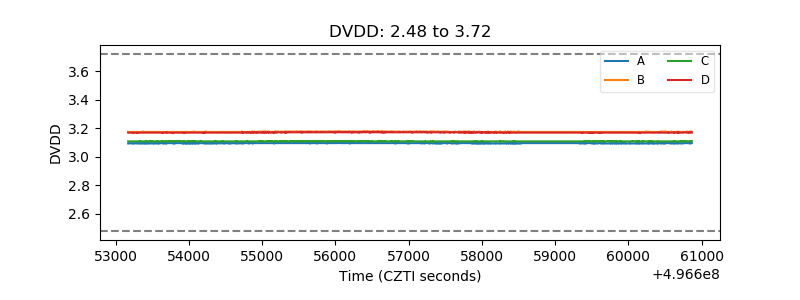 |
| Temperature 1 | 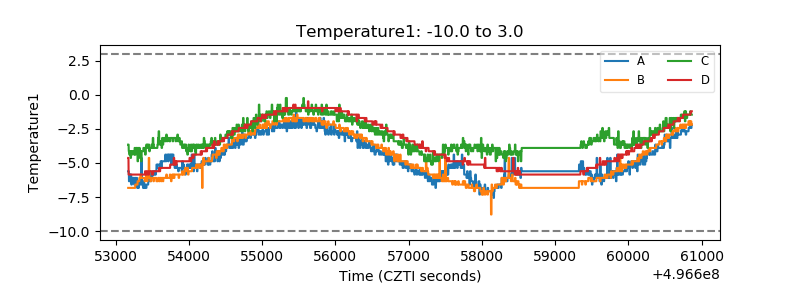 |
| Veto HV Monitor | 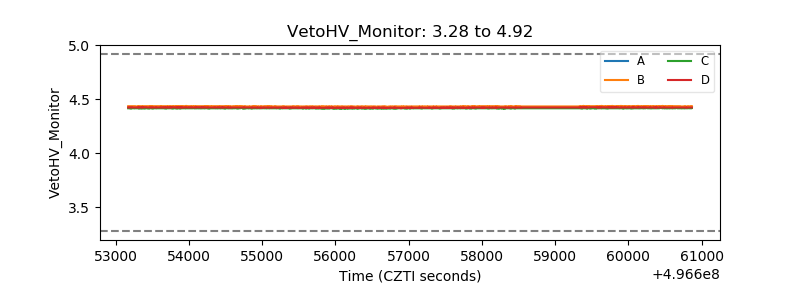 |
| Veto LLD | 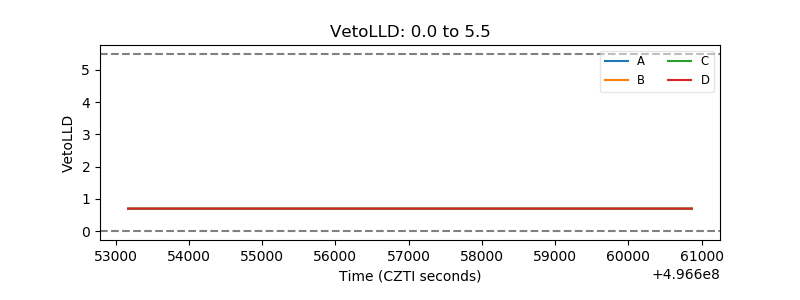 |
| Alpha Counter | 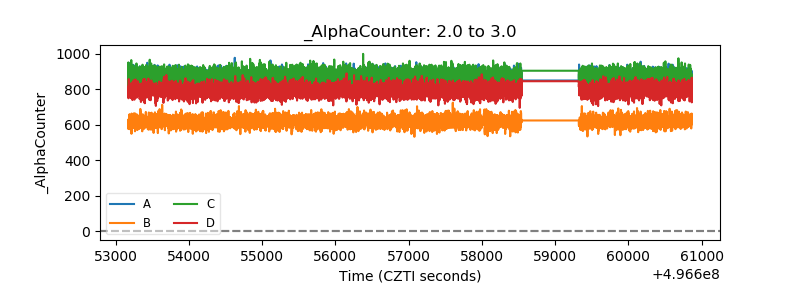 |
| _CPM_Rate | 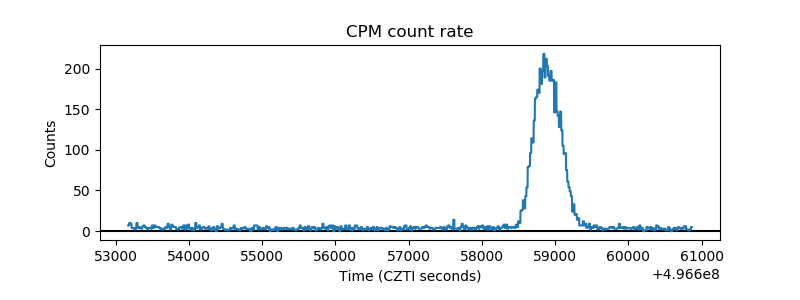 |
| CZT Counter | 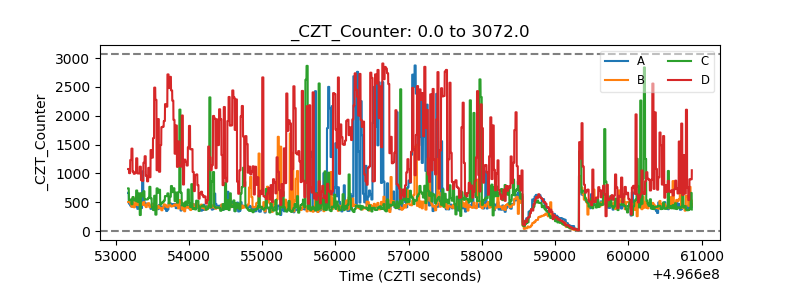 |
| +2.5 Volts monitor |  |
| +5 Volts monitor |  |
| _ROLL_ROT | 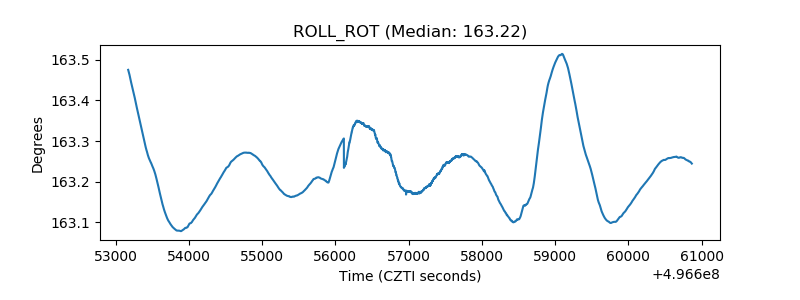 |
| _Roll_DEC | 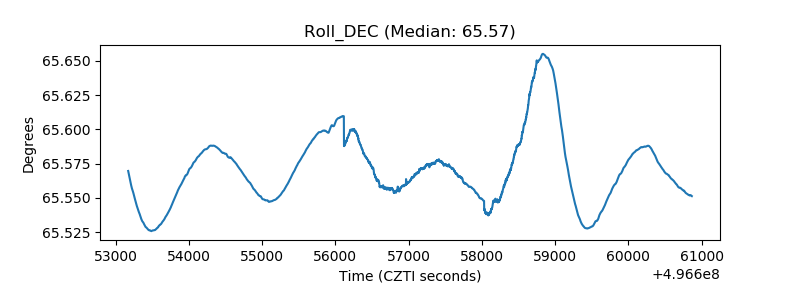 |
| _Roll_RA | 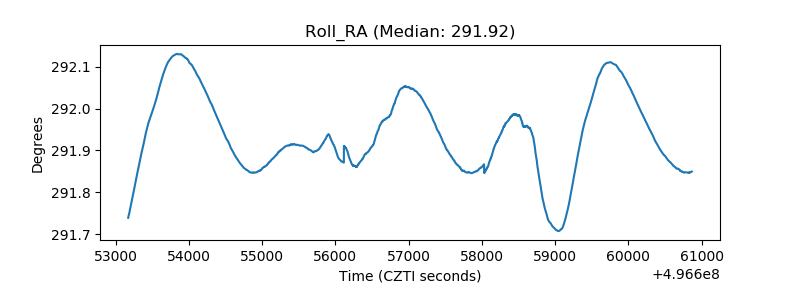 |
| Veto Counter | 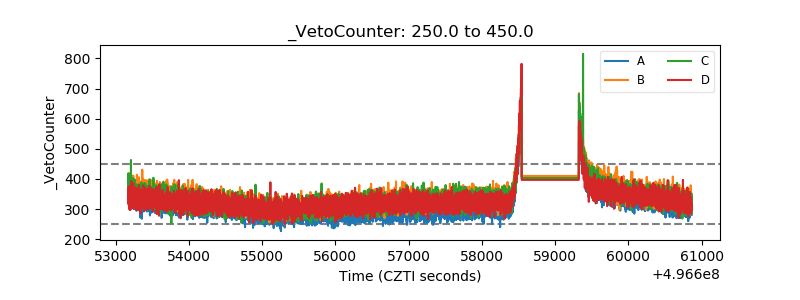 |