| Param | Original file | Final file |
|---|---|---|
| Filename | modeM0/AS1A14_041T01_9000006510_54095cztM0_level2.fits | modeM0/AS1A14_041T01_9000006510_54095cztM0_level2_quad_clean.evt |
| Size (bytes) | 489,021,120 | 91,800,000 |
| Size | 466.4 MB | 87.5 MB |
| Events in quadrant A | 4,145,845 | 615,092 |
| Events in quadrant B | 3,809,186 | 668,880 |
| Events in quadrant C | 3,131,761 | 579,725 |
| Events in quadrant D | 6,535,285 | 484,638 |
| Mode M9 | |||
|---|---|---|---|
| Quadrant | BADHDUFLAG | Total packets | Discarded packets |
| A | 0 | 12 | 0 |
| B | 0 | 12 | 0 |
| C | 0 | 12 | 0 |
| D | 0 | 12 | 0 |
| Mode SS | |||
|---|---|---|---|
| Quadrant | BADHDUFLAG | Total packets | Discarded packets |
| A | 0 | 126 | 0 |
| B | 0 | 126 | 0 |
| C | 0 | 126 | 0 |
| D | 0 | 126 | 0 |
| Mode M0 | |||
|---|---|---|---|
| Quadrant | BADHDUFLAG | Total packets | Discarded packets |
| A | 0 | 16625 | 1 |
| B | 0 | 15769 | 1 |
| C | 0 | 13847 | 1 |
| D | 0 | 23692 | 1 |
| Quadrant | Total seconds | Saturated seconds | Saturation percentage |
|---|---|---|---|
| A | 6177 | 252 | 4.079650% |
| B | 6177 | 160 | 2.590254% |
| C | 6177 | 153 | 2.476931% |
| D | 6178 | 942 | 15.247653% |
Noise dominated data is calculated using 1-second bins in cleaned event files. If a bin has >2000 counts, and if more than 50% of those come from <1% of pixels, then it is considered to be noise-dominated and hence unusable.
| Quadrant | # 1 sec bins | Bins with >0 counts | Bins with >2000 counts | High rate bins dominated by noise | Noise dominated (total time) | Noise dominated (detector-on time) | Marked lightcurve |
|---|---|---|---|---|---|---|---|
| A | 7322 | 6178 | 236 | 236 | 3.22% | 3.82% | 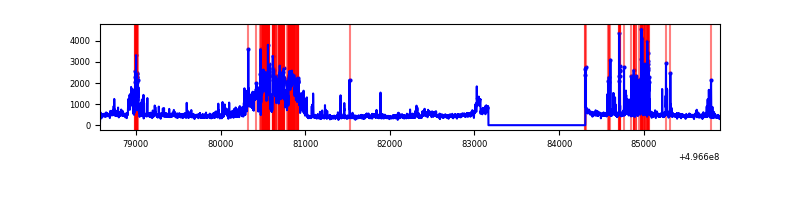 |
| B | 7322 | 6178 | 47 | 47 | 0.64% | 0.76% | 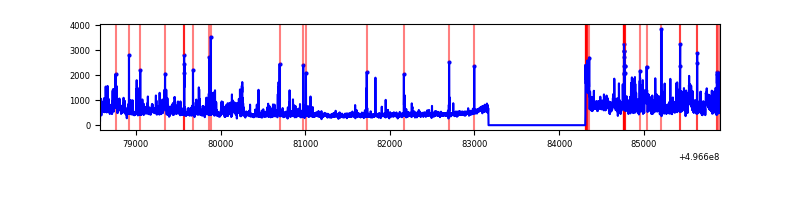 |
| C | 7322 | 6178 | 60 | 60 | 0.82% | 0.97% | 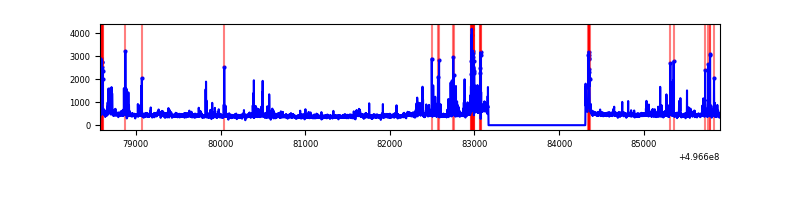 |
| D | 7323 | 6179 | 754 | 754 | 10.30% | 12.20% | 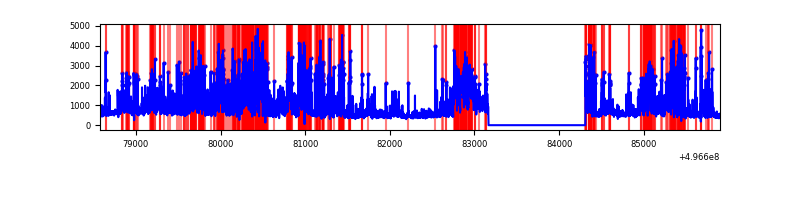 |
Top three noisy pixels from each quadrant. If the there are fewer than three noisy pixels in the level2.evt file, extra rows are filled as -1
| Pixel properties | Quadrant properties | ||||||
|---|---|---|---|---|---|---|---|
| Quadrant | DetID | PixID | Counts | Sigma | Mean | Median | Sigma |
| A | 12 | 115 | 984402 | 5988.57 | 662 | 647 | 164.3 |
| A | 0 | 8 | 223901 | 1359.05 | 662 | 647 | 164.3 |
| A | 15 | 174 | 200261 | 1215.14 | 662 | 647 | 164.3 |
| B | 15 | 20 | 748411 | 5423.24 | 660 | 638 | 137.9 |
| B | 0 | 213 | 92528 | 666.43 | 660 | 638 | 137.9 |
| B | 10 | 245 | 58898 | 422.53 | 660 | 638 | 137.9 |
| C | 13 | 3 | 246405 | 1378.12 | 651 | 644 | 178.3 |
| C | 15 | 233 | 103264 | 575.45 | 651 | 644 | 178.3 |
| C | 1 | 16 | 95558 | 532.24 | 651 | 644 | 178.3 |
| D | 15 | 78 | 1394522 | 7913.55 | 613 | 586 | 176.1 |
| D | 8 | 176 | 1159870 | 6581.4 | 613 | 586 | 176.1 |
| D | 3 | 12 | 523666 | 2969.59 | 613 | 586 | 176.1 |
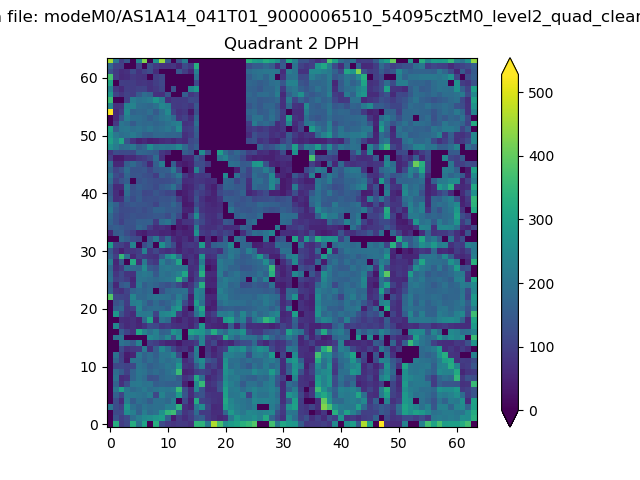
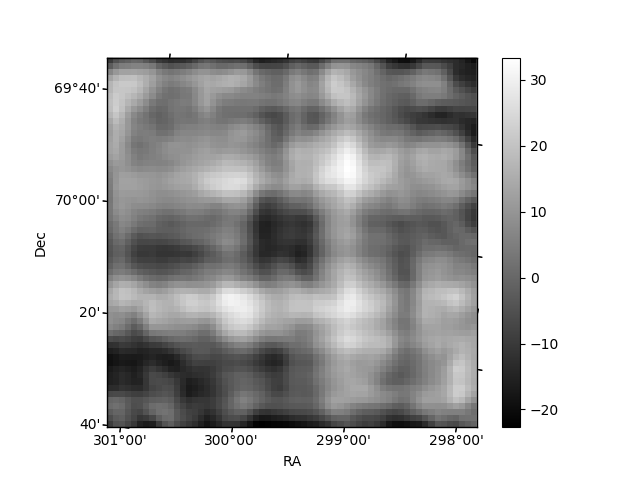
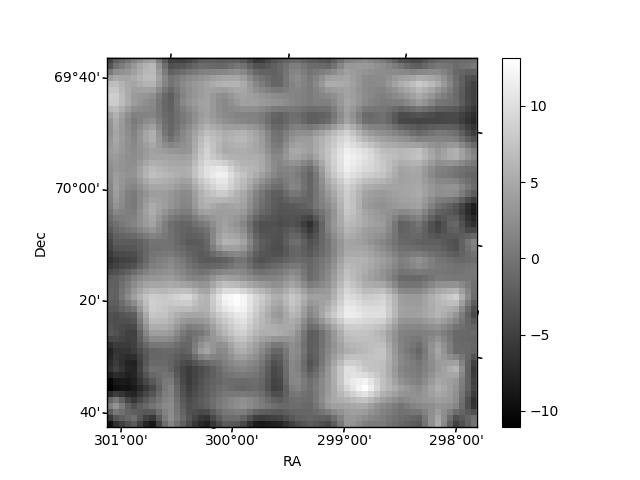
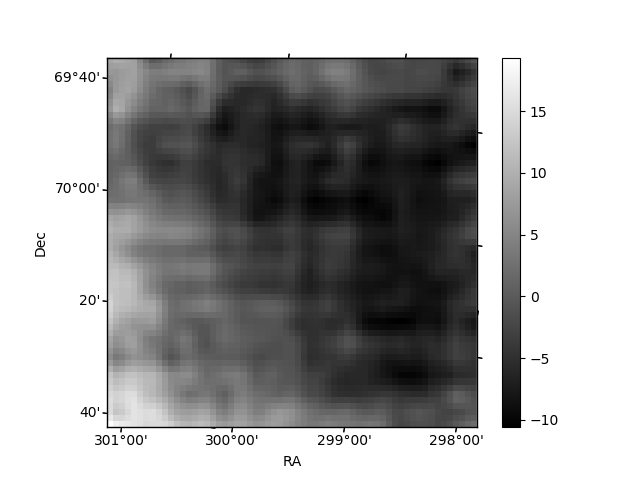
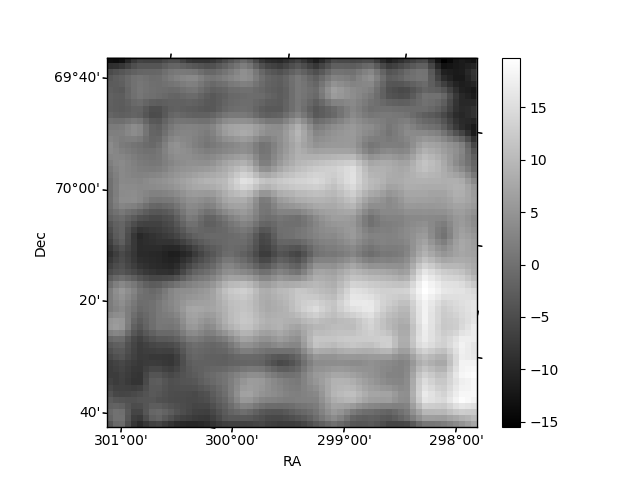
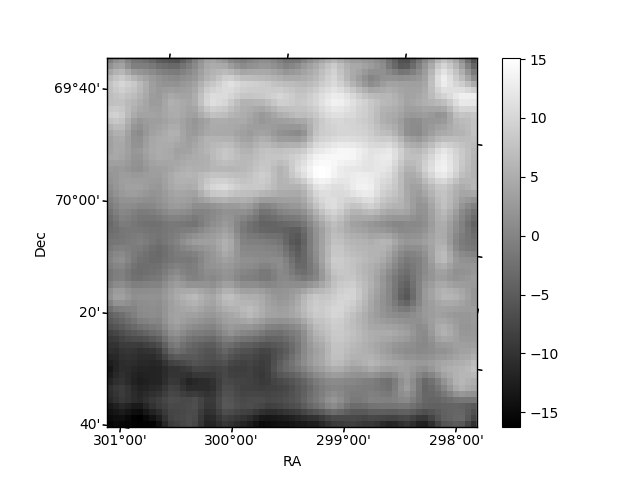
Histogram calculated using DETX and DETY for each event in the final _common_clean file
| Quadrant A | 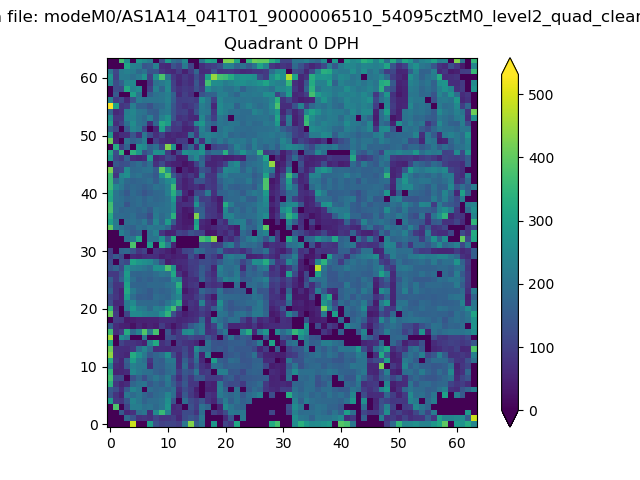 |
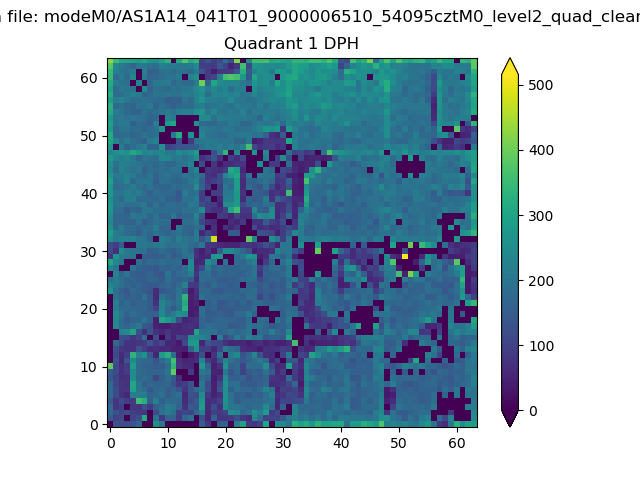 |
Quadrant B |
|---|---|---|---|
| Quadrant D | 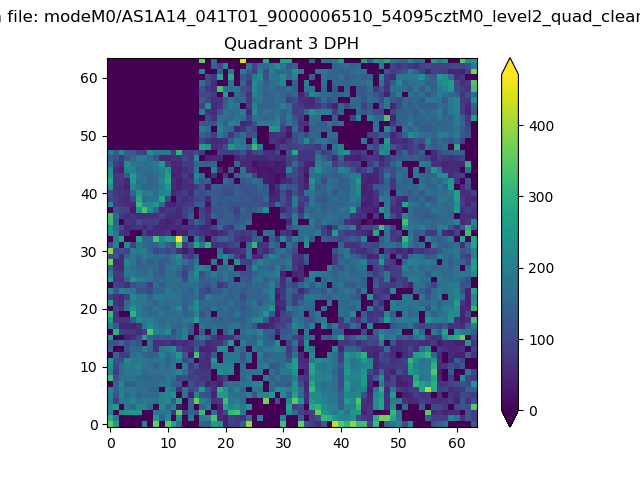 |
 |
Quadrant C |
| Plot type | Count rate plots | Images |
|---|---|---|
| Comparison with Poisson distribution Blue bars denote a histogram of data divided into 1 sec bins. Red curve is a Poisson curve with rate = median count rate of data. |
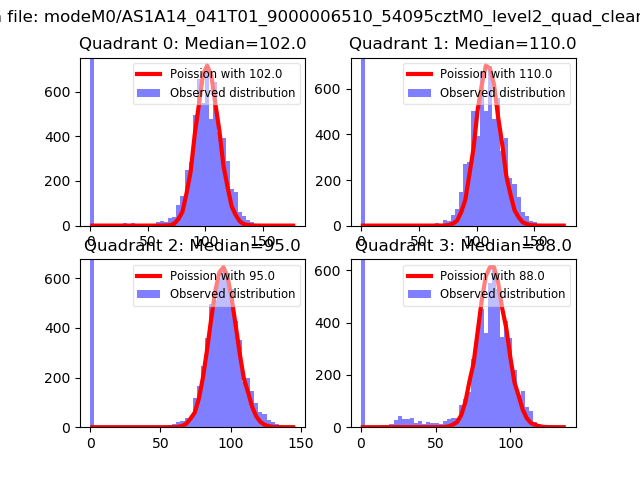 |
 |
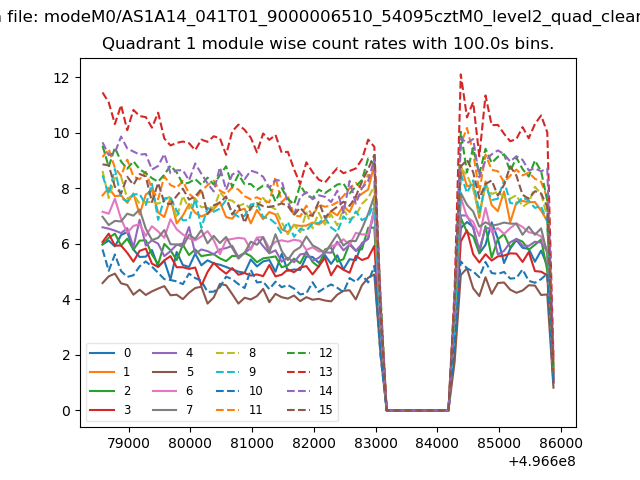
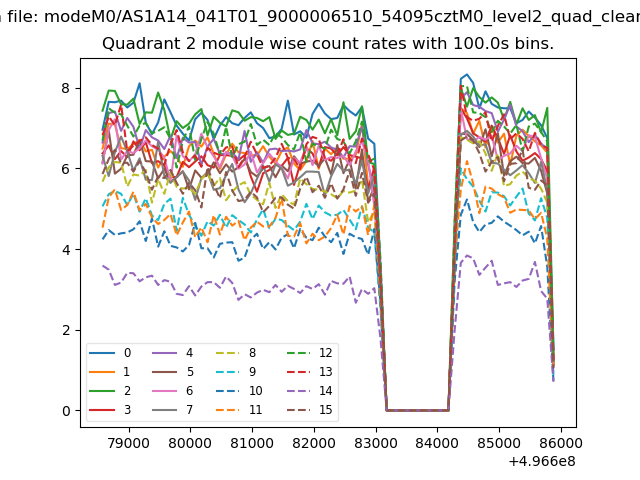
| Quadrant-wise count rates Data is divided into 100 sec bins |
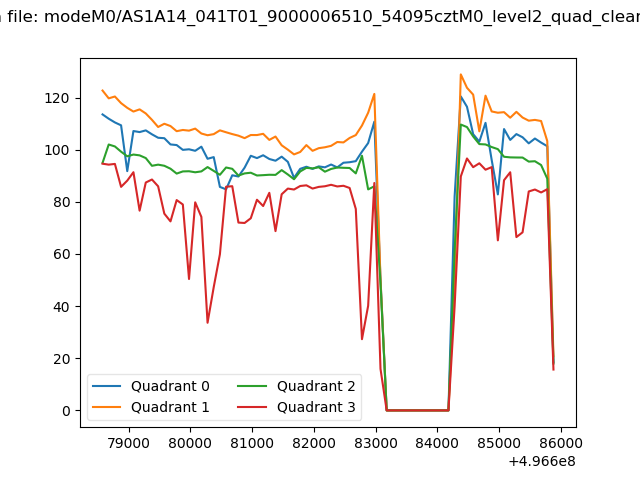 |
|
| Module-wise count rates for Quadrant A Data is divided into 100 sec bins |
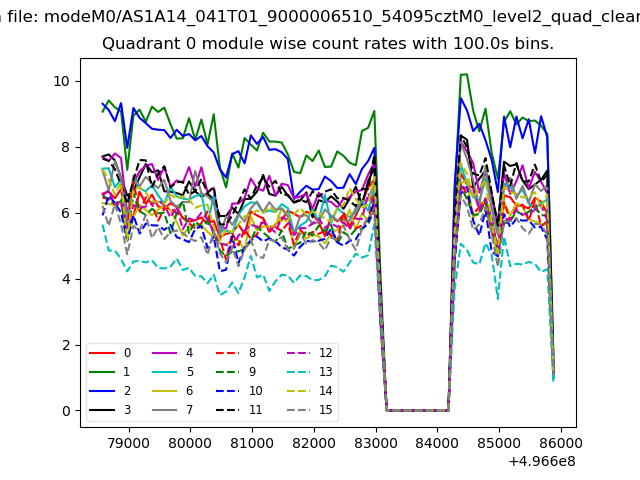 |
 |
| Module-wise count rates for Quadrant B Data is divided into 100 sec bins |
 |
 |
| Module-wise count rates for Quadrant C Data is divided into 100 sec bins |
 |
 |
| Module-wise count rates for Quadrant D Data is divided into 100 sec bins |
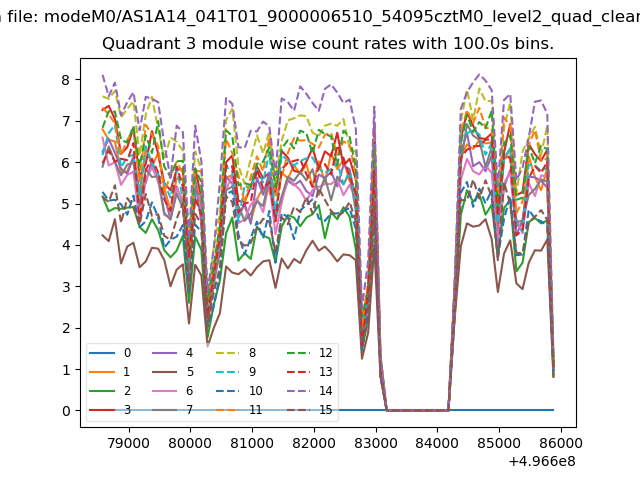 |
 |
| Parameter | Plot |
|---|---|
| CZT HV Monitor | 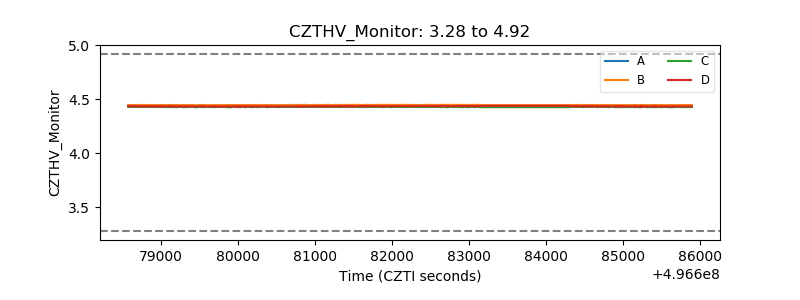 |
| D_VDD | 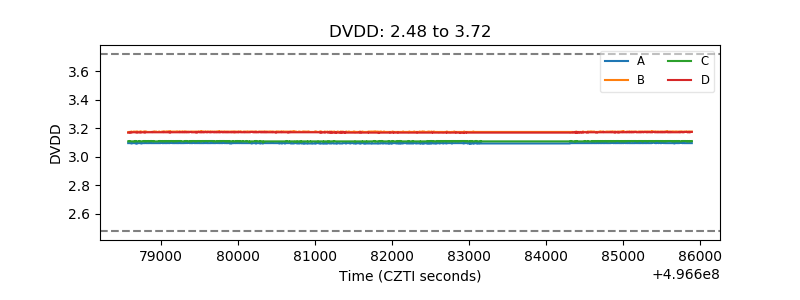 |
| Temperature 1 | 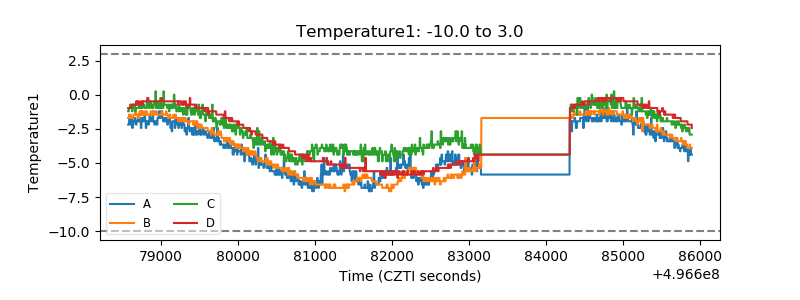 |
| Veto HV Monitor | 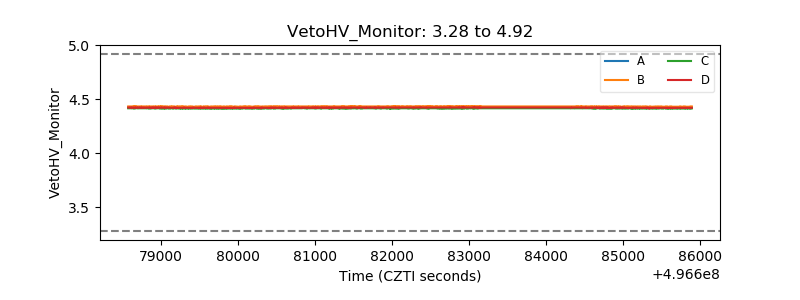 |
| Veto LLD | 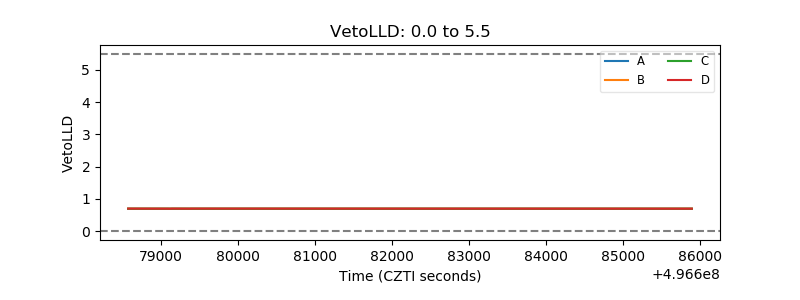 |
| Alpha Counter | 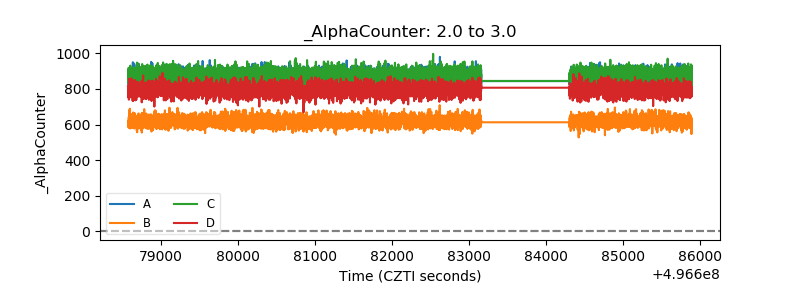 |
| _CPM_Rate | 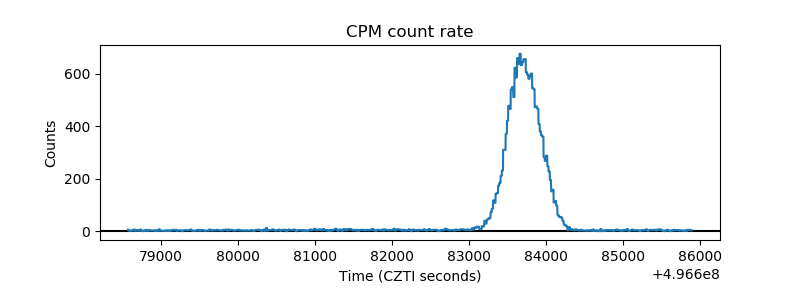 |
| CZT Counter | 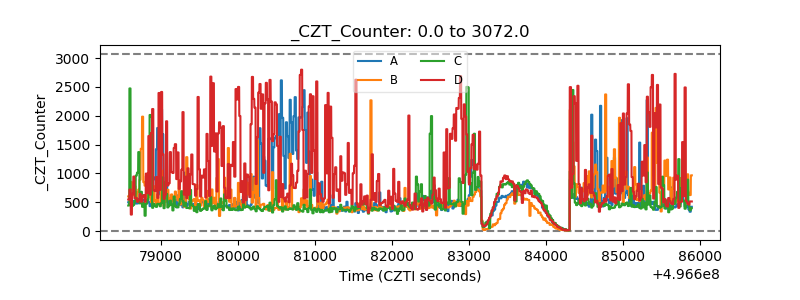 |
| +2.5 Volts monitor |  |
| +5 Volts monitor |  |
| _ROLL_ROT | 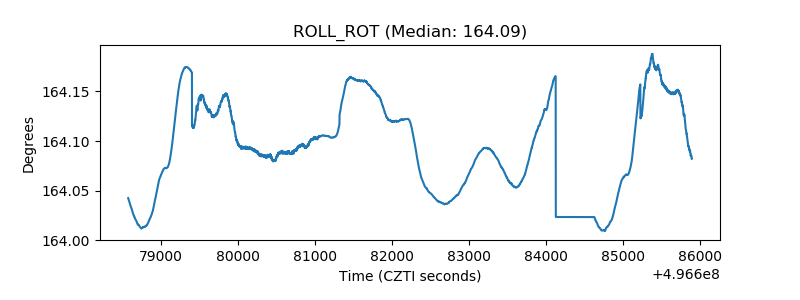 |
| _Roll_DEC | 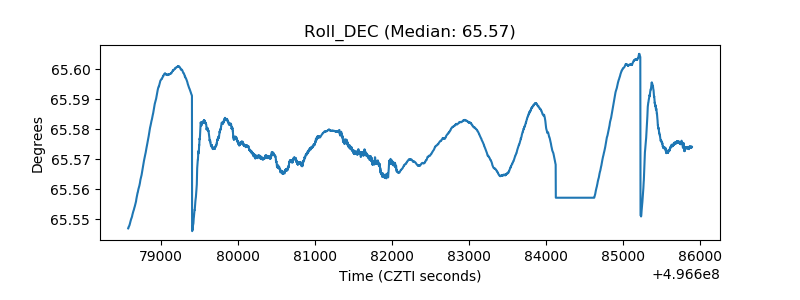 |
| _Roll_RA | 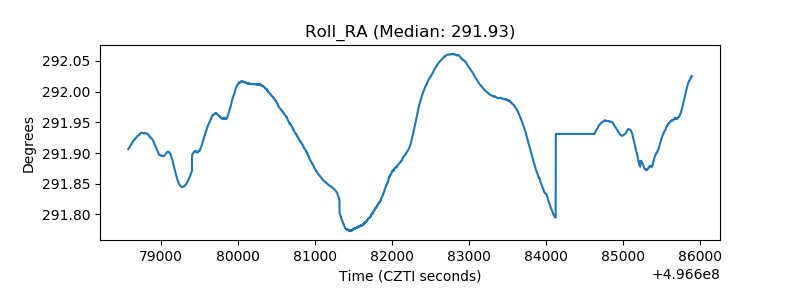 |
| Veto Counter | 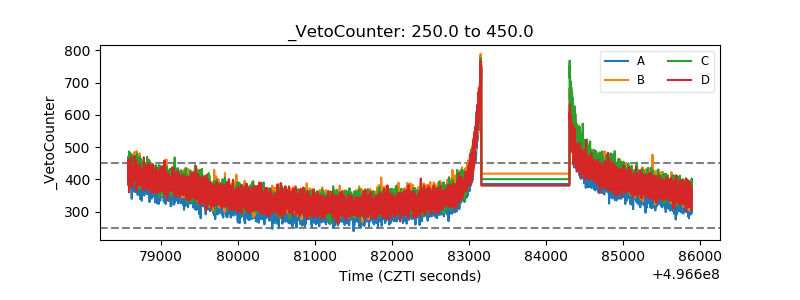 |