| Param | Original file | Final file |
|---|---|---|
| Filename | modeM0/AS1A14_041T01_9000006510_54097cztM0_level2.fits | modeM0/AS1A14_041T01_9000006510_54097cztM0_level2_quad_clean.evt |
| Size (bytes) | 529,951,680 | 93,862,080 |
| Size | 505.4 MB | 89.5 MB |
| Events in quadrant A | 3,925,740 | 630,527 |
| Events in quadrant B | 5,555,562 | 632,325 |
| Events in quadrant C | 3,438,318 | 600,908 |
| Events in quadrant D | 6,183,233 | 516,921 |
| Mode M9 | |||
|---|---|---|---|
| Quadrant | BADHDUFLAG | Total packets | Discarded packets |
| A | 0 | 10 | 0 |
| B | 0 | 10 | 0 |
| C | 0 | 10 | 0 |
| D | 0 | 10 | 0 |
| Mode SS | |||
|---|---|---|---|
| Quadrant | BADHDUFLAG | Total packets | Discarded packets |
| A | 0 | 132 | 0 |
| B | 0 | 132 | 0 |
| C | 0 | 132 | 0 |
| D | 0 | 132 | 0 |
| Mode M0 | |||
|---|---|---|---|
| Quadrant | BADHDUFLAG | Total packets | Discarded packets |
| A | 0 | 16567 | 1 |
| B | 0 | 21282 | 1 |
| C | 0 | 15118 | 2 |
| D | 0 | 23044 | 1 |
| Quadrant | Total seconds | Saturated seconds | Saturation percentage |
|---|---|---|---|
| A | 6622 | 219 | 3.307158% |
| B | 6622 | 757 | 11.431592% |
| C | 6621 | 152 | 2.295726% |
| D | 6622 | 824 | 12.443371% |
Noise dominated data is calculated using 1-second bins in cleaned event files. If a bin has >2000 counts, and if more than 50% of those come from <1% of pixels, then it is considered to be noise-dominated and hence unusable.
| Quadrant | # 1 sec bins | Bins with >0 counts | Bins with >2000 counts | High rate bins dominated by noise | Noise dominated (total time) | Noise dominated (detector-on time) | Marked lightcurve |
|---|---|---|---|---|---|---|---|
| A | 7577 | 6623 | 197 | 197 | 2.60% | 2.97% | 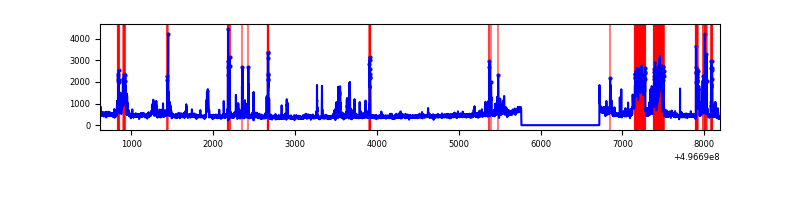 |
| B | 7577 | 6623 | 567 | 567 | 7.48% | 8.56% | 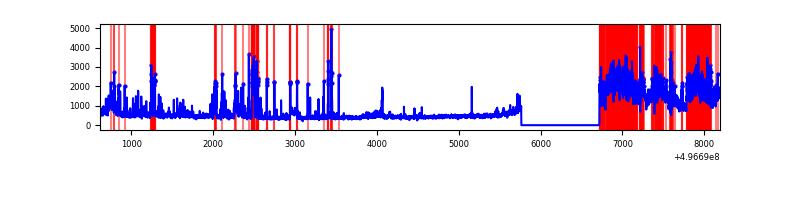 |
| C | 7576 | 6622 | 108 | 108 | 1.43% | 1.63% | 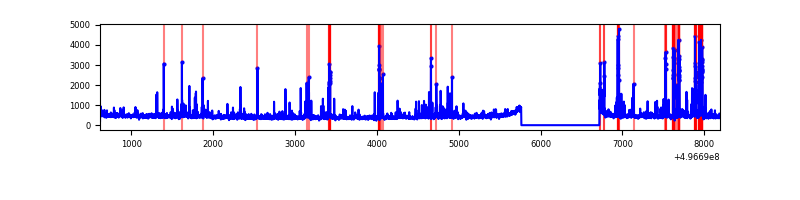 |
| D | 7577 | 6623 | 663 | 663 | 8.75% | 10.01% | 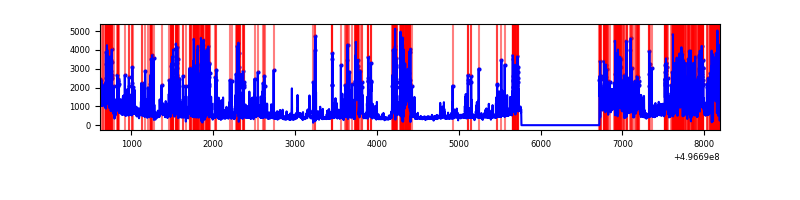 |
Top three noisy pixels from each quadrant. If the there are fewer than three noisy pixels in the level2.evt file, extra rows are filled as -1
| Pixel properties | Quadrant properties | ||||||
|---|---|---|---|---|---|---|---|
| Quadrant | DetID | PixID | Counts | Sigma | Mean | Median | Sigma |
| A | 12 | 115 | 616427 | 3576.31 | 690 | 673 | 172.2 |
| A | 15 | 174 | 273191 | 1582.79 | 690 | 673 | 172.2 |
| A | 0 | 8 | 109347 | 631.18 | 690 | 673 | 172.2 |
| B | 5 | 250 | 1750371 | 12320.28 | 669 | 647 | 142.0 |
| B | 15 | 20 | 252499 | 1773.36 | 669 | 647 | 142.0 |
| B | 0 | 213 | 203585 | 1428.94 | 669 | 647 | 142.0 |
| C | 13 | 3 | 197392 | 1040.18 | 681 | 672 | 189.1 |
| C | 1 | 241 | 141101 | 742.54 | 681 | 672 | 189.1 |
| C | 1 | 16 | 138779 | 730.26 | 681 | 672 | 189.1 |
| D | 15 | 78 | 2175785 | 11783.09 | 643 | 613 | 184.6 |
| D | 8 | 176 | 667678 | 3613.55 | 643 | 613 | 184.6 |
| D | 3 | 12 | 219098 | 1183.55 | 643 | 613 | 184.6 |
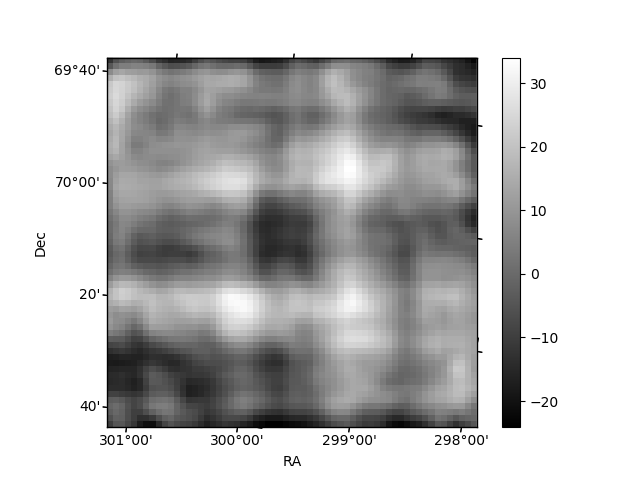
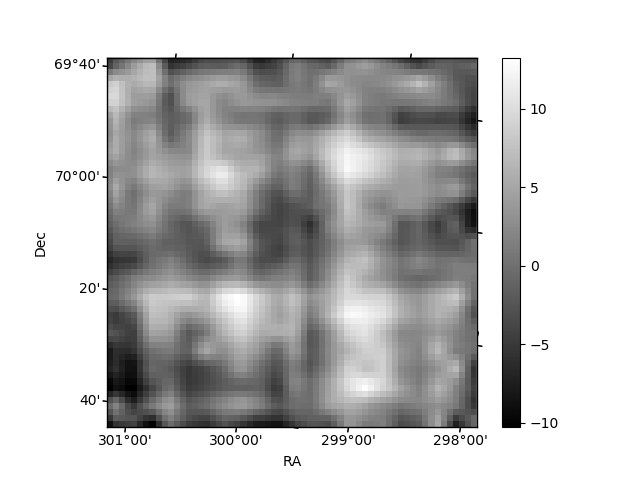
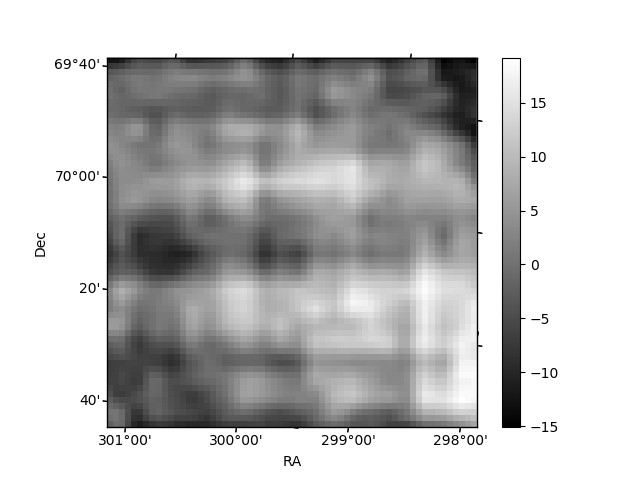
Histogram calculated using DETX and DETY for each event in the final _common_clean file
| Quadrant A | 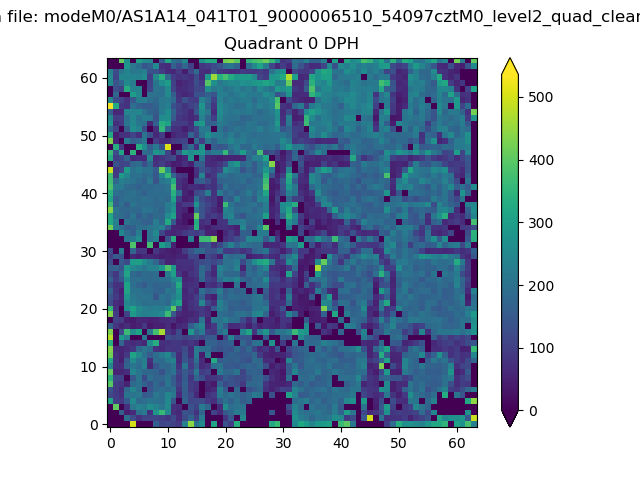 |
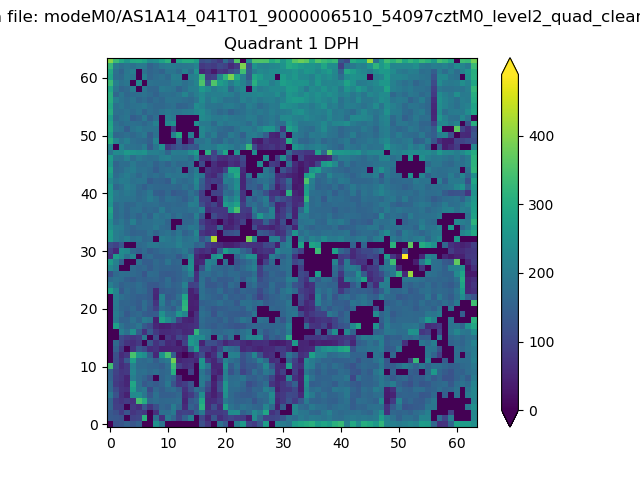 |
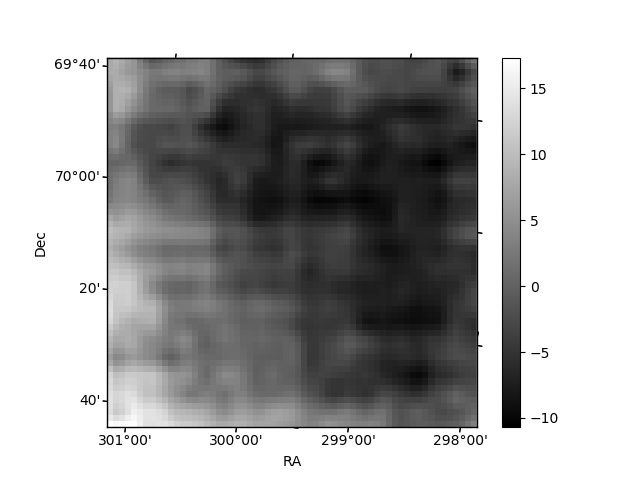
Quadrant B |
|---|---|---|---|
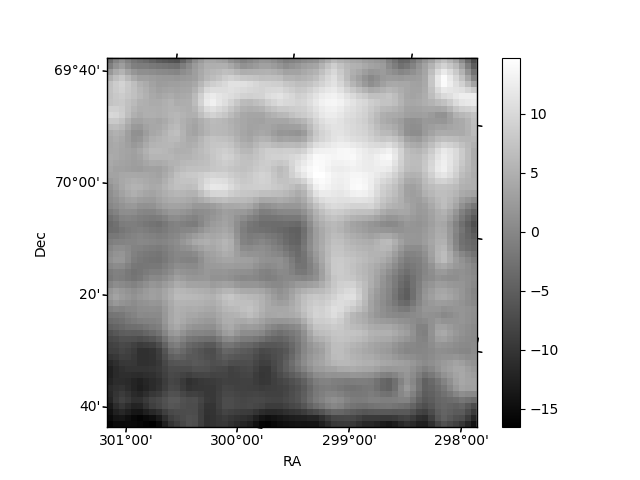
| Quadrant D | 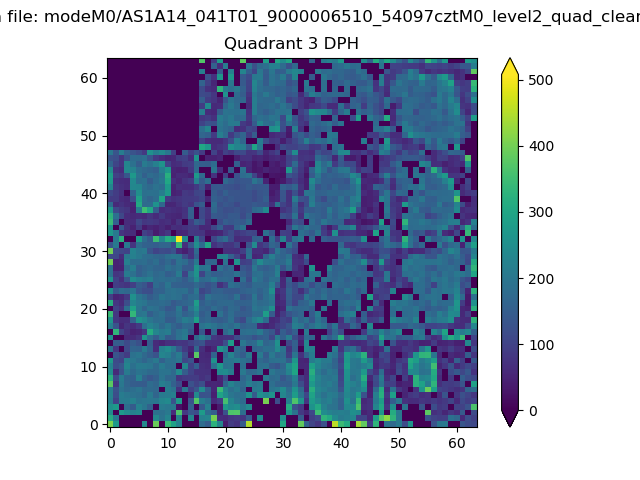 |
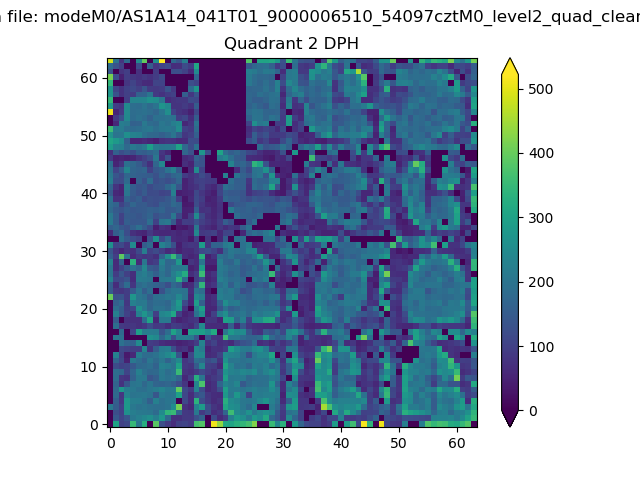 |
Quadrant C |
| Plot type | Count rate plots | Images |
|---|---|---|
| Comparison with Poisson distribution Blue bars denote a histogram of data divided into 1 sec bins. Red curve is a Poisson curve with rate = median count rate of data. |
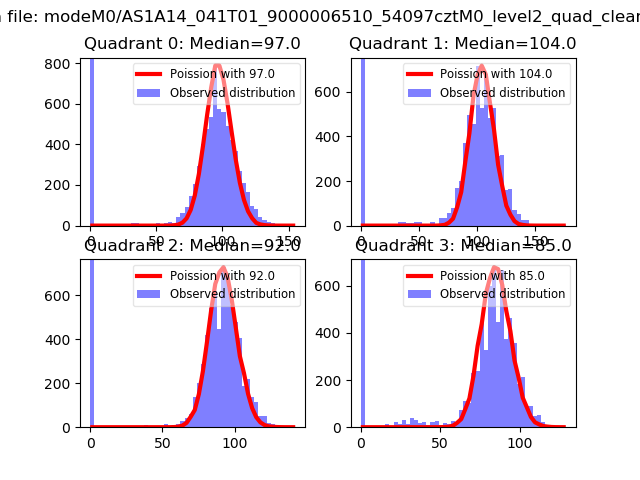 |
 |
| Quadrant-wise count rates Data is divided into 100 sec bins |
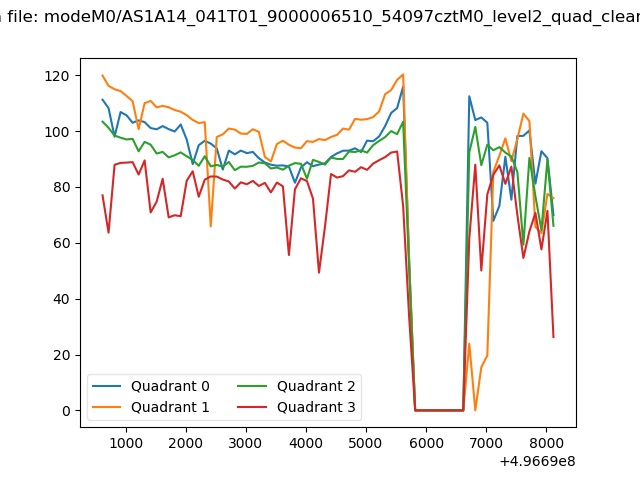 |
|
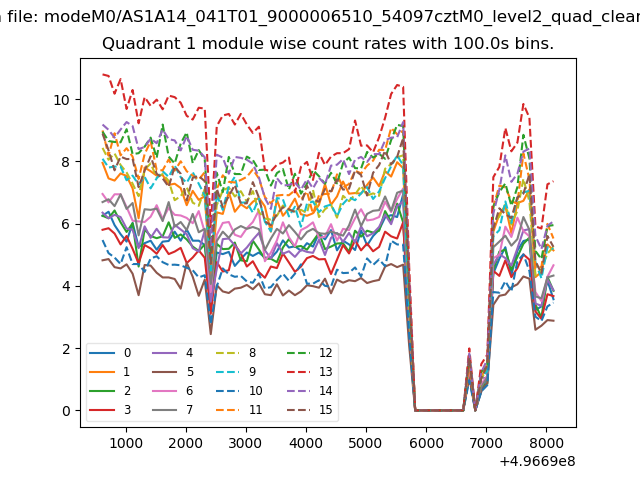
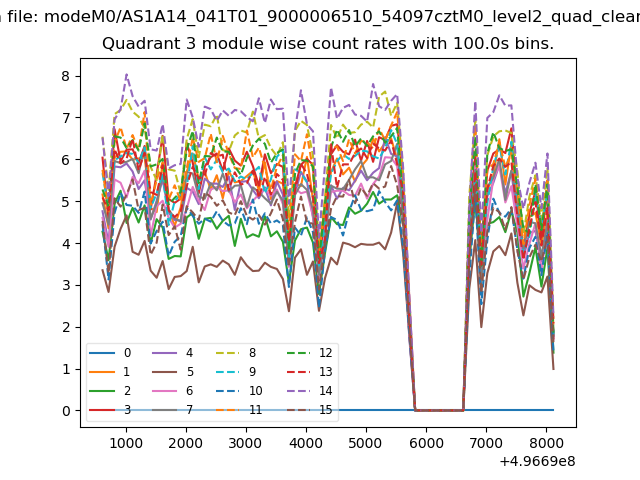
| Module-wise count rates for Quadrant A Data is divided into 100 sec bins |
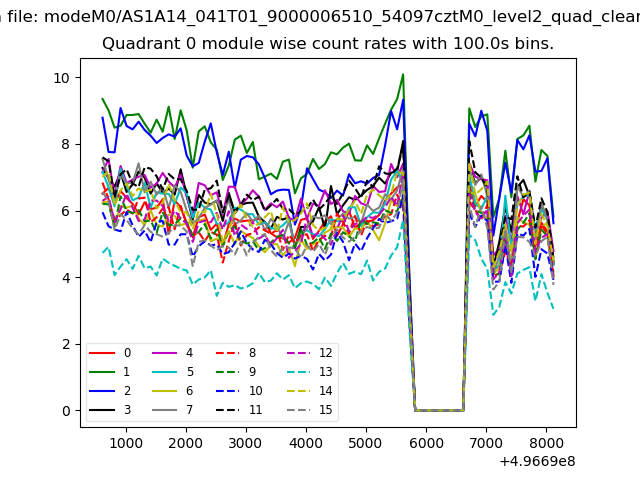 |
 |
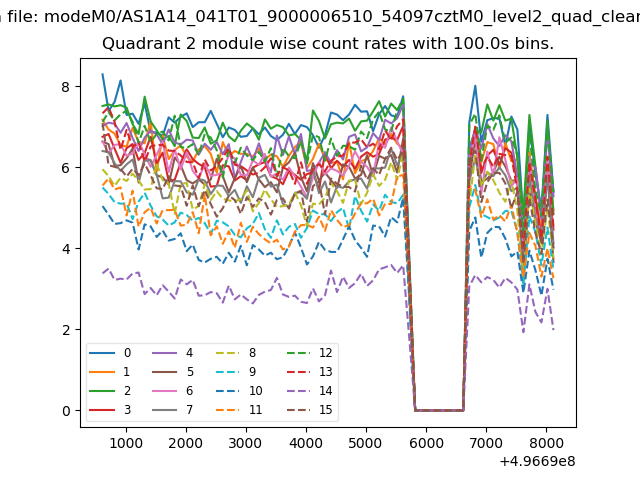
| Module-wise count rates for Quadrant B Data is divided into 100 sec bins |
 |
 |
| Module-wise count rates for Quadrant C Data is divided into 100 sec bins |
 |
 |
| Module-wise count rates for Quadrant D Data is divided into 100 sec bins |
 |
 |
| Parameter | Plot |
|---|---|
| CZT HV Monitor | 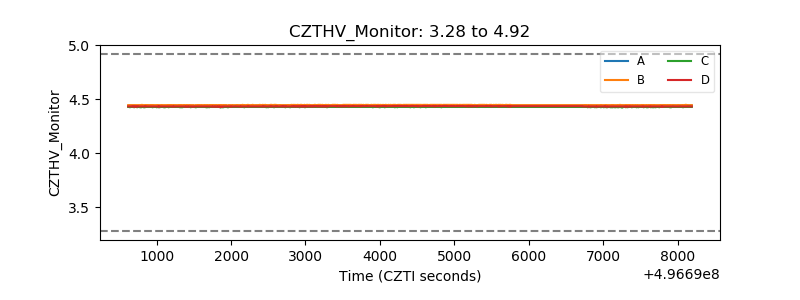 |
| D_VDD | 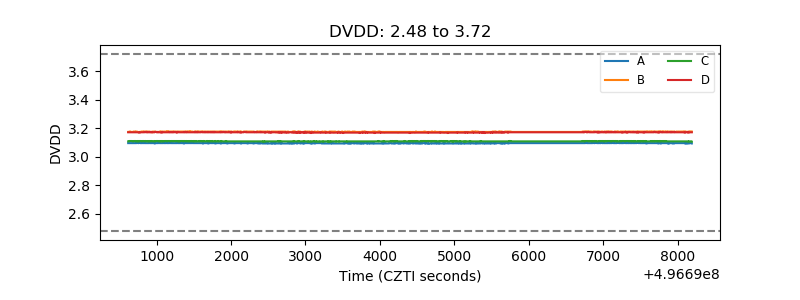 |
| Temperature 1 | 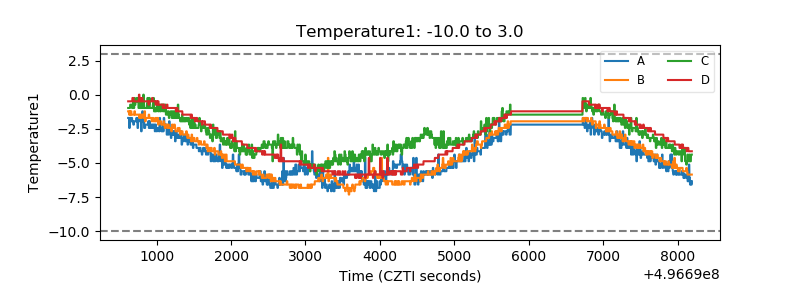 |
| Veto HV Monitor |  |
| Veto LLD | 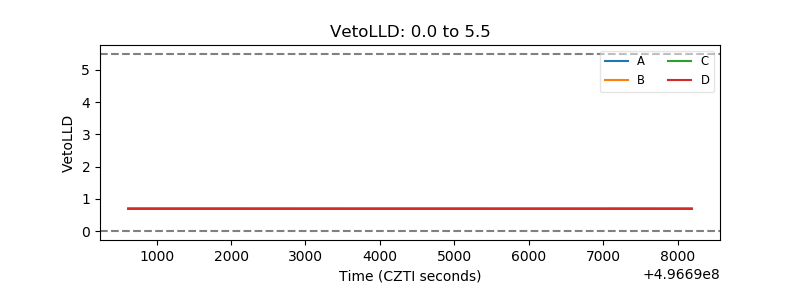 |
| Alpha Counter | 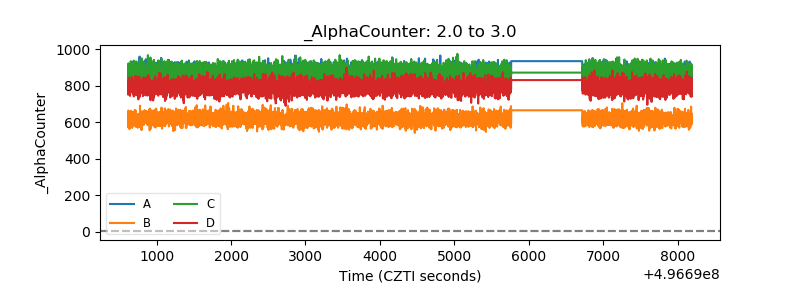 |
| _CPM_Rate | 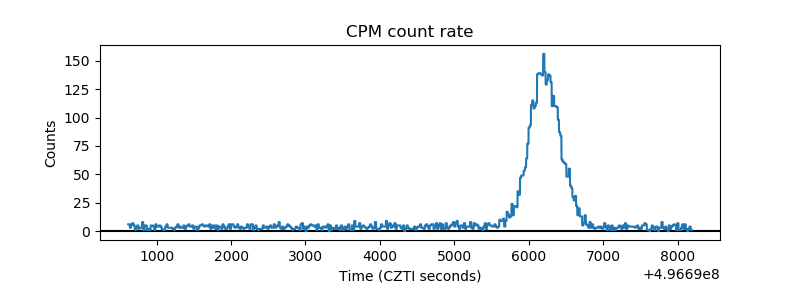 |
| CZT Counter | 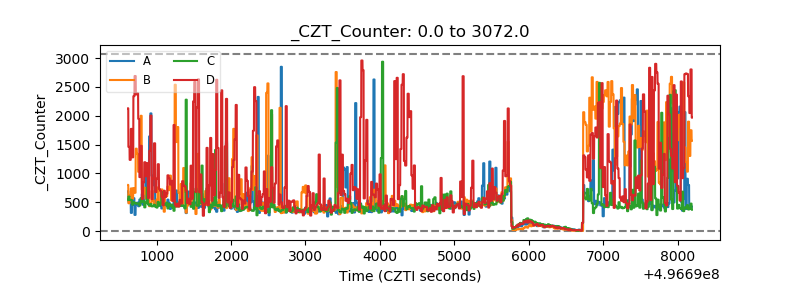 |
| +2.5 Volts monitor |  |
| +5 Volts monitor |  |
| _ROLL_ROT | 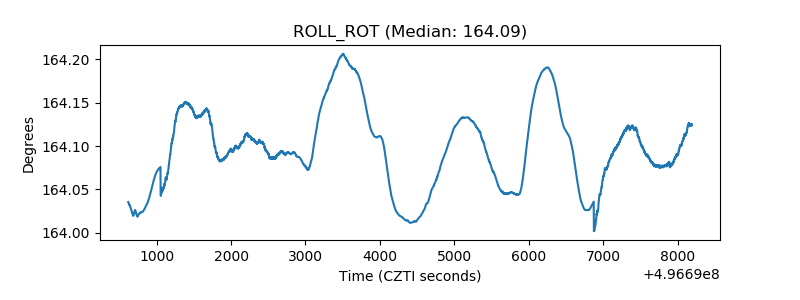 |
| _Roll_DEC | 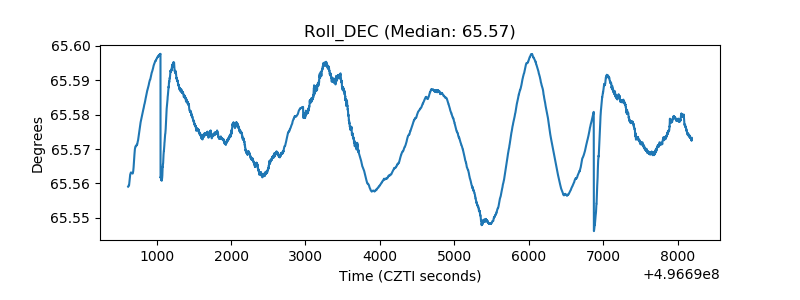 |
| _Roll_RA | 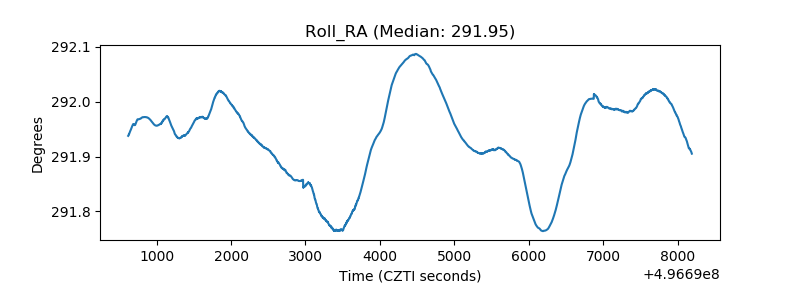 |
| Veto Counter | 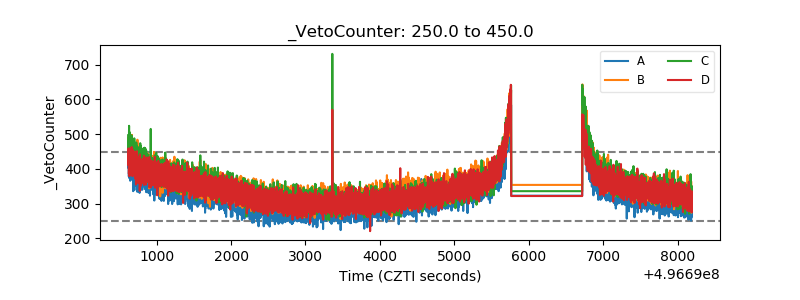 |