| Param | Original file | Final file |
|---|---|---|
| Filename | modeM0/AS1A14_041T01_9000006510_54098cztM0_level2.fits | modeM0/AS1A14_041T01_9000006510_54098cztM0_level2_quad_clean.evt |
| Size (bytes) | 713,070,720 | 93,214,080 |
| Size | 680.0 MB | 88.9 MB |
| Events in quadrant A | 3,863,549 | 665,706 |
| Events in quadrant B | 9,567,344 | 557,142 |
| Events in quadrant C | 5,788,177 | 557,293 |
| Events in quadrant D | 6,627,669 | 548,458 |
| Mode M9 | |||
|---|---|---|---|
| Quadrant | BADHDUFLAG | Total packets | Discarded packets |
| A | 0 | 6 | 0 |
| B | 0 | 6 | 0 |
| C | 0 | 6 | 0 |
| D | 0 | 6 | 0 |
| Mode SS | |||
|---|---|---|---|
| Quadrant | BADHDUFLAG | Total packets | Discarded packets |
| A | 0 | 144 | 0 |
| B | 0 | 144 | 0 |
| C | 0 | 144 | 0 |
| D | 0 | 144 | 0 |
| Mode M0 | |||
|---|---|---|---|
| Quadrant | BADHDUFLAG | Total packets | Discarded packets |
| A | 0 | 16800 | 3 |
| B | 0 | 33375 | 2 |
| C | 0 | 22383 | 2 |
| D | 0 | 24722 | 2 |
| Quadrant | Total seconds | Saturated seconds | Saturation percentage |
|---|---|---|---|
| A | 7087 | 195 | 2.751517% |
| B | 7088 | 1905 | 26.876411% |
| C | 7088 | 990 | 13.967269% |
| D | 7088 | 826 | 11.653499% |
Noise dominated data is calculated using 1-second bins in cleaned event files. If a bin has >2000 counts, and if more than 50% of those come from <1% of pixels, then it is considered to be noise-dominated and hence unusable.
| Quadrant | # 1 sec bins | Bins with >0 counts | Bins with >2000 counts | High rate bins dominated by noise | Noise dominated (total time) | Noise dominated (detector-on time) | Marked lightcurve |
|---|---|---|---|---|---|---|---|
| A | 7647 | 7088 | 164 | 164 | 2.14% | 2.31% | 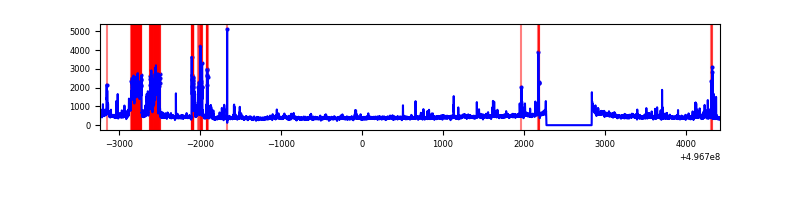 |
| B | 7648 | 7089 | 1500 | 1500 | 19.61% | 21.16% | 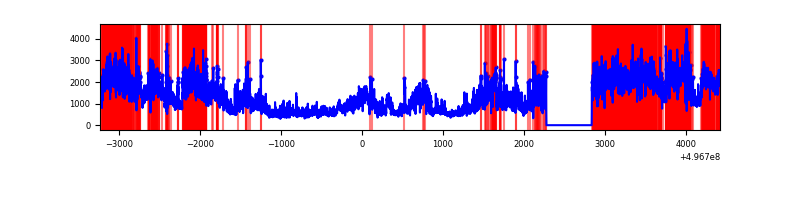 |
| C | 7648 | 7089 | 821 | 821 | 10.73% | 11.58% | 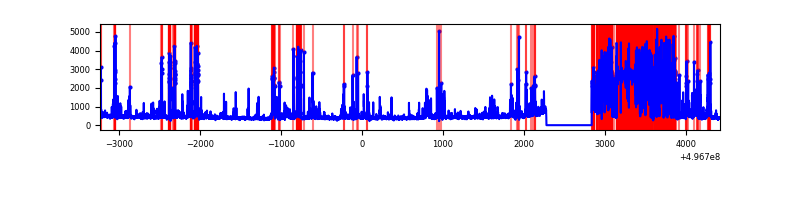 |
| D | 7648 | 7089 | 703 | 703 | 9.19% | 9.92% | 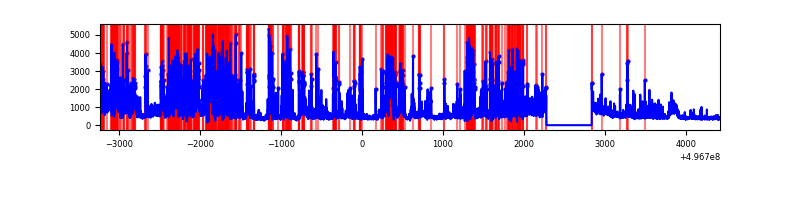 |
Top three noisy pixels from each quadrant. If the there are fewer than three noisy pixels in the level2.evt file, extra rows are filled as -1
| Pixel properties | Quadrant properties | ||||||
|---|---|---|---|---|---|---|---|
| Quadrant | DetID | PixID | Counts | Sigma | Mean | Median | Sigma |
| A | 12 | 115 | 521684 | 2838.44 | 737 | 718 | 183.5 |
| A | 15 | 174 | 207260 | 1125.33 | 737 | 718 | 183.5 |
| A | 0 | 8 | 47251 | 253.53 | 737 | 718 | 183.5 |
| B | 5 | 250 | 5930818 | 41186.86 | 675 | 650 | 144.0 |
| B | 15 | 20 | 404880 | 2807.5 | 675 | 650 | 144.0 |
| B | 0 | 213 | 218960 | 1516.23 | 675 | 650 | 144.0 |
| C | 1 | 241 | 2155192 | 11821.07 | 666 | 660 | 182.3 |
| C | 13 | 3 | 569721 | 3122.21 | 666 | 660 | 182.3 |
| C | 1 | 16 | 185880 | 1016.23 | 666 | 660 | 182.3 |
| D | 15 | 78 | 2798497 | 14301.07 | 689 | 658 | 195.6 |
| D | 3 | 12 | 314681 | 1605.12 | 689 | 658 | 195.6 |
| D | 2 | 172 | 299763 | 1528.87 | 689 | 658 | 195.6 |
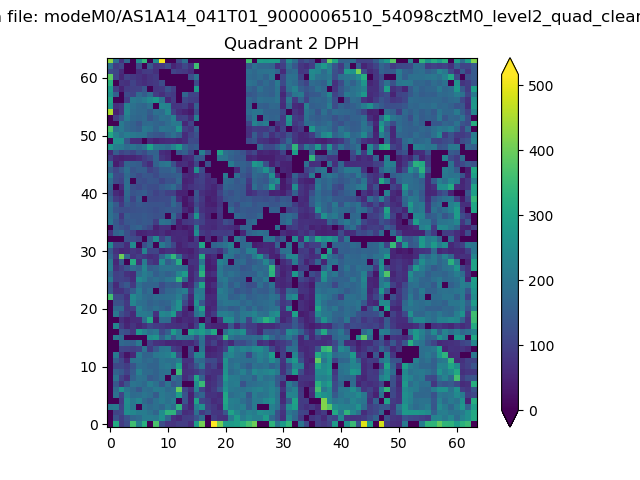
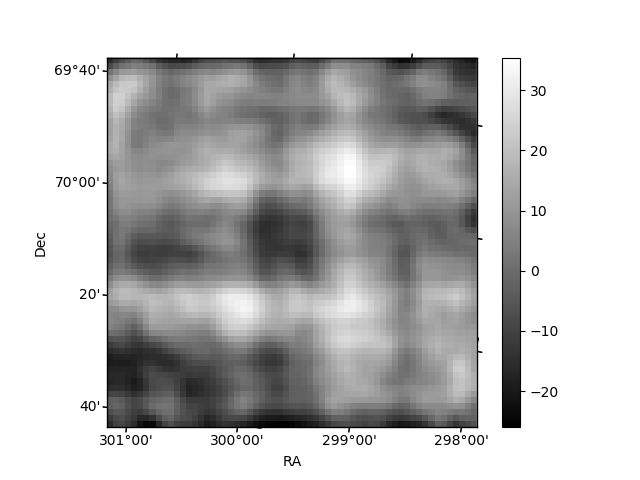
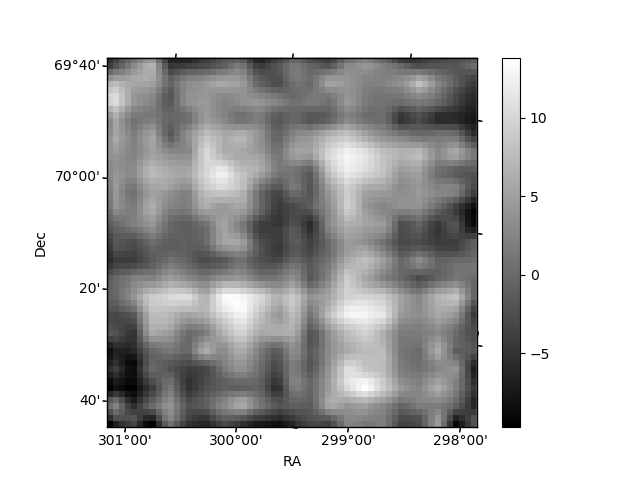
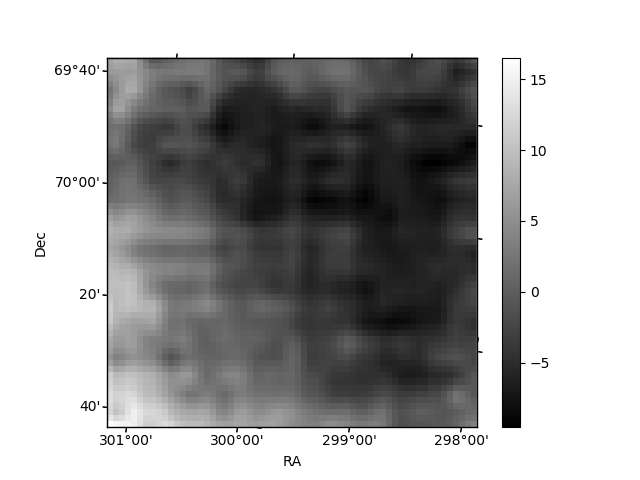
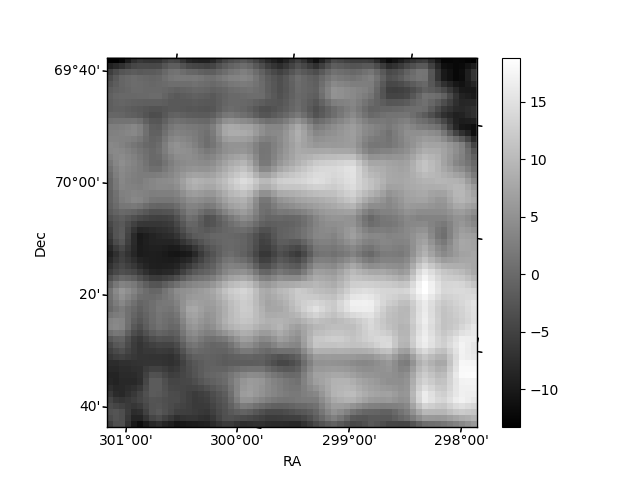
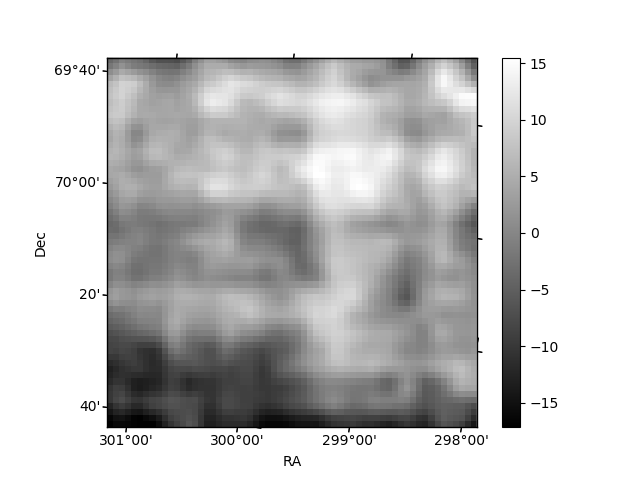
Histogram calculated using DETX and DETY for each event in the final _common_clean file
| Quadrant A | 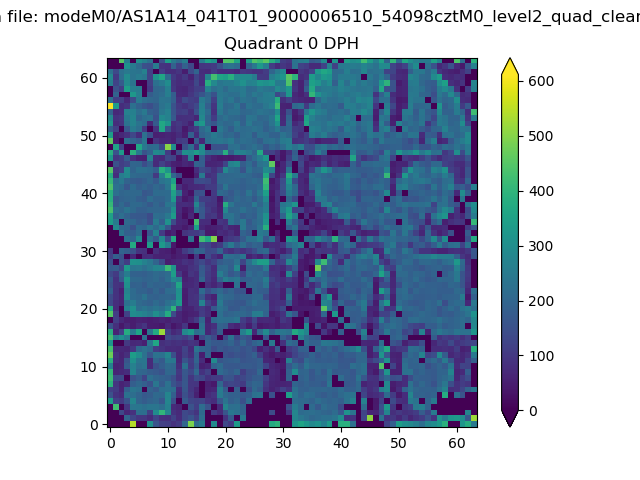 |
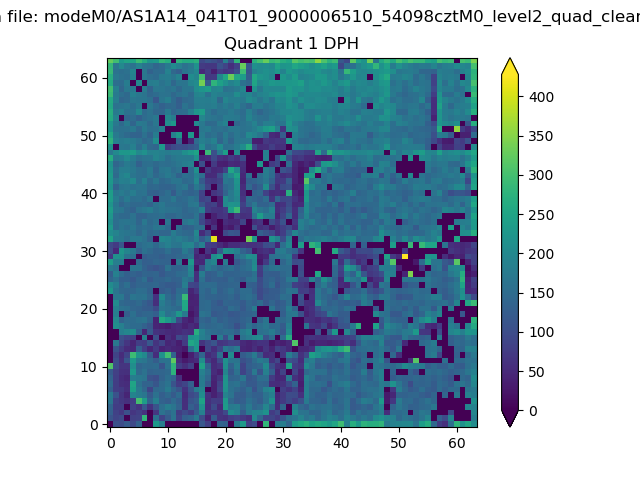 |
Quadrant B |
|---|---|---|---|
| Quadrant D | 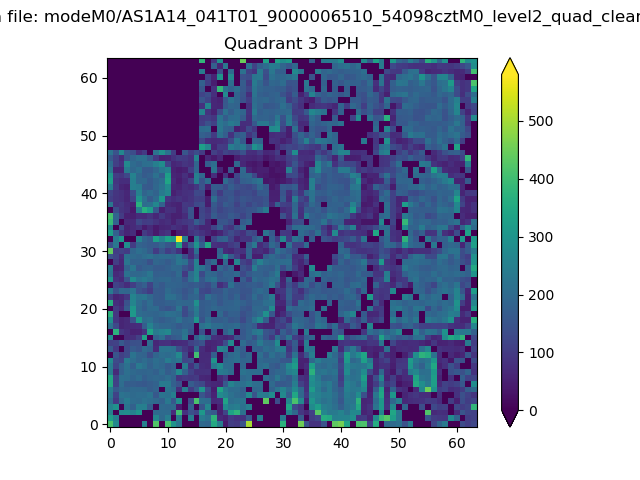 |
 |
Quadrant C |
| Plot type | Count rate plots | Images |
|---|---|---|
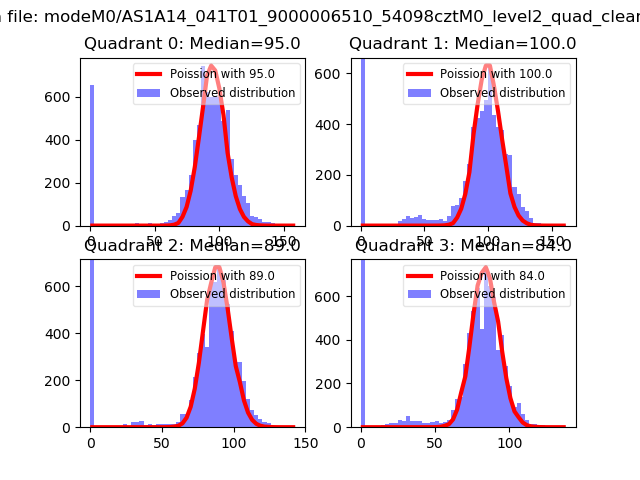
| Comparison with Poisson distribution Blue bars denote a histogram of data divided into 1 sec bins. Red curve is a Poisson curve with rate = median count rate of data. |
 |
 |
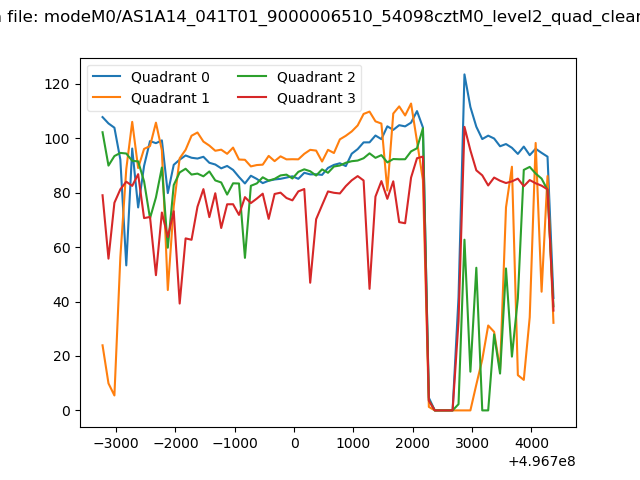
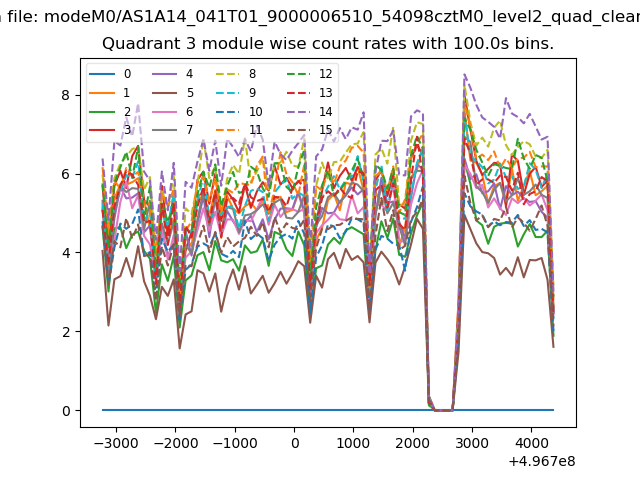
| Quadrant-wise count rates Data is divided into 100 sec bins |
 |
|
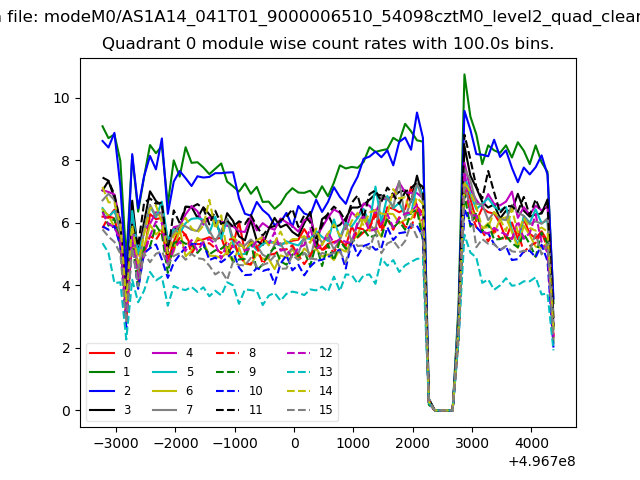
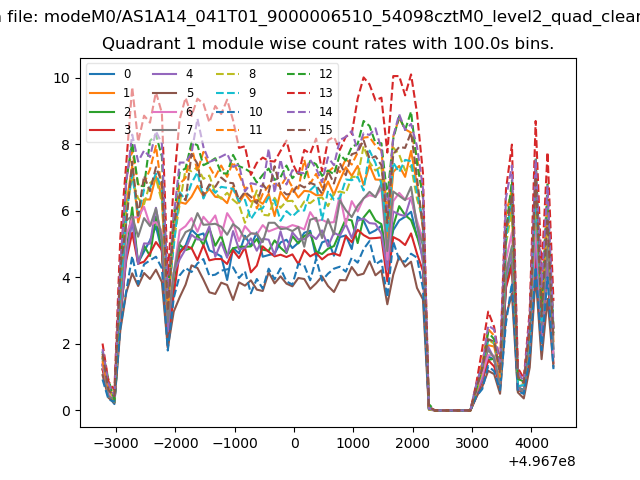
| Module-wise count rates for Quadrant A Data is divided into 100 sec bins |
 |
 |
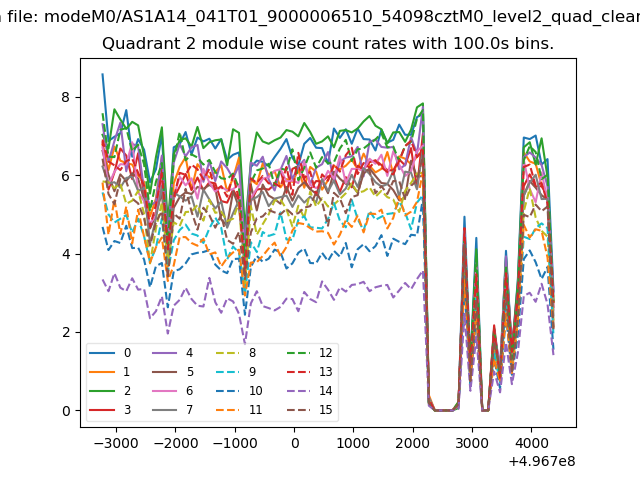
| Module-wise count rates for Quadrant B Data is divided into 100 sec bins |
 |
 |
| Module-wise count rates for Quadrant C Data is divided into 100 sec bins |
 |
 |
| Module-wise count rates for Quadrant D Data is divided into 100 sec bins |
 |
 |
| Parameter | Plot |
|---|---|
| CZT HV Monitor | 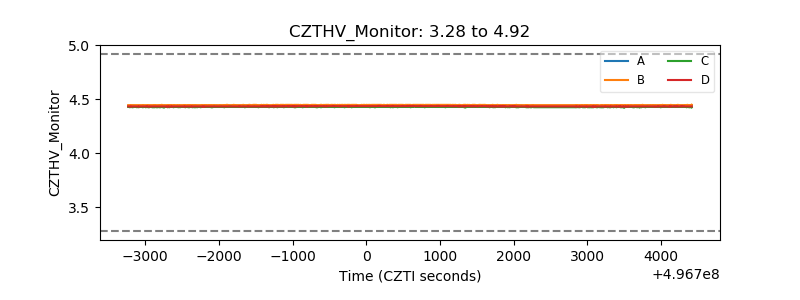 |
| D_VDD | 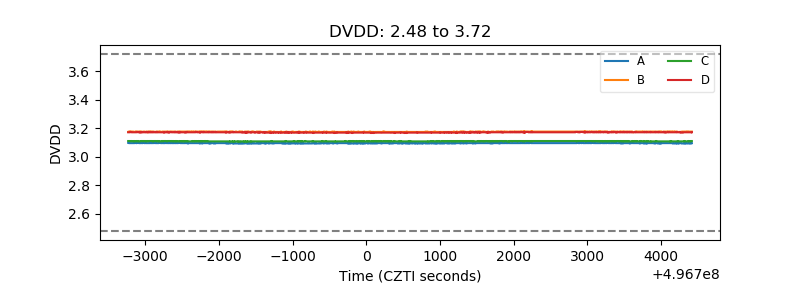 |
| Temperature 1 | 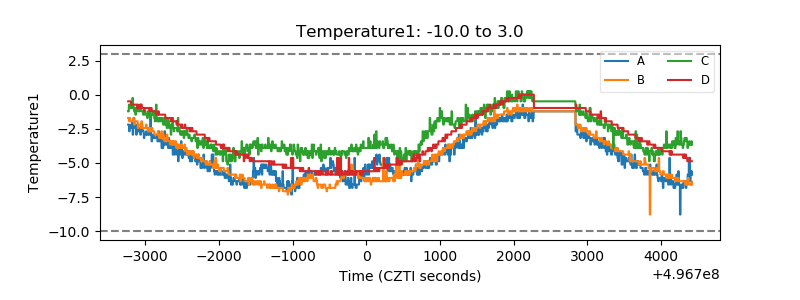 |
| Veto HV Monitor |  |
| Veto LLD | 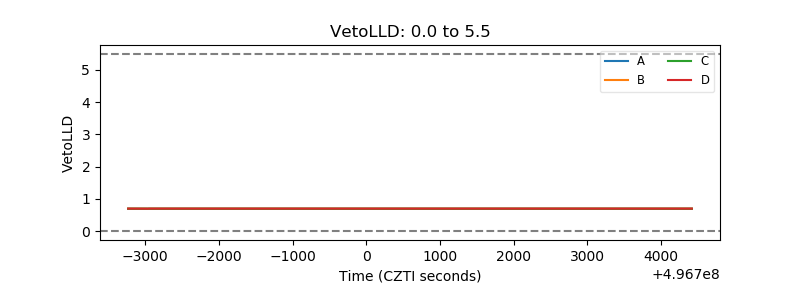 |
| Alpha Counter | 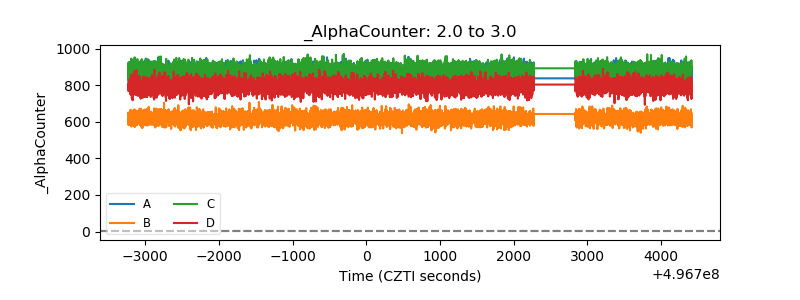 |
| _CPM_Rate | 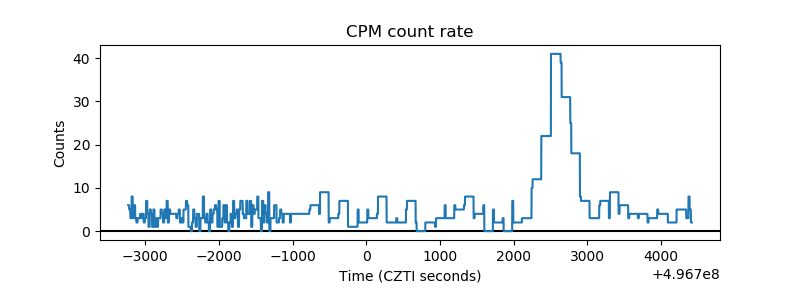 |
| CZT Counter | 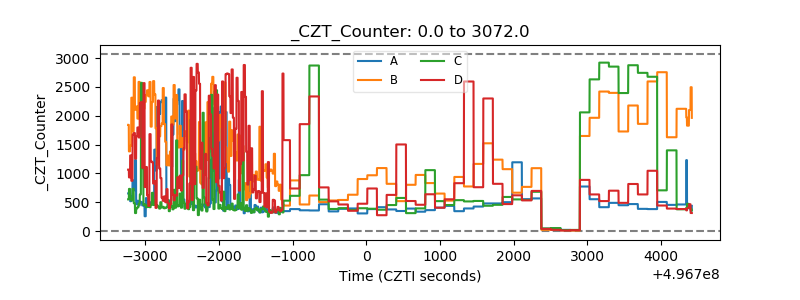 |
| +2.5 Volts monitor |  |
| +5 Volts monitor |  |
| _ROLL_ROT | 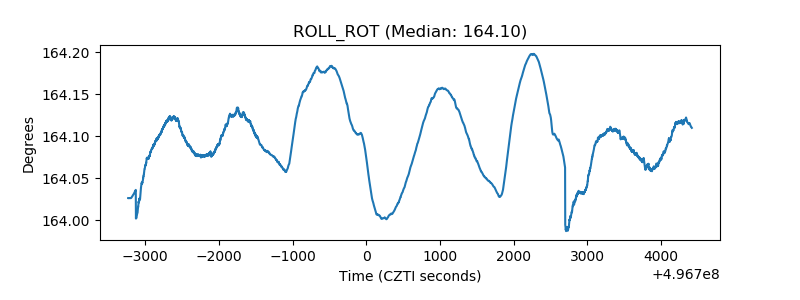 |
| _Roll_DEC | 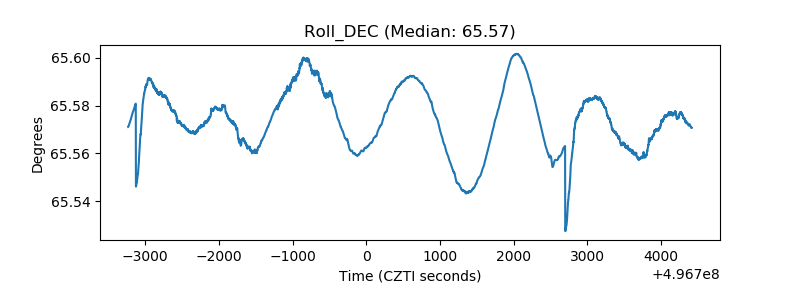 |
| _Roll_RA | 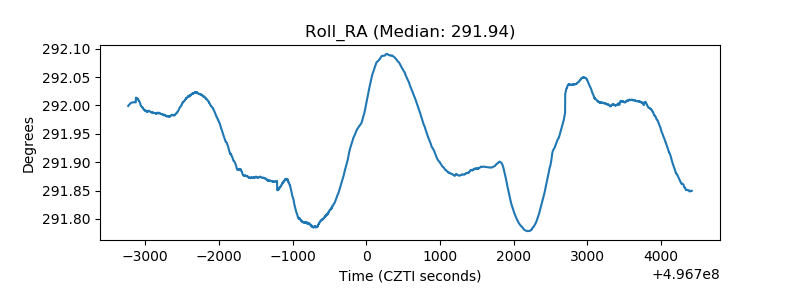 |
| Veto Counter | 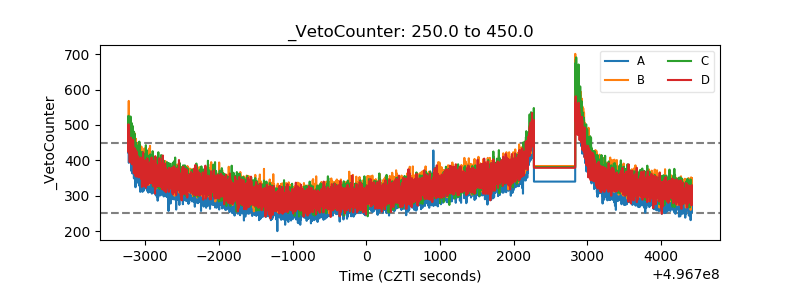 |