| Param | Original file | Final file |
|---|---|---|
| Filename | modeM0/AS1A14_041T01_9000006510_54099cztM0_level2.fits | modeM0/AS1A14_041T01_9000006510_54099cztM0_level2_quad_clean.evt |
| Size (bytes) | 751,429,440 | 100,918,080 |
| Size | 716.6 MB | 96.2 MB |
| Events in quadrant A | 3,942,407 | 741,575 |
| Events in quadrant B | 9,291,639 | 627,074 |
| Events in quadrant C | 7,704,029 | 543,091 |
| Events in quadrant D | 6,272,880 | 601,731 |
| Mode M9 | |||
|---|---|---|---|
| Quadrant | BADHDUFLAG | Total packets | Discarded packets |
| A | 0 | 6 | 0 |
| B | 0 | 6 | 0 |
| C | 0 | 6 | 0 |
| D | 0 | 6 | 0 |
| Mode SS | |||
|---|---|---|---|
| Quadrant | BADHDUFLAG | Total packets | Discarded packets |
| A | 0 | 158 | 0 |
| B | 0 | 158 | 0 |
| C | 0 | 158 | 0 |
| D | 0 | 158 | 0 |
| Mode M0 | |||
|---|---|---|---|
| Quadrant | BADHDUFLAG | Total packets | Discarded packets |
| A | 0 | 17461 | 1 |
| B | 0 | 33154 | 1 |
| C | 0 | 28563 | 1 |
| D | 0 | 24243 | 2 |
| Quadrant | Total seconds | Saturated seconds | Saturation percentage |
|---|---|---|---|
| A | 7794 | 108 | 1.385681% |
| B | 7794 | 1932 | 24.788299% |
| C | 7794 | 1768 | 22.684116% |
| D | 7794 | 738 | 9.468822% |
Noise dominated data is calculated using 1-second bins in cleaned event files. If a bin has >2000 counts, and if more than 50% of those come from <1% of pixels, then it is considered to be noise-dominated and hence unusable.
| Quadrant | # 1 sec bins | Bins with >0 counts | Bins with >2000 counts | High rate bins dominated by noise | Noise dominated (total time) | Noise dominated (detector-on time) | Marked lightcurve |
|---|---|---|---|---|---|---|---|
| A | 8354 | 7795 | 54 | 54 | 0.65% | 0.69% | 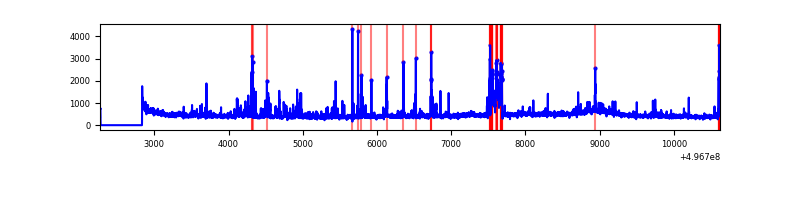 |
| B | 8354 | 7795 | 1324 | 1324 | 15.85% | 16.99% | 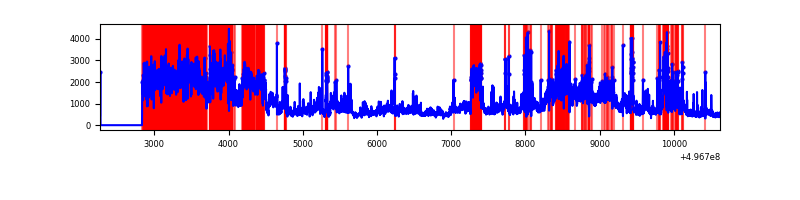 |
| C | 8354 | 7795 | 1505 | 1505 | 18.02% | 19.31% | 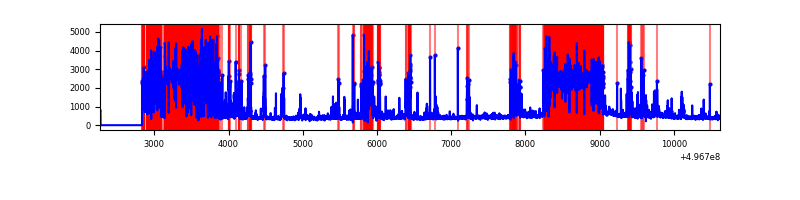 |
| D | 8354 | 7795 | 636 | 636 | 7.61% | 8.16% | 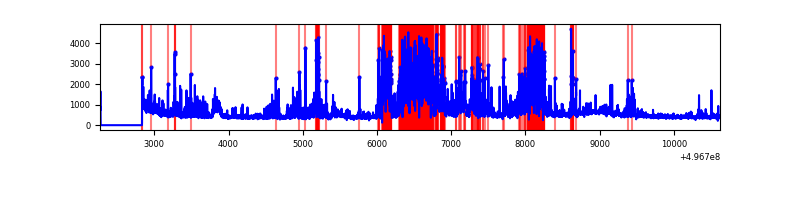 |
Top three noisy pixels from each quadrant. If the there are fewer than three noisy pixels in the level2.evt file, extra rows are filled as -1
| Pixel properties | Quadrant properties | ||||||
|---|---|---|---|---|---|---|---|
| Quadrant | DetID | PixID | Counts | Sigma | Mean | Median | Sigma |
| A | 7 | 14 | 185271 | 900.16 | 828 | 809 | 204.9 |
| A | 8 | 246 | 167251 | 812.23 | 828 | 809 | 204.9 |
| A | 0 | 8 | 64725 | 311.91 | 828 | 809 | 204.9 |
| B | 5 | 250 | 5126273 | 31185.03 | 768 | 738 | 164.4 |
| B | 15 | 20 | 218509 | 1324.97 | 768 | 738 | 164.4 |
| B | 0 | 213 | 209841 | 1272.23 | 768 | 738 | 164.4 |
| C | 1 | 241 | 3683165 | 19219.21 | 698 | 692 | 191.6 |
| C | 13 | 3 | 889789 | 4640.29 | 698 | 692 | 191.6 |
| C | 1 | 16 | 146029 | 758.53 | 698 | 692 | 191.6 |
| D | 8 | 176 | 1651323 | 7435.23 | 779 | 745 | 222.0 |
| D | 15 | 78 | 683651 | 3076.23 | 779 | 745 | 222.0 |
| D | 12 | 153 | 213562 | 958.66 | 779 | 745 | 222.0 |
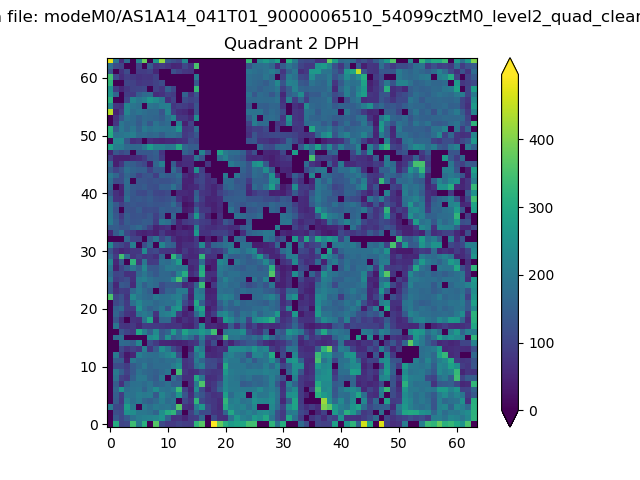
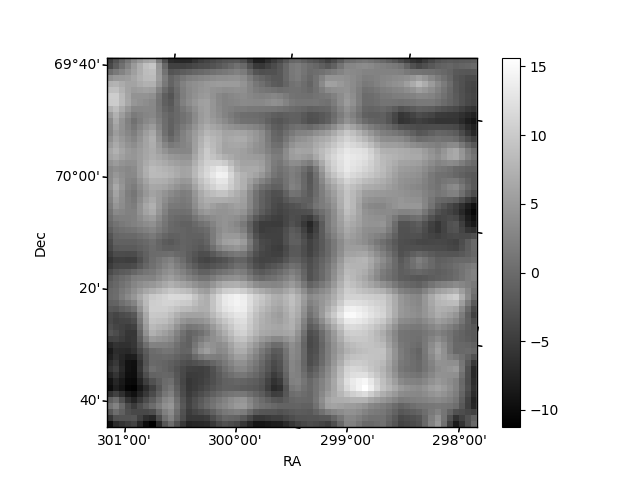
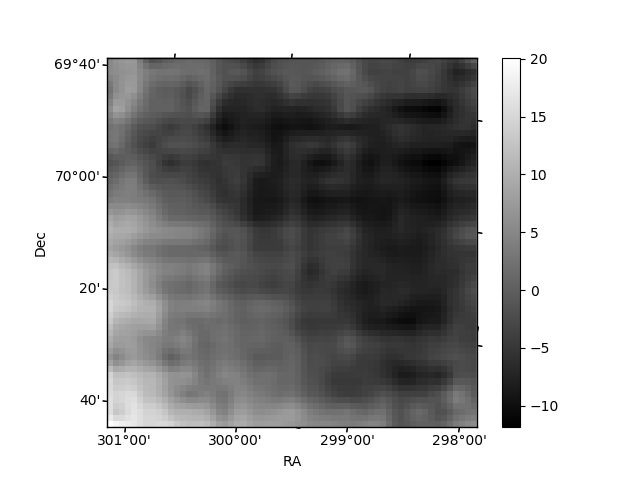
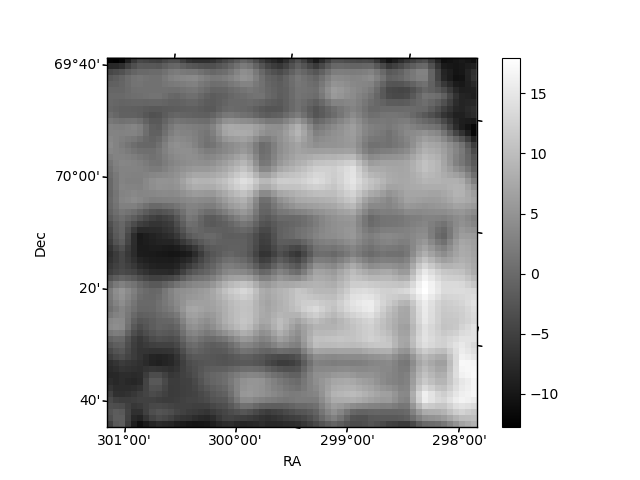
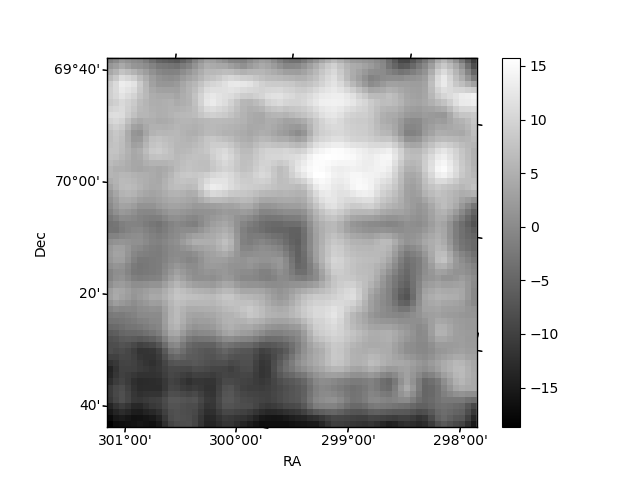
Histogram calculated using DETX and DETY for each event in the final _common_clean file
| Quadrant A | 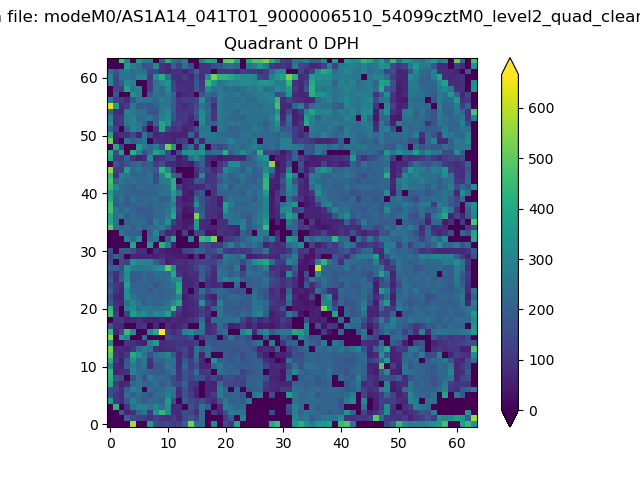 |
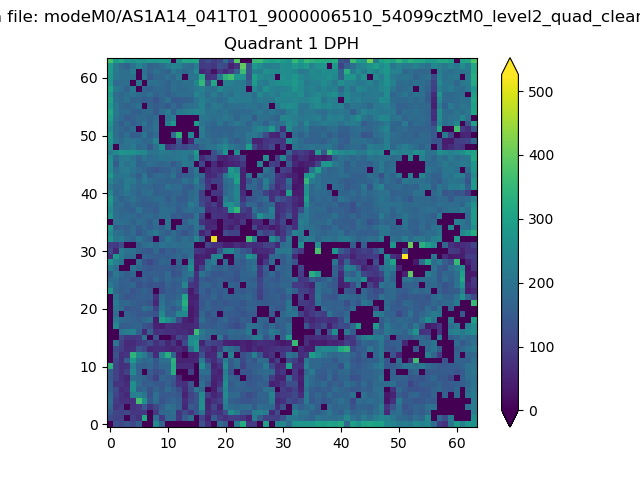 |
Quadrant B |
|---|---|---|---|
| Quadrant D | 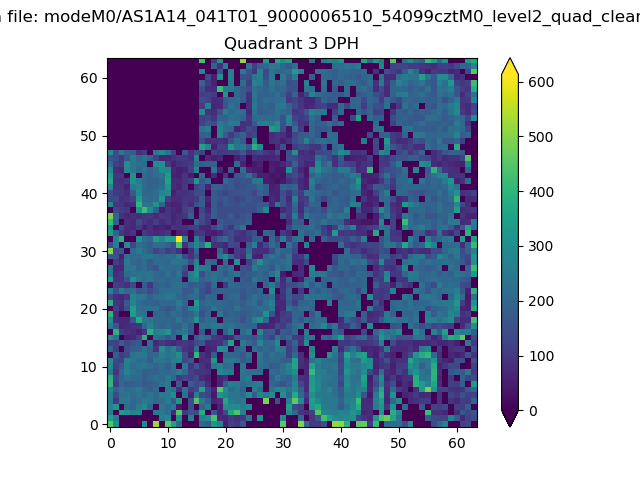 |
 |
Quadrant C |
| Plot type | Count rate plots | Images |
|---|---|---|
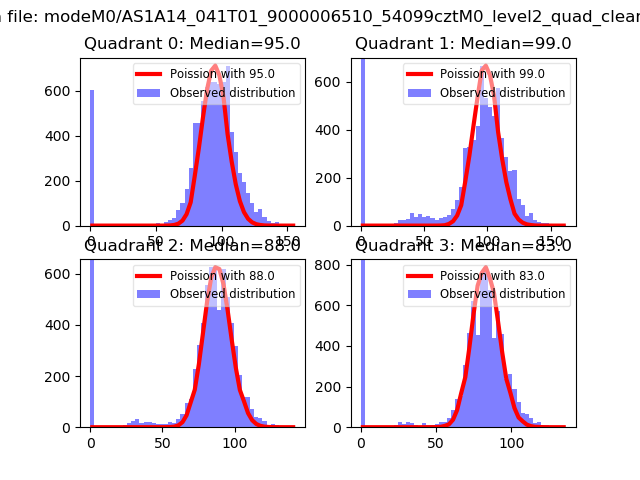
| Comparison with Poisson distribution Blue bars denote a histogram of data divided into 1 sec bins. Red curve is a Poisson curve with rate = median count rate of data. |
 |
 |
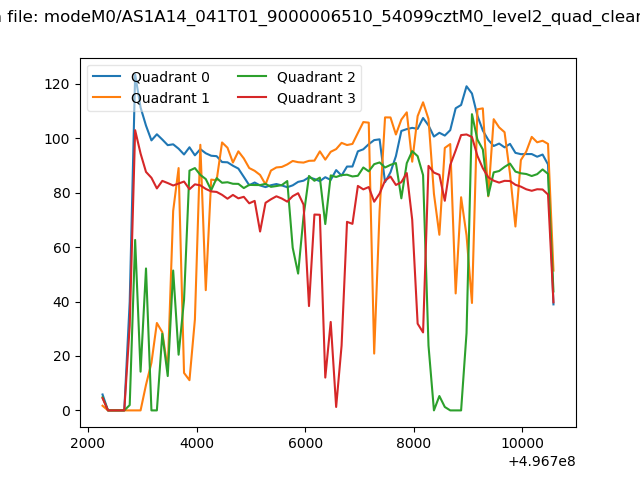
| Quadrant-wise count rates Data is divided into 100 sec bins |
 |
|
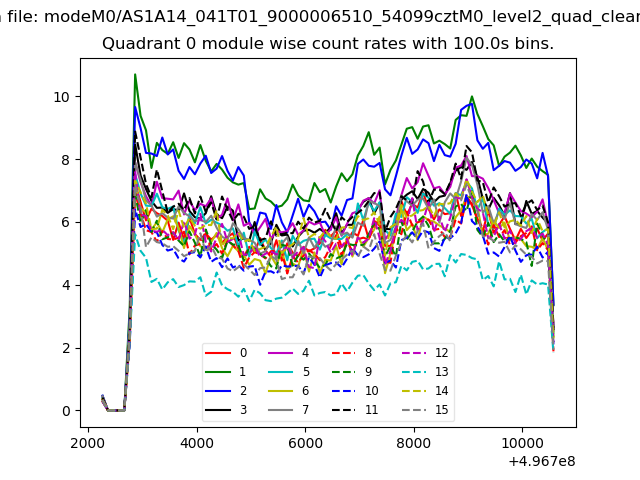
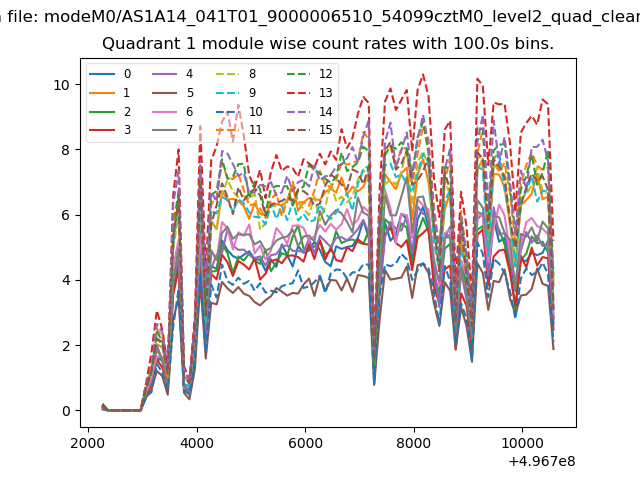
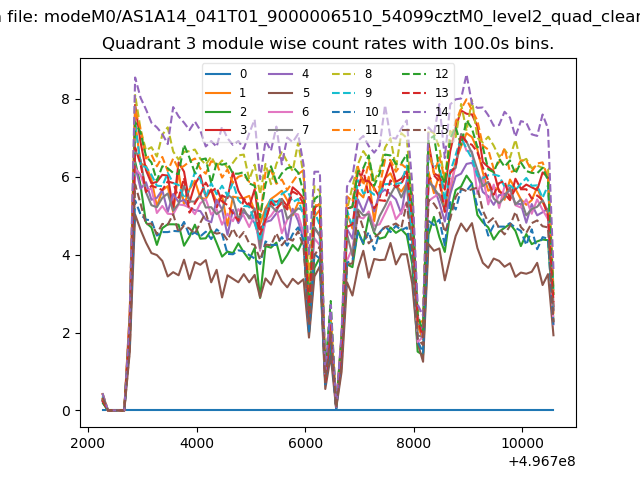
| Module-wise count rates for Quadrant A Data is divided into 100 sec bins |
 |
 |
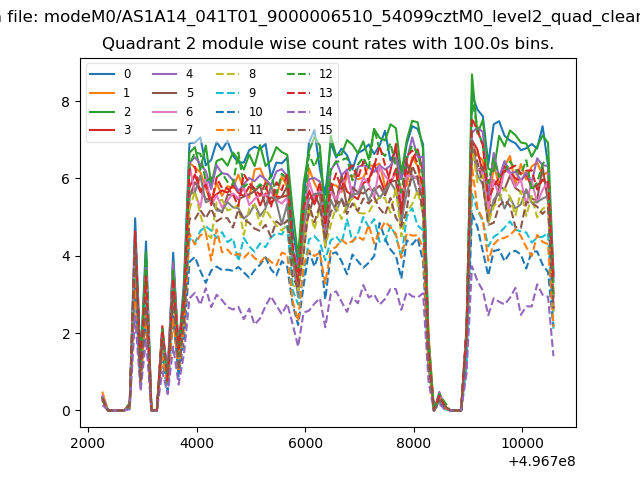
| Module-wise count rates for Quadrant B Data is divided into 100 sec bins |
 |
 |
| Module-wise count rates for Quadrant C Data is divided into 100 sec bins |
 |
 |
| Module-wise count rates for Quadrant D Data is divided into 100 sec bins |
 |
 |
| Parameter | Plot |
|---|---|
| CZT HV Monitor |  |
| D_VDD | 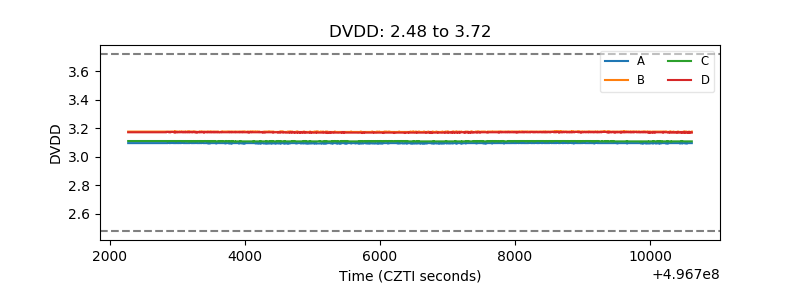 |
| Temperature 1 | 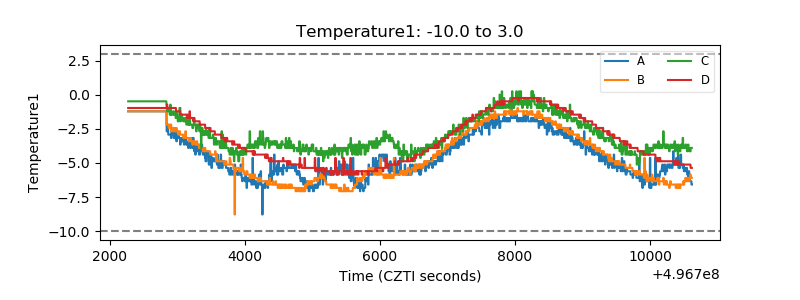 |
| Veto HV Monitor | 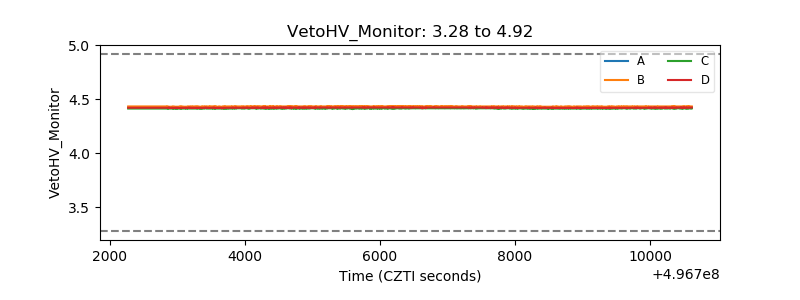 |
| Veto LLD | 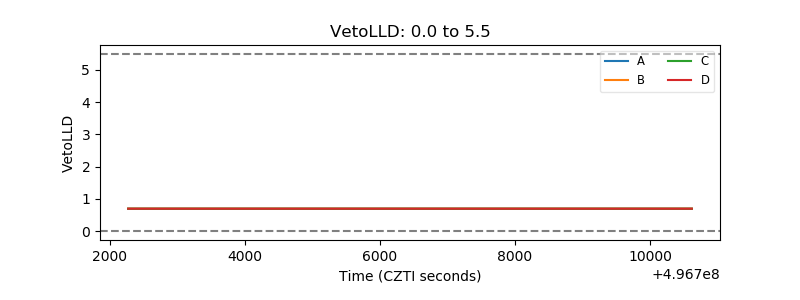 |
| Alpha Counter | 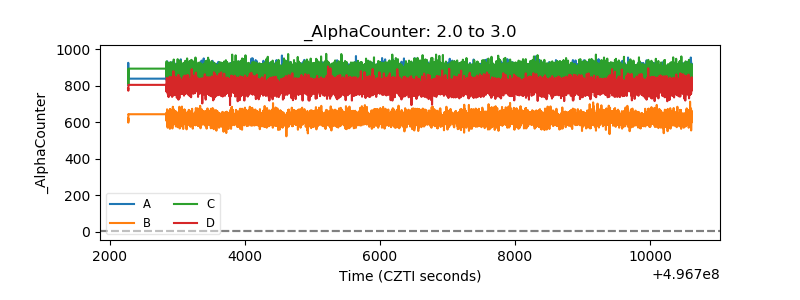 |
| _CPM_Rate | 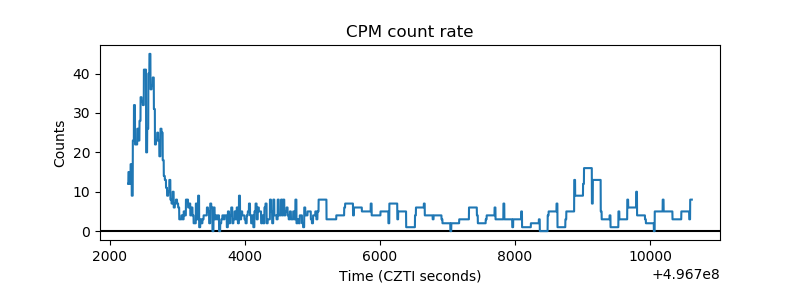 |
| CZT Counter | 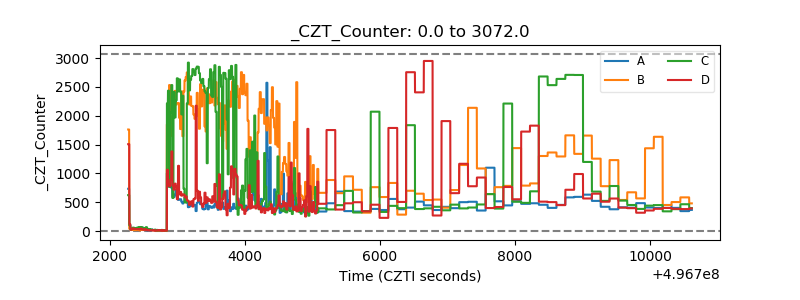 |
| +2.5 Volts monitor |  |
| +5 Volts monitor |  |
| _ROLL_ROT | 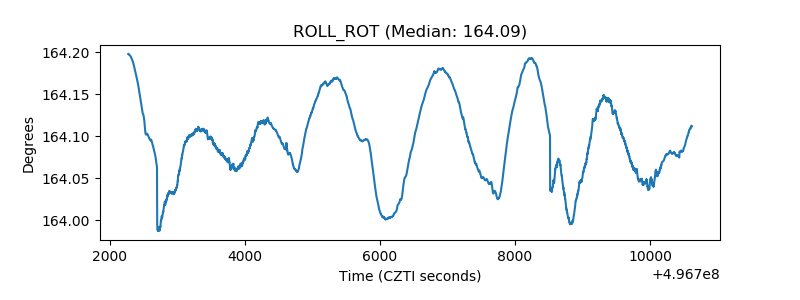 |
| _Roll_DEC | 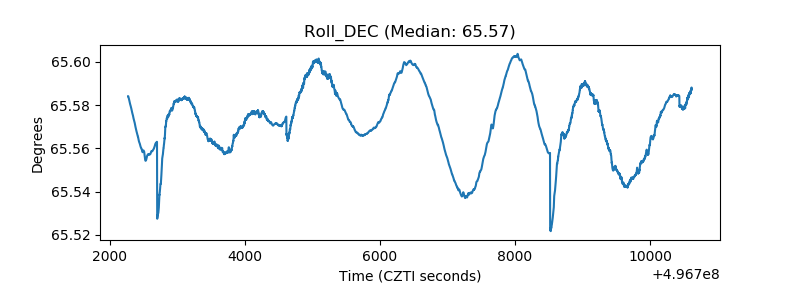 |
| _Roll_RA | 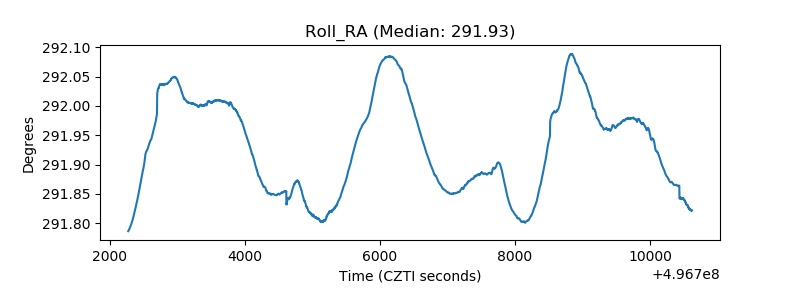 |
| Veto Counter | 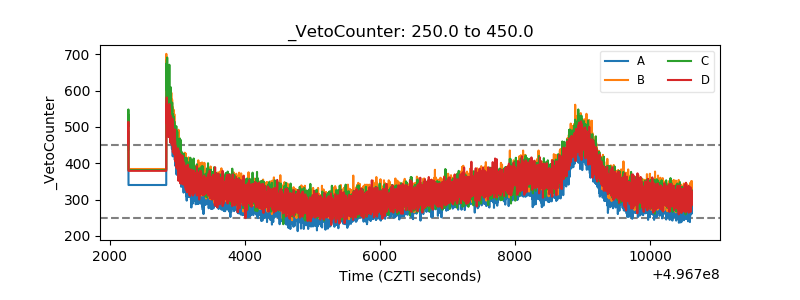 |