| Param | Original file | Final file |
|---|---|---|
| Filename | modeM0/AS1A14_041T01_9000006510_54100cztM0_level2.fits | modeM0/AS1A14_041T01_9000006510_54100cztM0_level2_quad_clean.evt |
| Size (bytes) | 650,574,720 | 117,106,560 |
| Size | 620.4 MB | 111.7 MB |
| Events in quadrant A | 3,867,495 | 804,522 |
| Events in quadrant B | 6,724,602 | 785,402 |
| Events in quadrant C | 7,864,246 | 655,168 |
| Events in quadrant D | 4,967,129 | 710,861 |
| Mode SS | |||
|---|---|---|---|
| Quadrant | BADHDUFLAG | Total packets | Discarded packets |
| A | 0 | 170 | 0 |
| B | 0 | 170 | 0 |
| C | 0 | 170 | 0 |
| D | 0 | 170 | 0 |
| Mode M0 | |||
|---|---|---|---|
| Quadrant | BADHDUFLAG | Total packets | Discarded packets |
| A | 0 | 17984 | 0 |
| B | 0 | 25956 | 0 |
| C | 0 | 29415 | 0 |
| D | 0 | 20959 | 0 |
| Quadrant | Total seconds | Saturated seconds | Saturation percentage |
|---|---|---|---|
| A | 8489 | 50 | 0.588998% |
| B | 8489 | 947 | 11.155613% |
| C | 8489 | 1239 | 14.595359% |
| D | 8490 | 114 | 1.342756% |
Noise dominated data is calculated using 1-second bins in cleaned event files. If a bin has >2000 counts, and if more than 50% of those come from <1% of pixels, then it is considered to be noise-dominated and hence unusable.
| Quadrant | # 1 sec bins | Bins with >0 counts | Bins with >2000 counts | High rate bins dominated by noise | Noise dominated (total time) | Noise dominated (detector-on time) | Marked lightcurve |
|---|---|---|---|---|---|---|---|
| A | 8489 | 8489 | 32 | 32 | 0.38% | 0.38% | 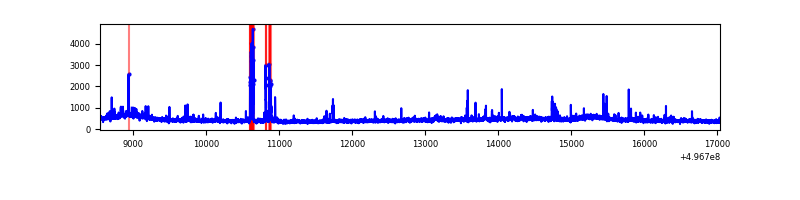 |
| B | 8489 | 8489 | 412 | 412 | 4.85% | 4.85% | 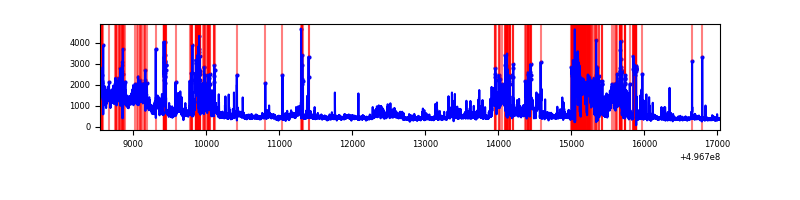 |
| C | 8489 | 8489 | 1123 | 1123 | 13.23% | 13.23% | 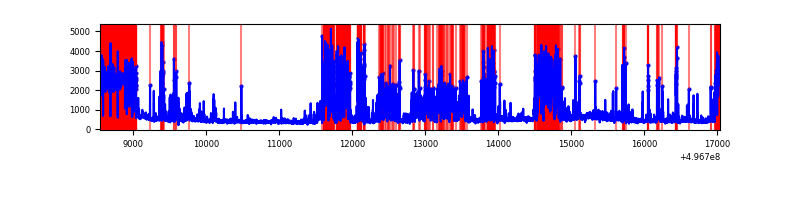 |
| D | 8490 | 8490 | 82 | 82 | 0.97% | 0.97% | 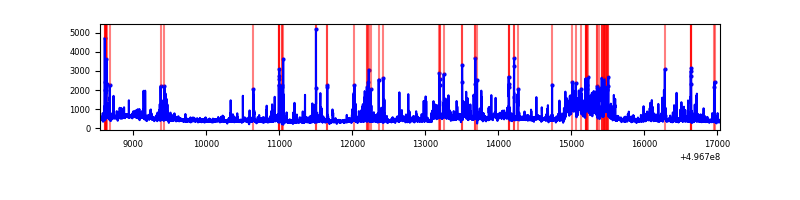 |
Top three noisy pixels from each quadrant. If the there are fewer than three noisy pixels in the level2.evt file, extra rows are filled as -1
| Pixel properties | Quadrant properties | ||||||
|---|---|---|---|---|---|---|---|
| Quadrant | DetID | PixID | Counts | Sigma | Mean | Median | Sigma |
| A | 13 | 248 | 149520 | 664.23 | 900 | 874 | 223.8 |
| A | 15 | 174 | 40796 | 178.39 | 900 | 874 | 223.8 |
| A | 0 | 8 | 35715 | 155.69 | 900 | 874 | 223.8 |
| B | 5 | 250 | 2407131 | 12962.64 | 870 | 840 | 185.6 |
| B | 1 | 255 | 198164 | 1062.98 | 870 | 840 | 185.6 |
| B | 7 | 252 | 168404 | 902.66 | 870 | 840 | 185.6 |
| C | 1 | 241 | 2805872 | 12545.14 | 812 | 803 | 223.6 |
| C | 1 | 16 | 1230639 | 5500.21 | 812 | 803 | 223.6 |
| C | 13 | 3 | 356332 | 1590.04 | 812 | 803 | 223.6 |
| D | 4 | 238 | 389885 | 1563.6 | 878 | 838 | 248.8 |
| D | 8 | 176 | 199256 | 797.45 | 878 | 838 | 248.8 |
| D | 3 | 12 | 166618 | 666.28 | 878 | 838 | 248.8 |
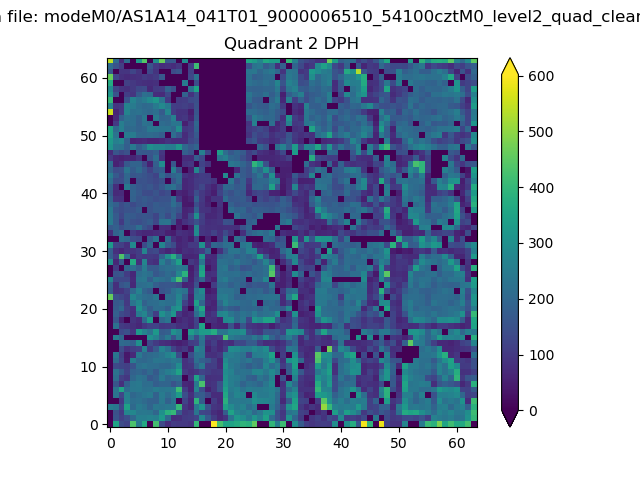
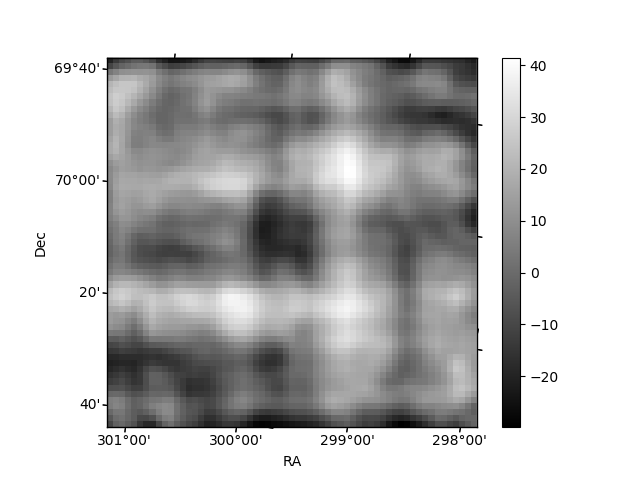
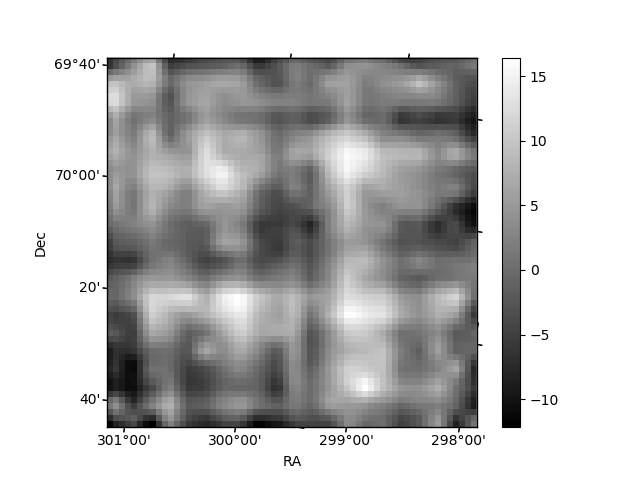
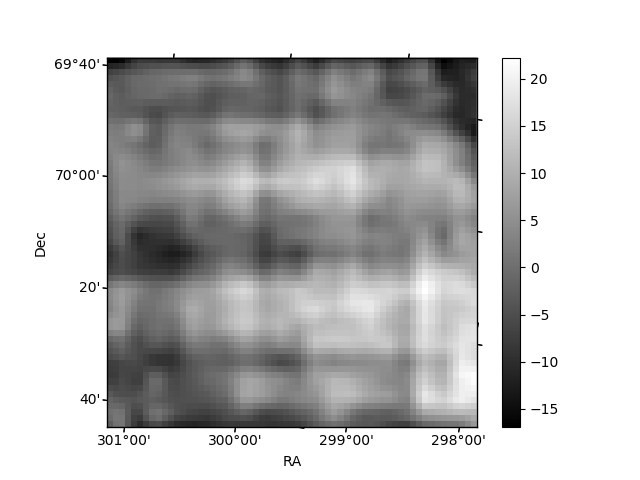
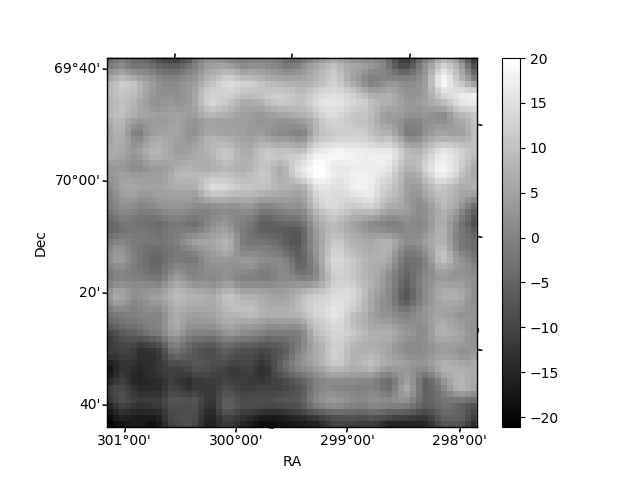
Histogram calculated using DETX and DETY for each event in the final _common_clean file
| Quadrant A | 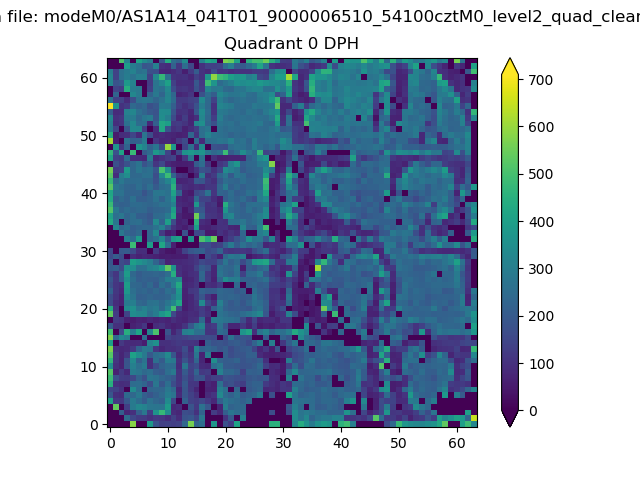 |
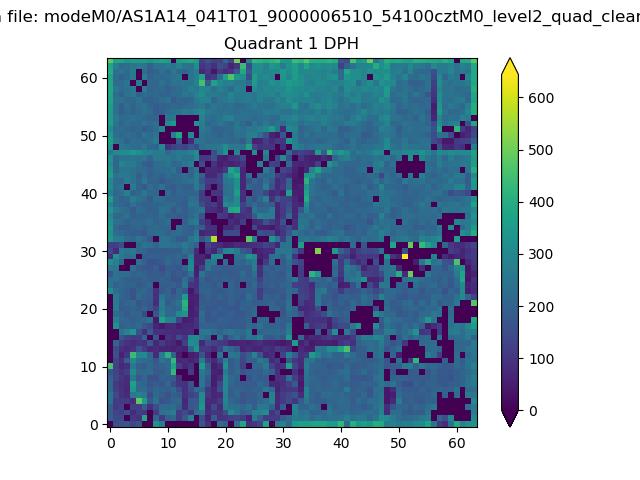 |
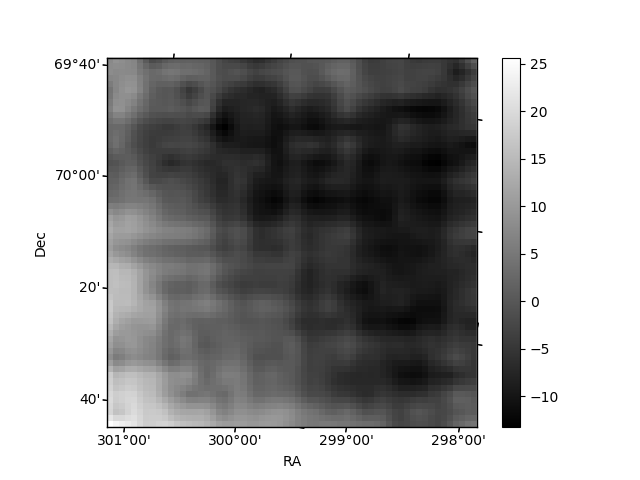
Quadrant B |
|---|---|---|---|
| Quadrant D | 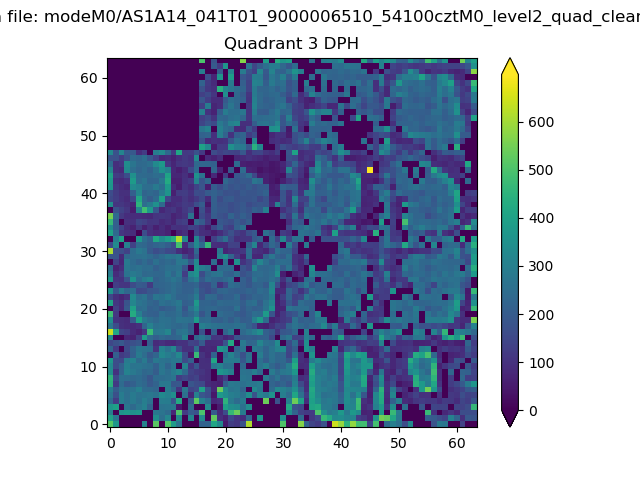 |
 |
Quadrant C |
| Plot type | Count rate plots | Images |
|---|---|---|
| Comparison with Poisson distribution Blue bars denote a histogram of data divided into 1 sec bins. Red curve is a Poisson curve with rate = median count rate of data. |
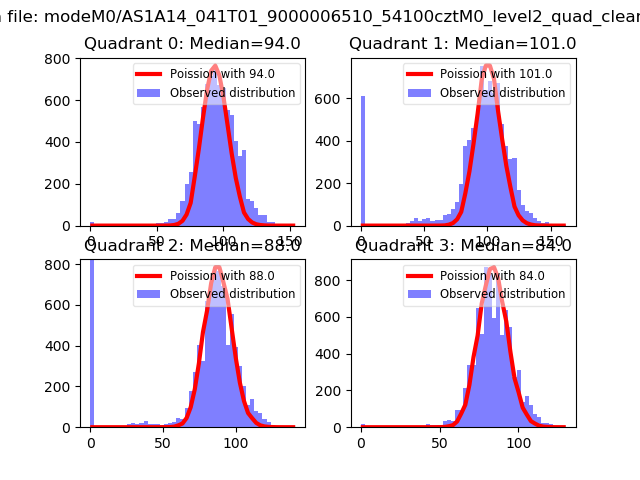 |
 |
| Quadrant-wise count rates Data is divided into 100 sec bins |
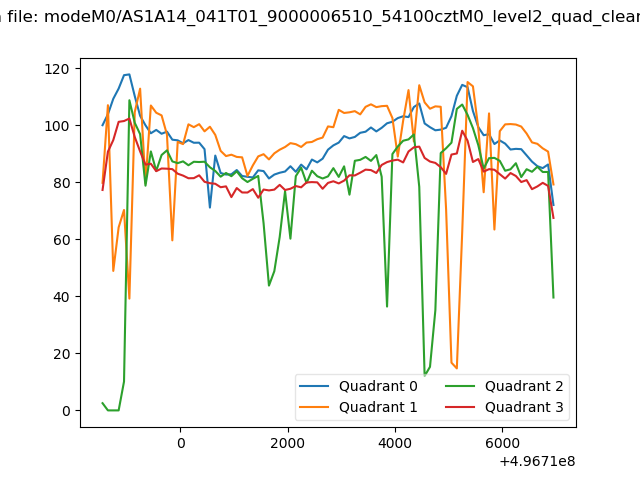 |
|
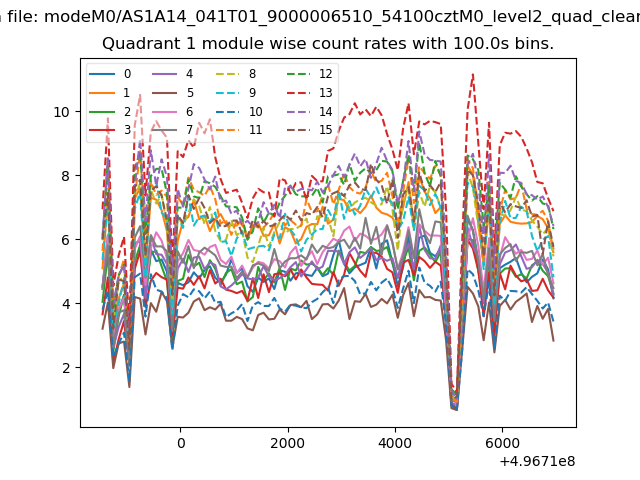
| Module-wise count rates for Quadrant A Data is divided into 100 sec bins |
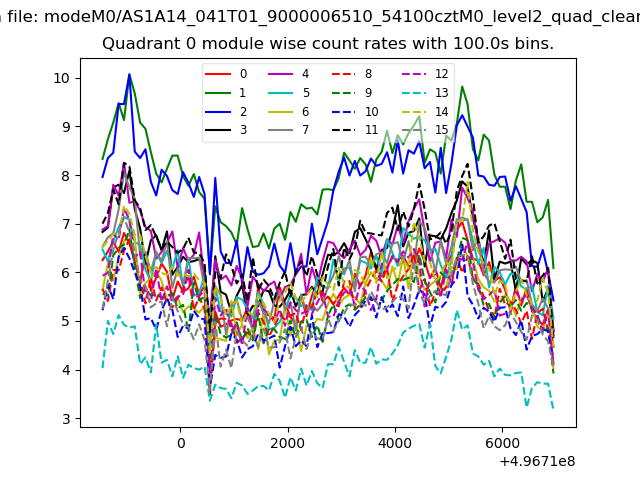 |
 |
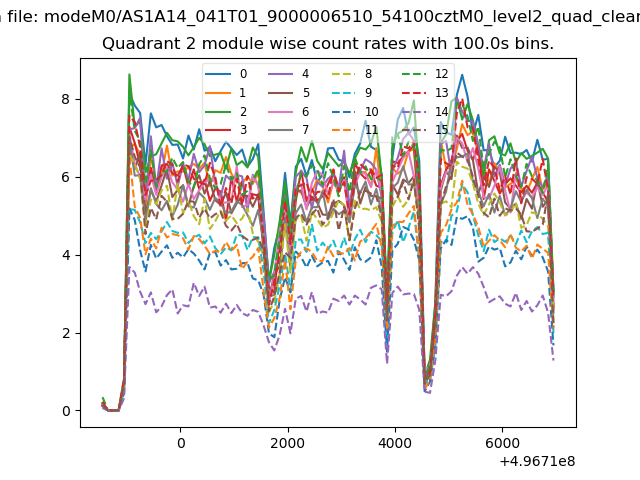
| Module-wise count rates for Quadrant B Data is divided into 100 sec bins |
 |
 |
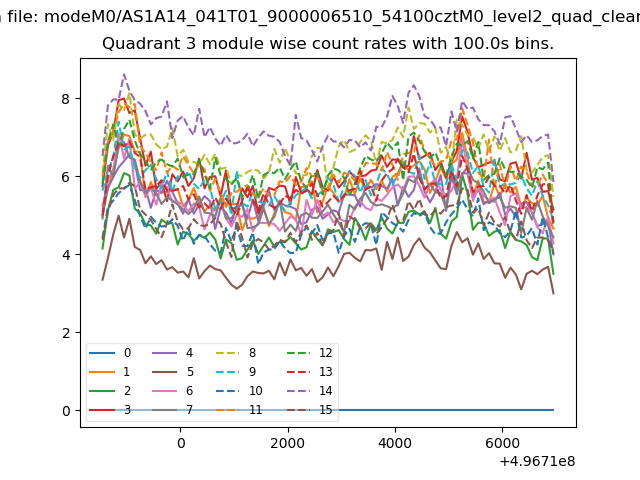
| Module-wise count rates for Quadrant C Data is divided into 100 sec bins |
 |
 |
| Module-wise count rates for Quadrant D Data is divided into 100 sec bins |
 |
 |
| Parameter | Plot |
|---|---|
| CZT HV Monitor | 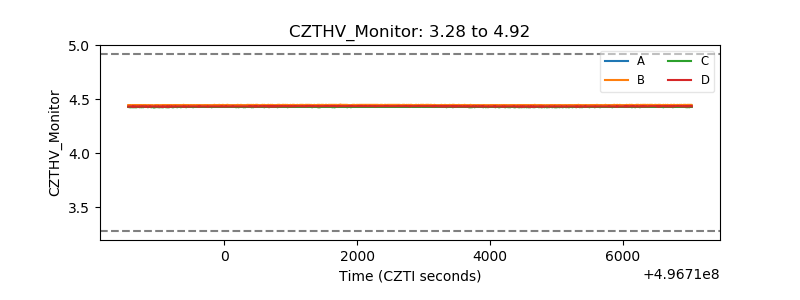 |
| D_VDD | 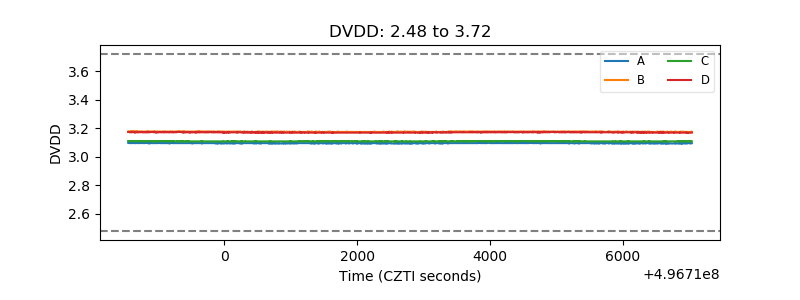 |
| Temperature 1 | 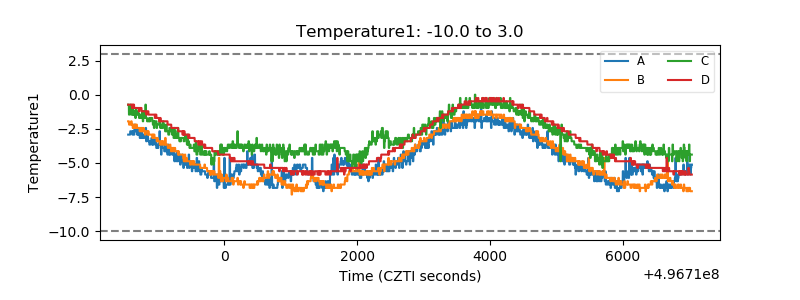 |
| Veto HV Monitor | 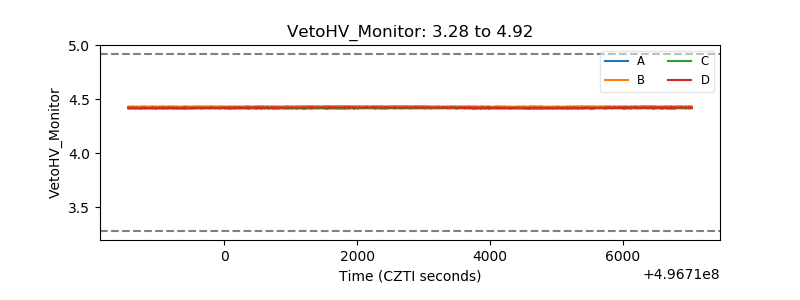 |
| Veto LLD | 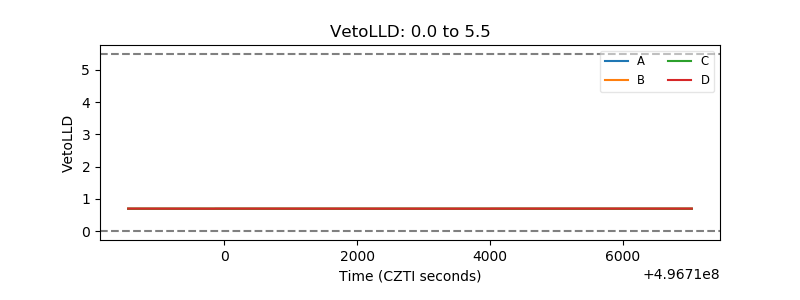 |
| Alpha Counter | 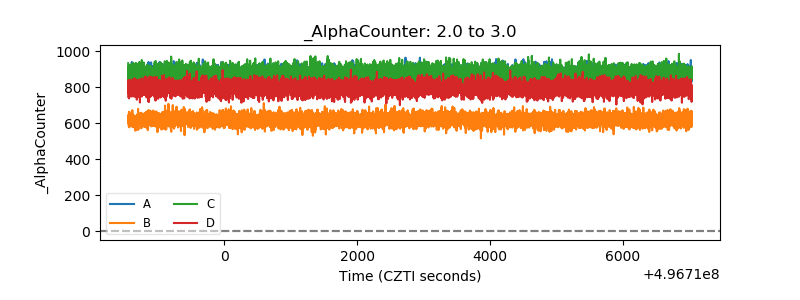 |
| _CPM_Rate | 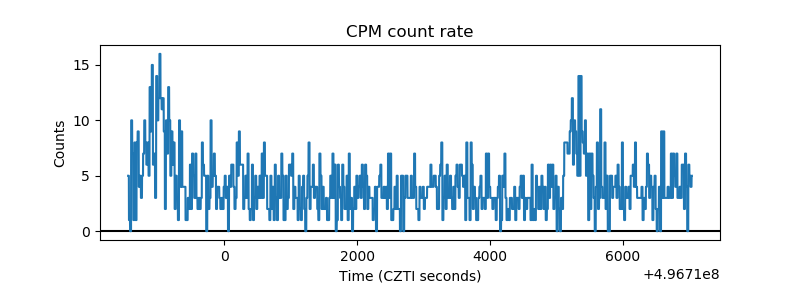 |
| CZT Counter | 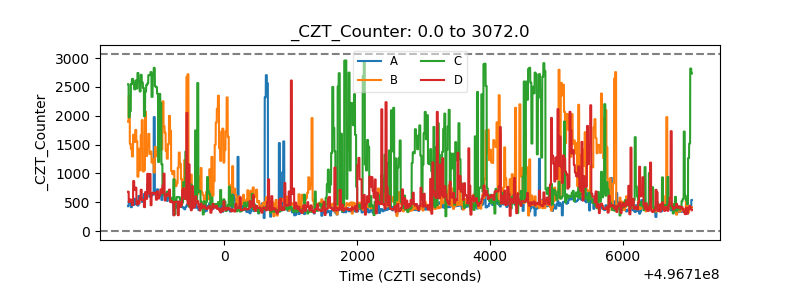 |
| +2.5 Volts monitor |  |
| +5 Volts monitor |  |
| _ROLL_ROT | 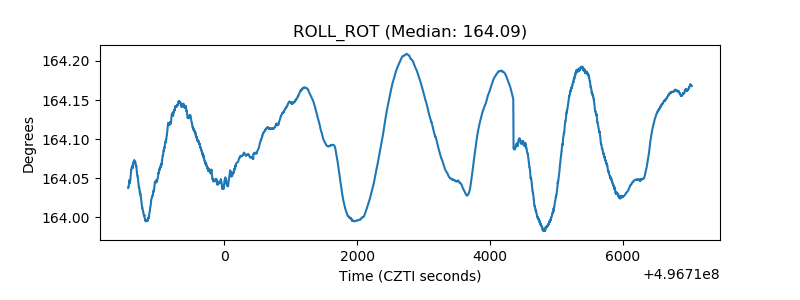 |
| _Roll_DEC | 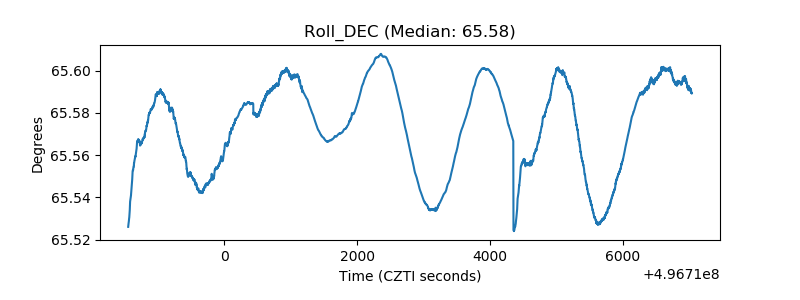 |
| _Roll_RA | 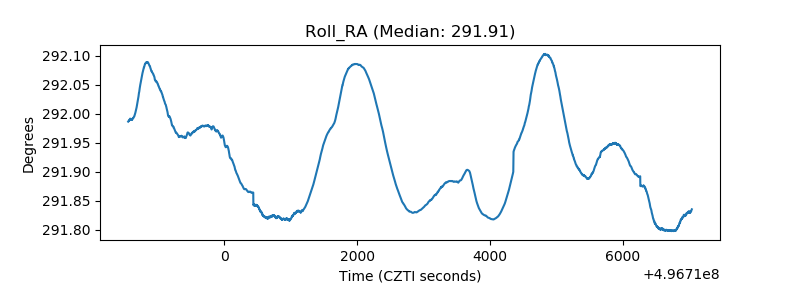 |
| Veto Counter | 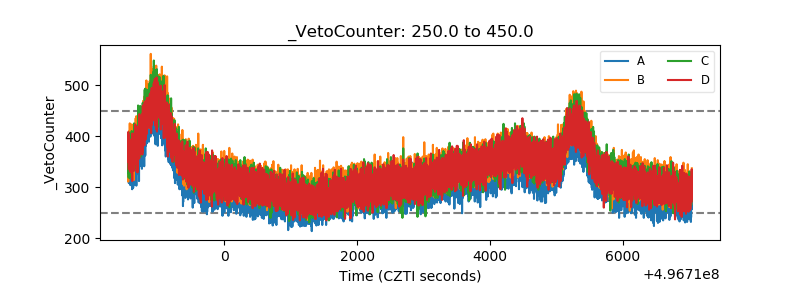 |