| Param | Original file | Final file |
|---|---|---|
| Filename | modeM0/AS1A14_012T01_9000006512_54105cztM0_level2.fits | modeM0/AS1A14_012T01_9000006512_54105cztM0_level2_quad_clean.evt |
| Size (bytes) | 452,718,720 | 89,159,040 |
| Size | 431.7 MB | 85.0 MB |
| Events in quadrant A | 3,162,396 | 597,405 |
| Events in quadrant B | 3,042,736 | 649,164 |
| Events in quadrant C | 3,146,007 | 575,624 |
| Events in quadrant D | 6,905,592 | 427,730 |
| Mode SS | |||
|---|---|---|---|
| Quadrant | BADHDUFLAG | Total packets | Discarded packets |
| A | 0 | 132 | 0 |
| B | 0 | 132 | 0 |
| C | 0 | 132 | 0 |
| D | 0 | 132 | 0 |
| Mode M0 | |||
|---|---|---|---|
| Quadrant | BADHDUFLAG | Total packets | Discarded packets |
| A | 0 | 14319 | 2 |
| B | 0 | 13875 | 1 |
| C | 0 | 14247 | 1 |
| D | 0 | 24994 | 1 |
| Mode M9 | |||
|---|---|---|---|
| Quadrant | BADHDUFLAG | Total packets | Discarded packets |
| A | 0 | 8 | 0 |
| B | 0 | 8 | 0 |
| C | 0 | 8 | 0 |
| D | 0 | 8 | 0 |
| Quadrant | Total seconds | Saturated seconds | Saturation percentage |
|---|---|---|---|
| A | 6441 | 146 | 2.266729% |
| B | 6442 | 102 | 1.583359% |
| C | 6442 | 99 | 1.536790% |
| D | 6442 | 1435 | 22.275691% |
Noise dominated data is calculated using 1-second bins in cleaned event files. If a bin has >2000 counts, and if more than 50% of those come from <1% of pixels, then it is considered to be noise-dominated and hence unusable.
| Quadrant | # 1 sec bins | Bins with >0 counts | Bins with >2000 counts | High rate bins dominated by noise | Noise dominated (total time) | Noise dominated (detector-on time) | Marked lightcurve |
|---|---|---|---|---|---|---|---|
| A | 7291 | 6441 | 64 | 64 | 0.88% | 0.99% | 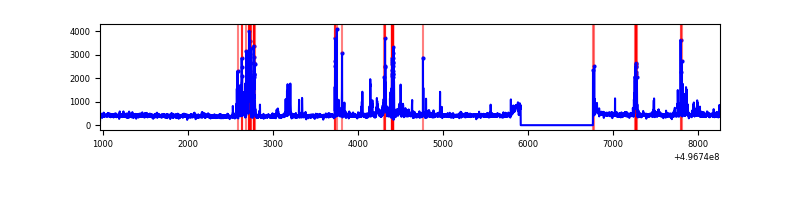 |
| B | 7292 | 6443 | 20 | 20 | 0.27% | 0.31% | 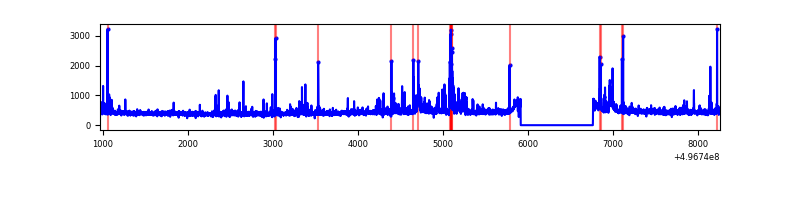 |
| C | 7292 | 6443 | 38 | 38 | 0.52% | 0.59% | 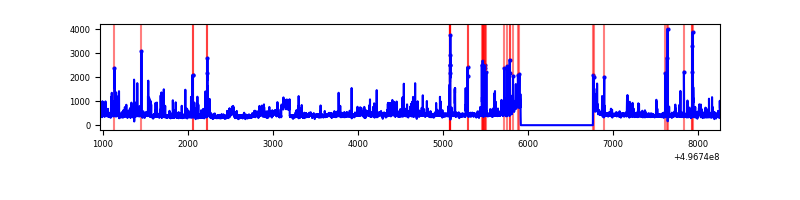 |
| D | 7292 | 6443 | 1247 | 1247 | 17.10% | 19.35% | 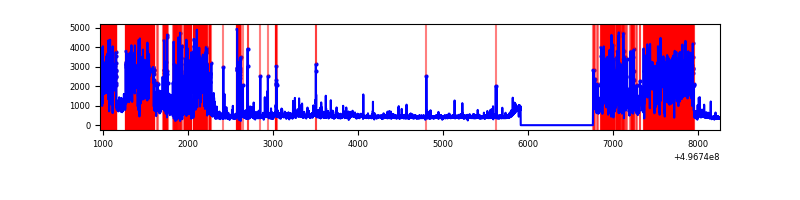 |
Top three noisy pixels from each quadrant. If the there are fewer than three noisy pixels in the level2.evt file, extra rows are filled as -1
| Pixel properties | Quadrant properties | ||||||
|---|---|---|---|---|---|---|---|
| Quadrant | DetID | PixID | Counts | Sigma | Mean | Median | Sigma |
| A | 15 | 174 | 315448 | 1914.18 | 670 | 653 | 164.5 |
| A | 0 | 8 | 111551 | 674.34 | 670 | 653 | 164.5 |
| A | 4 | 249 | 76202 | 459.39 | 670 | 653 | 164.5 |
| B | 4 | 81 | 131472 | 917.97 | 664 | 641 | 142.5 |
| B | 15 | 20 | 43978 | 304.07 | 664 | 641 | 142.5 |
| B | 5 | 236 | 33023 | 227.21 | 664 | 641 | 142.5 |
| C | 13 | 3 | 236022 | 1322.66 | 649 | 644 | 178.0 |
| C | 14 | 254 | 117086 | 654.32 | 649 | 644 | 178.0 |
| C | 3 | 242 | 107540 | 600.68 | 649 | 644 | 178.0 |
| D | 8 | 176 | 3890049 | 23187.57 | 585 | 558 | 167.7 |
| D | 2 | 165 | 170077 | 1010.6 | 585 | 558 | 167.7 |
| D | 12 | 2 | 115921 | 687.75 | 585 | 558 | 167.7 |
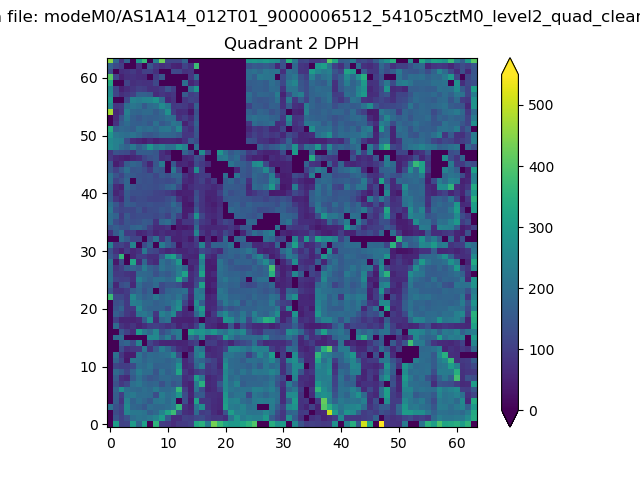
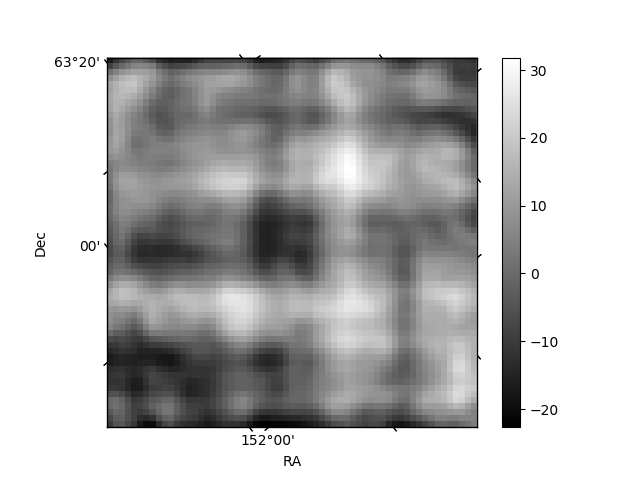
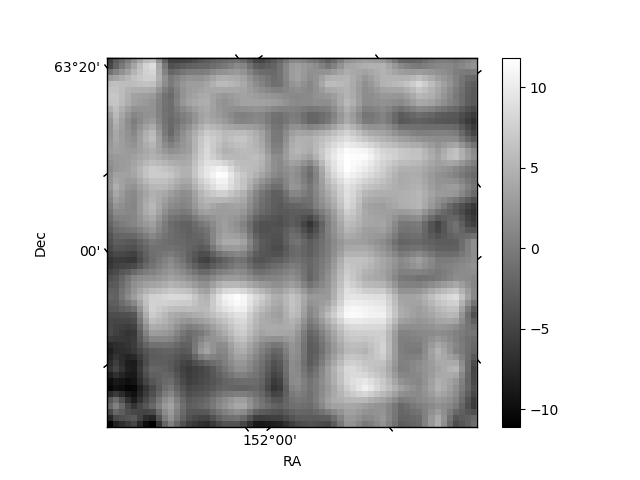
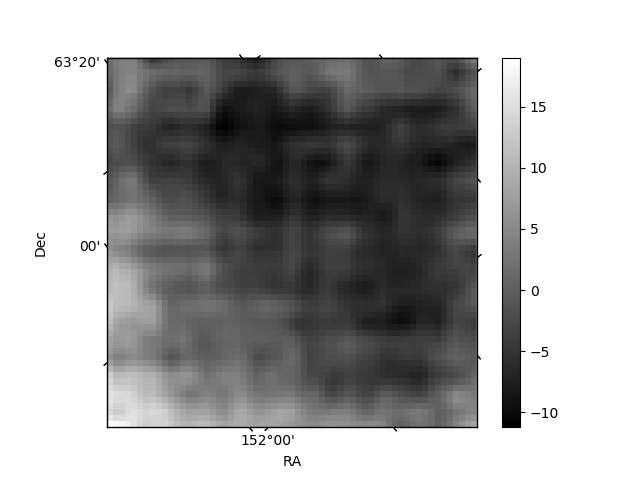
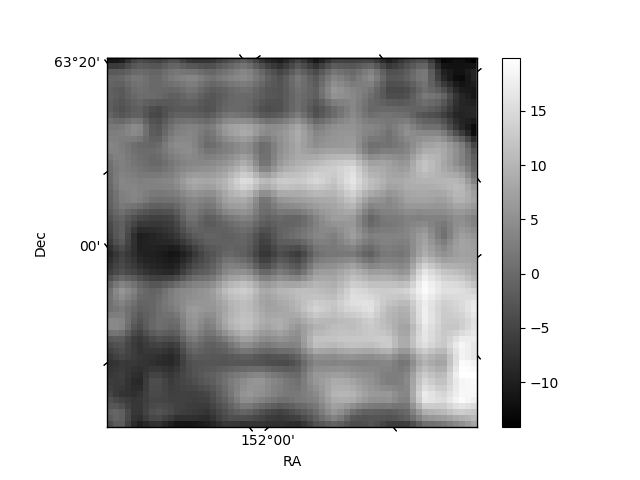
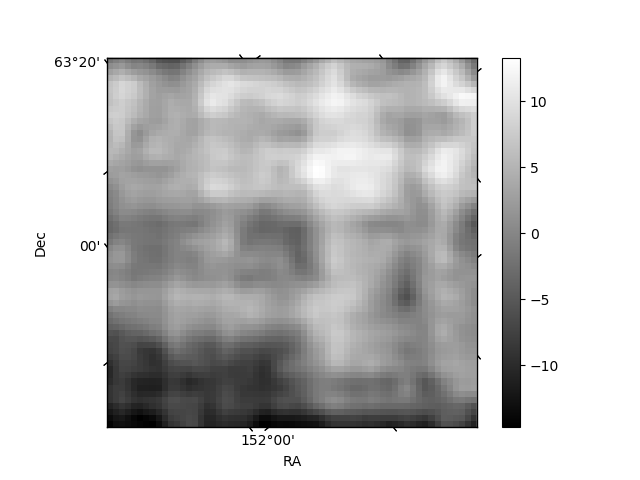
Histogram calculated using DETX and DETY for each event in the final _common_clean file
| Quadrant A | 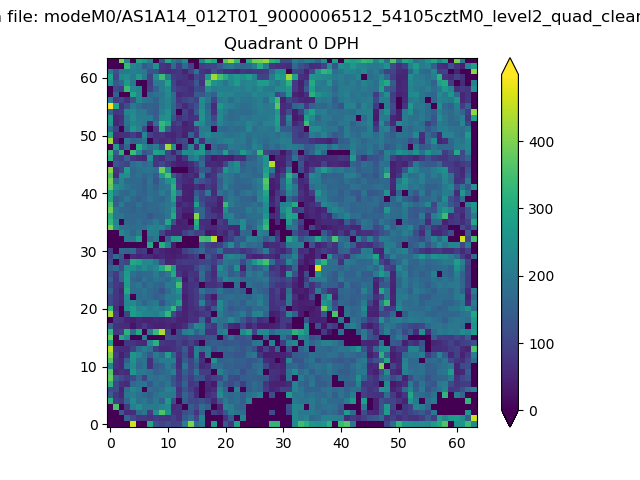 |
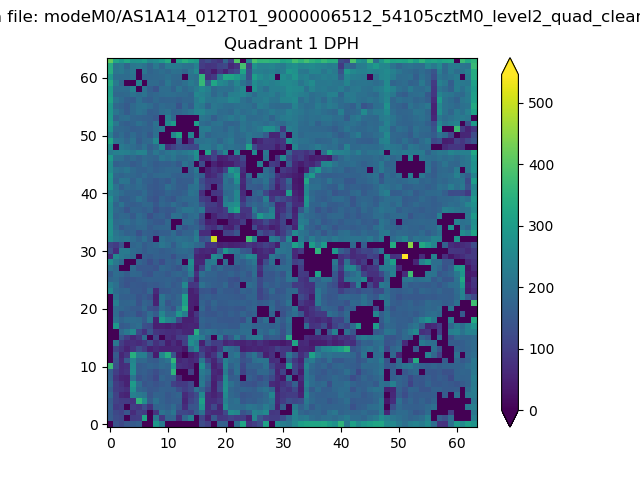 |
Quadrant B |
|---|---|---|---|
| Quadrant D | 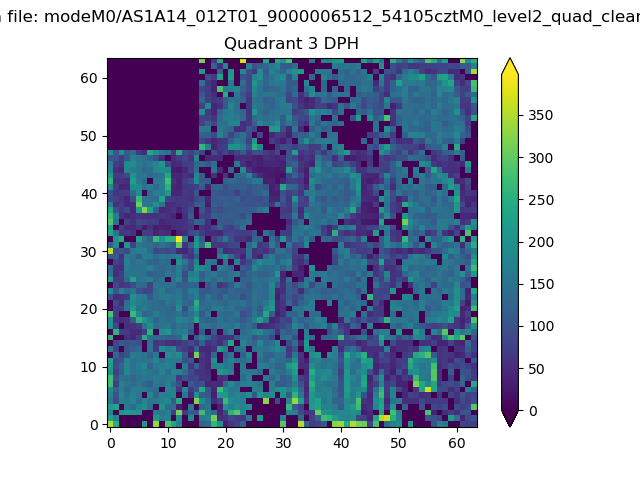 |
 |
Quadrant C |
| Plot type | Count rate plots | Images |
|---|---|---|
| Comparison with Poisson distribution Blue bars denote a histogram of data divided into 1 sec bins. Red curve is a Poisson curve with rate = median count rate of data. |
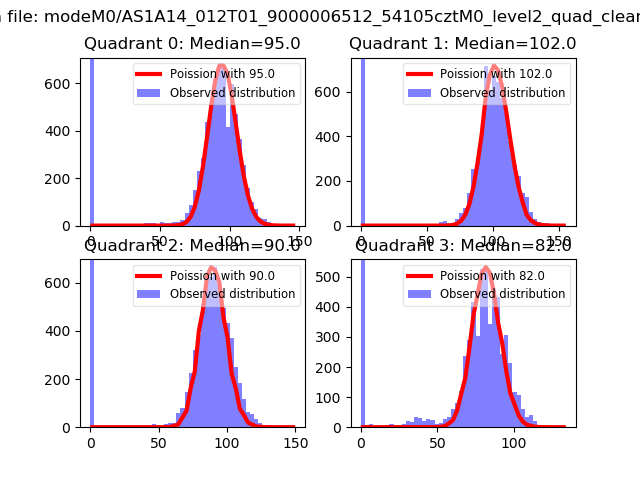 |
 |
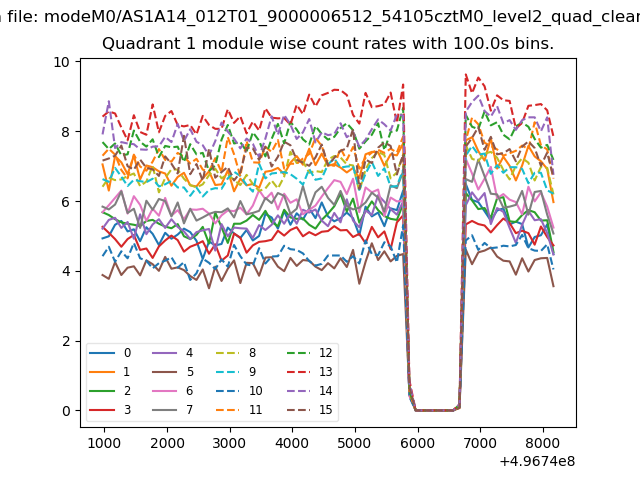
| Quadrant-wise count rates Data is divided into 100 sec bins |
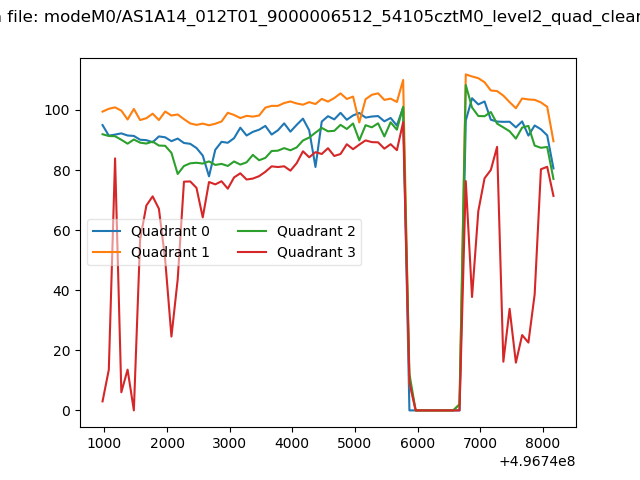 |
|
| Module-wise count rates for Quadrant A Data is divided into 100 sec bins |
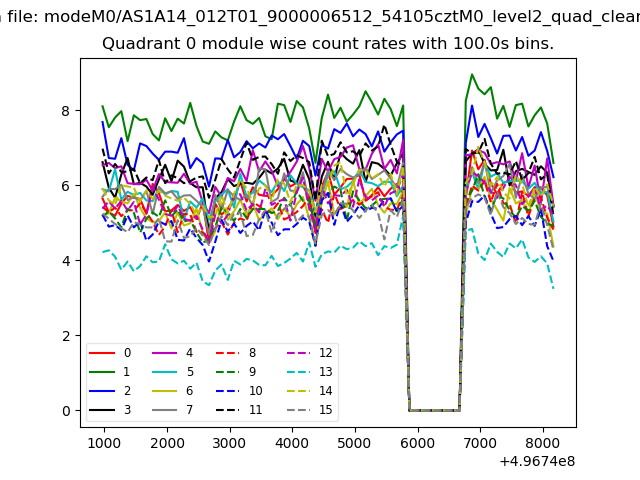 |
 |
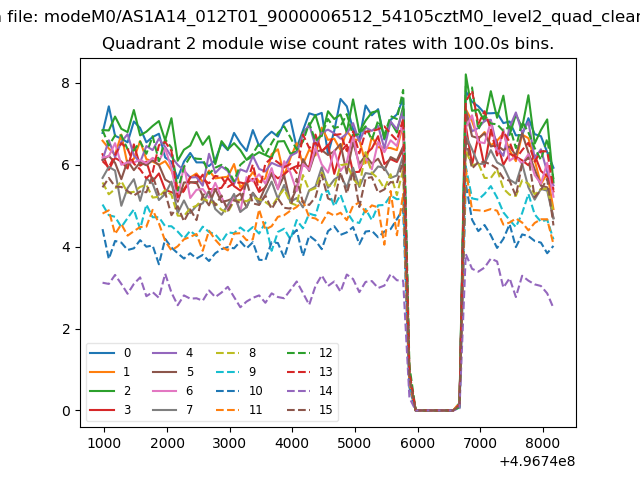
| Module-wise count rates for Quadrant B Data is divided into 100 sec bins |
 |
 |
| Module-wise count rates for Quadrant C Data is divided into 100 sec bins |
 |
 |
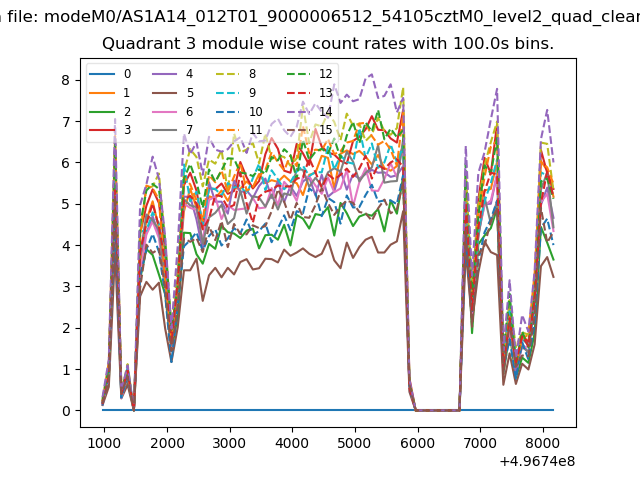
| Module-wise count rates for Quadrant D Data is divided into 100 sec bins |
 |
 |
| Parameter | Plot |
|---|---|
| CZT HV Monitor | 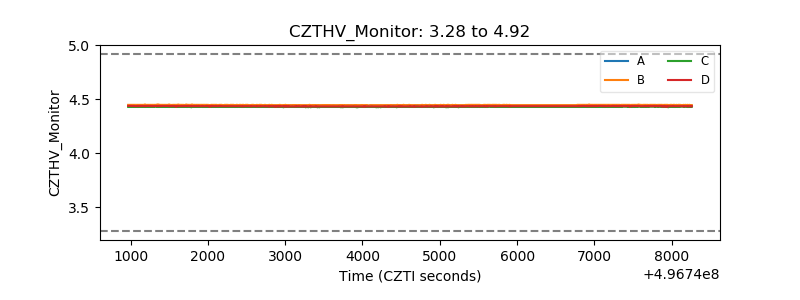 |
| D_VDD | 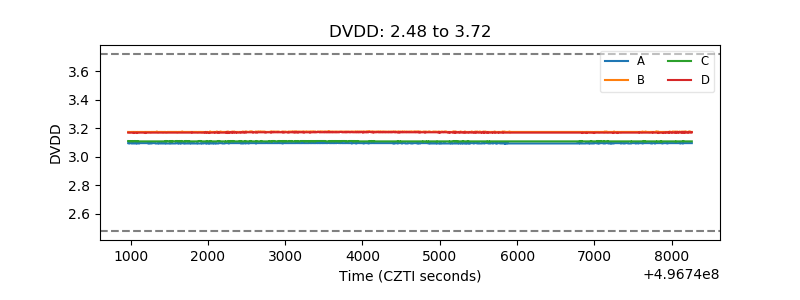 |
| Temperature 1 | 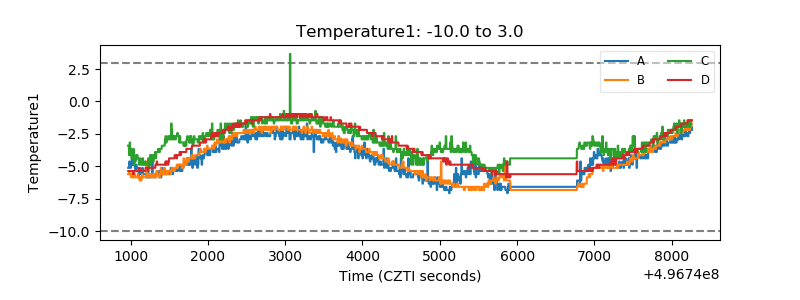 |
| Veto HV Monitor | 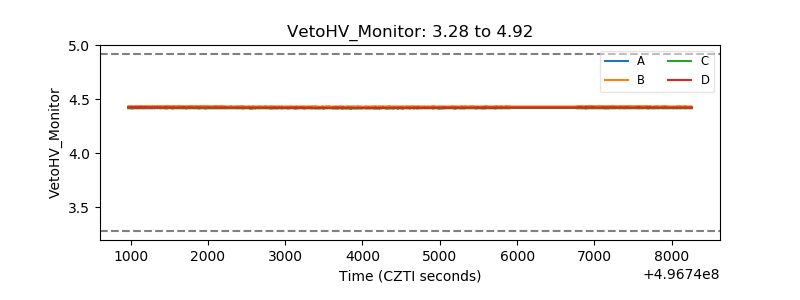 |
| Veto LLD | 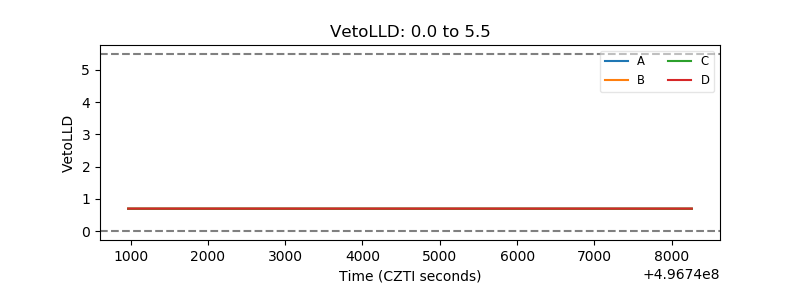 |
| Alpha Counter | 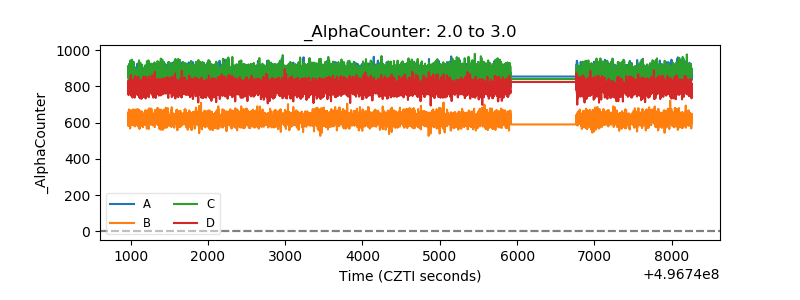 |
| _CPM_Rate | 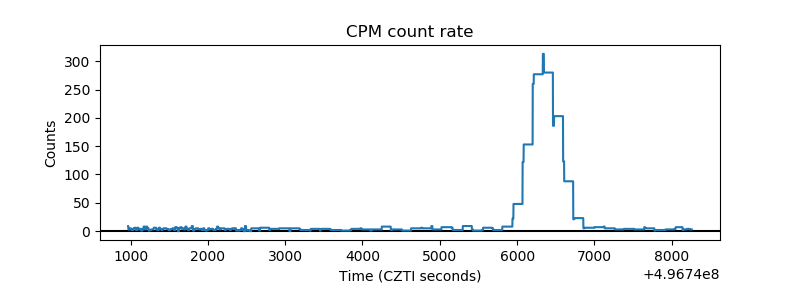 |
| CZT Counter | 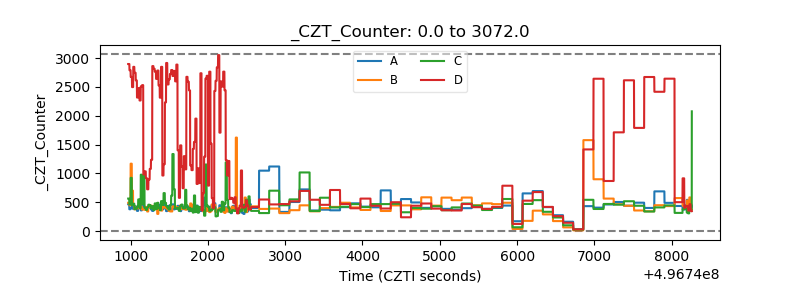 |
| +2.5 Volts monitor | 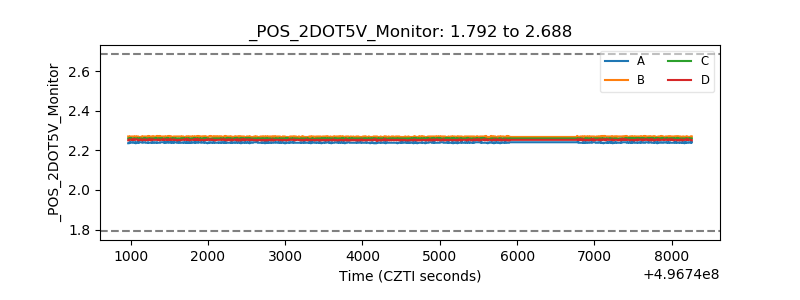 |
| +5 Volts monitor | 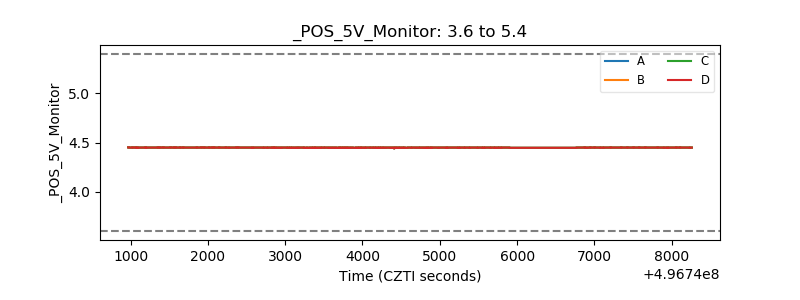 |
| _ROLL_ROT | 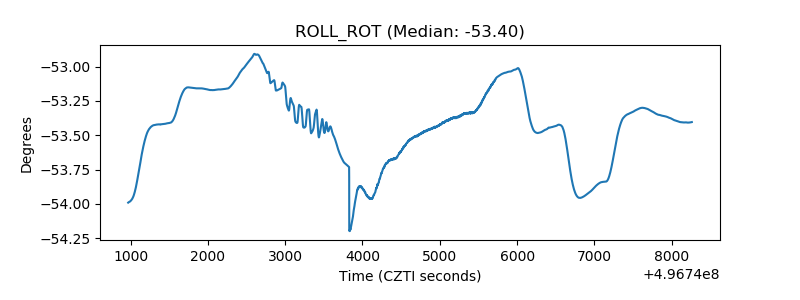 |
| _Roll_DEC | 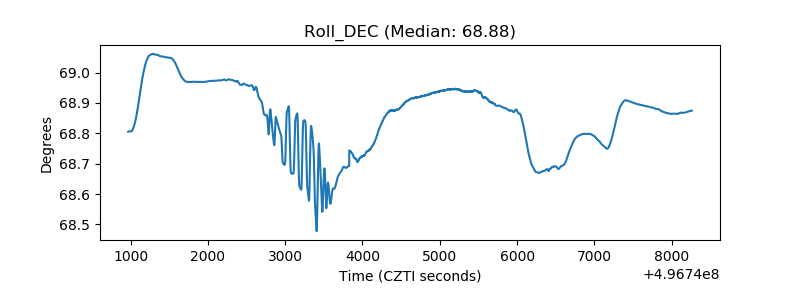 |
| _Roll_RA | 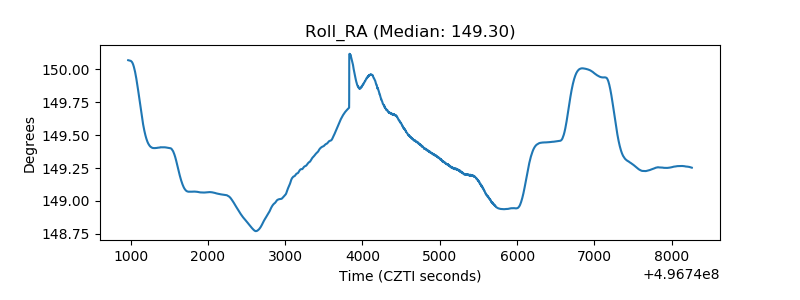 |
| Veto Counter | 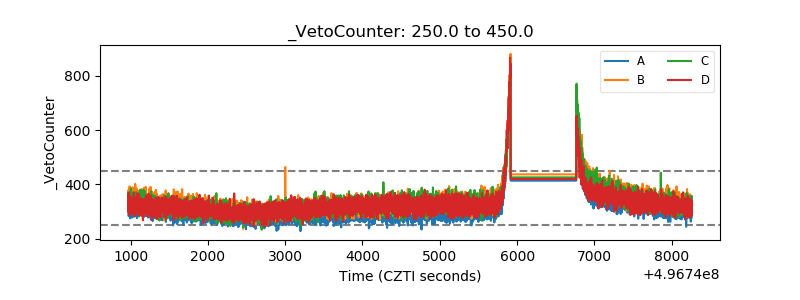 |