| Param | Original file | Final file |
|---|---|---|
| Filename | modeM0/AS1A14_012T01_9000006512_54107cztM0_level2.fits | modeM0/AS1A14_012T01_9000006512_54107cztM0_level2_quad_clean.evt |
| Size (bytes) | 408,764,160 | 91,189,440 |
| Size | 389.8 MB | 87.0 MB |
| Events in quadrant A | 3,039,165 | 604,425 |
| Events in quadrant B | 3,336,564 | 652,071 |
| Events in quadrant C | 3,248,078 | 574,203 |
| Events in quadrant D | 5,010,808 | 486,037 |
| Mode SS | |||
|---|---|---|---|
| Quadrant | BADHDUFLAG | Total packets | Discarded packets |
| A | 0 | 128 | 0 |
| B | 0 | 128 | 0 |
| C | 0 | 128 | 0 |
| D | 0 | 128 | 0 |
| Mode M0 | |||
|---|---|---|---|
| Quadrant | BADHDUFLAG | Total packets | Discarded packets |
| A | 0 | 13820 | 6 |
| B | 0 | 14277 | 3 |
| C | 0 | 14577 | 4 |
| D | 0 | 19411 | 2 |
| Mode M9 | |||
|---|---|---|---|
| Quadrant | BADHDUFLAG | Total packets | Discarded packets |
| A | 0 | 10 | 0 |
| B | 0 | 10 | 0 |
| C | 0 | 10 | 0 |
| D | 0 | 10 | 0 |
| Quadrant | Total seconds | Saturated seconds | Saturation percentage |
|---|---|---|---|
| A | 6372 | 127 | 1.993095% |
| B | 6374 | 143 | 2.243489% |
| C | 6374 | 173 | 2.714151% |
| D | 6375 | 679 | 10.650980% |
Noise dominated data is calculated using 1-second bins in cleaned event files. If a bin has >2000 counts, and if more than 50% of those come from <1% of pixels, then it is considered to be noise-dominated and hence unusable.
| Quadrant | # 1 sec bins | Bins with >0 counts | Bins with >2000 counts | High rate bins dominated by noise | Noise dominated (total time) | Noise dominated (detector-on time) | Marked lightcurve |
|---|---|---|---|---|---|---|---|
| A | 7360 | 6375 | 48 | 48 | 0.65% | 0.75% | 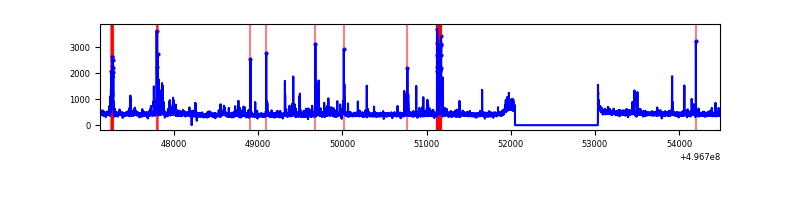 |
| B | 7361 | 6377 | 47 | 47 | 0.64% | 0.74% |  |
| C | 7361 | 6376 | 117 | 117 | 1.59% | 1.84% | 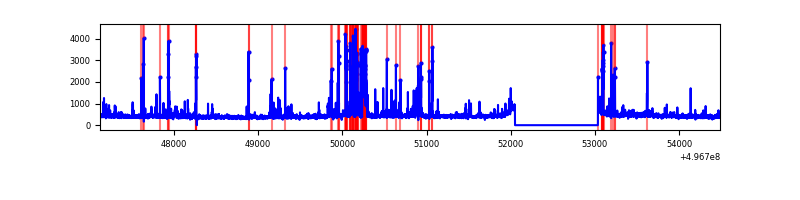 |
| D | 7361 | 6377 | 579 | 579 | 7.87% | 9.08% | 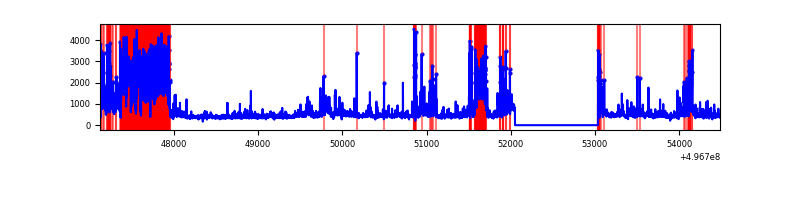 |
Top three noisy pixels from each quadrant. If the there are fewer than three noisy pixels in the level2.evt file, extra rows are filled as -1
| Pixel properties | Quadrant properties | ||||||
|---|---|---|---|---|---|---|---|
| Quadrant | DetID | PixID | Counts | Sigma | Mean | Median | Sigma |
| A | 0 | 8 | 153363 | 920.66 | 669 | 651 | 165.9 |
| A | 13 | 248 | 63531 | 379.09 | 669 | 651 | 165.9 |
| A | 3 | 78 | 59468 | 354.59 | 669 | 651 | 165.9 |
| B | 4 | 81 | 162412 | 1150.86 | 659 | 638 | 140.6 |
| B | 5 | 185 | 114186 | 807.78 | 659 | 638 | 140.6 |
| B | 15 | 20 | 106649 | 754.16 | 659 | 638 | 140.6 |
| C | 1 | 241 | 283272 | 1603.77 | 643 | 635 | 176.2 |
| C | 13 | 3 | 238372 | 1348.99 | 643 | 635 | 176.2 |
| C | 9 | 38 | 41694 | 232.98 | 643 | 635 | 176.2 |
| D | 8 | 176 | 1965130 | 11255.37 | 621 | 593 | 174.5 |
| D | 2 | 165 | 234395 | 1339.52 | 621 | 593 | 174.5 |
| D | 15 | 78 | 107432 | 612.11 | 621 | 593 | 174.5 |
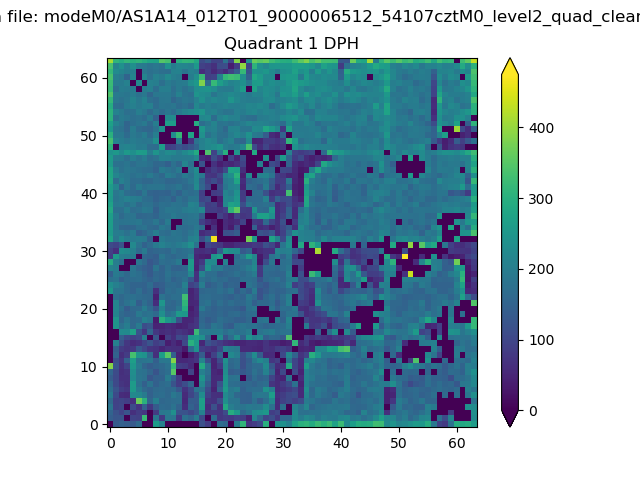
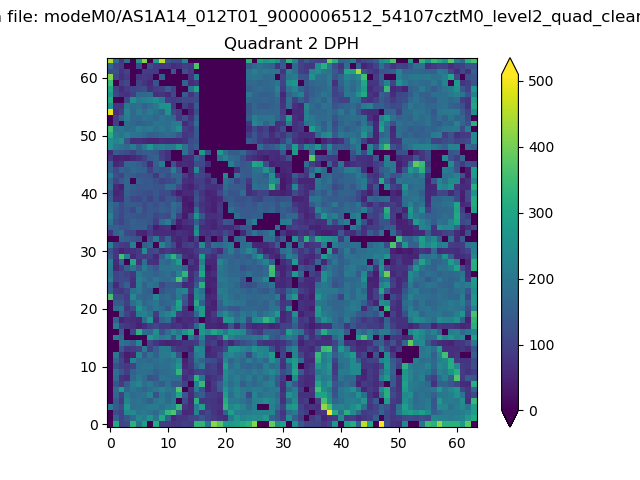
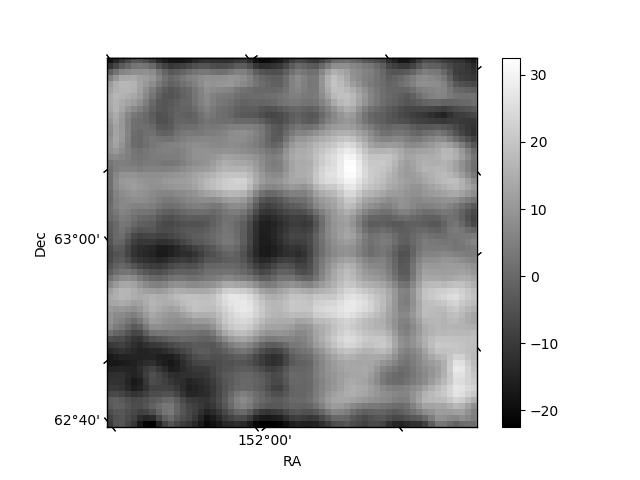
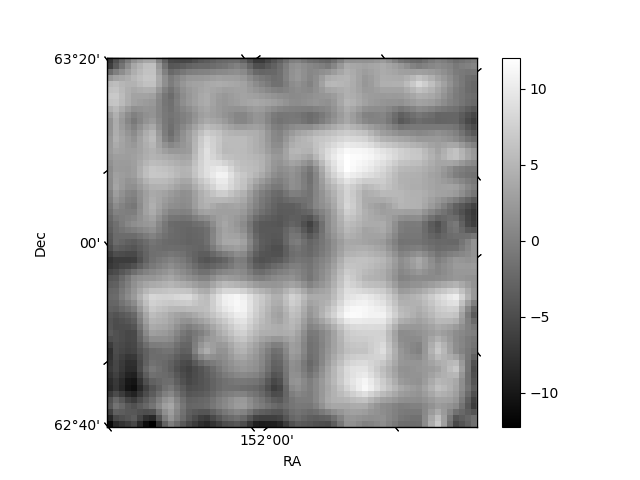
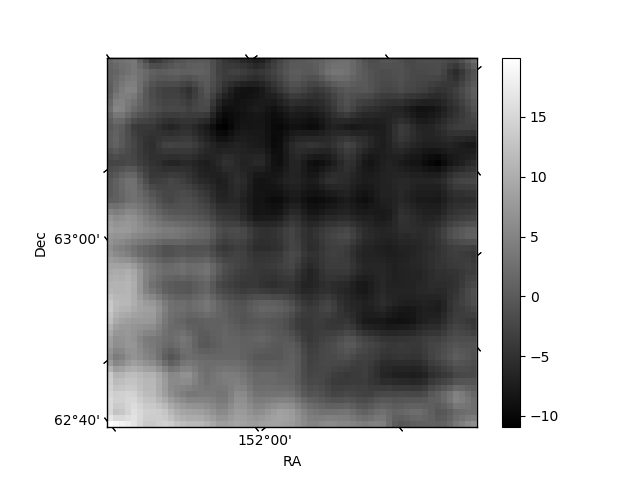
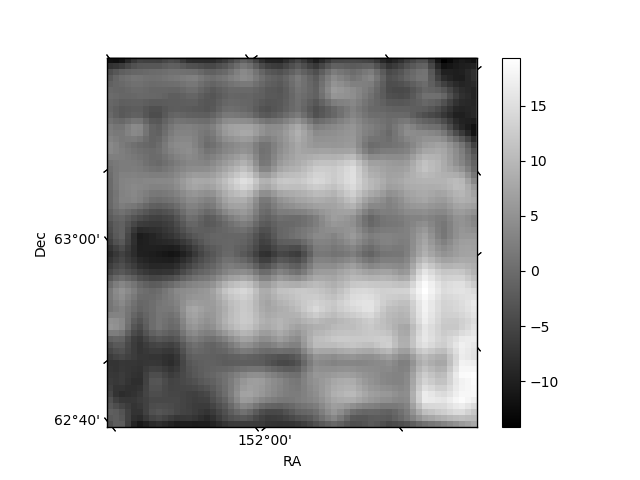
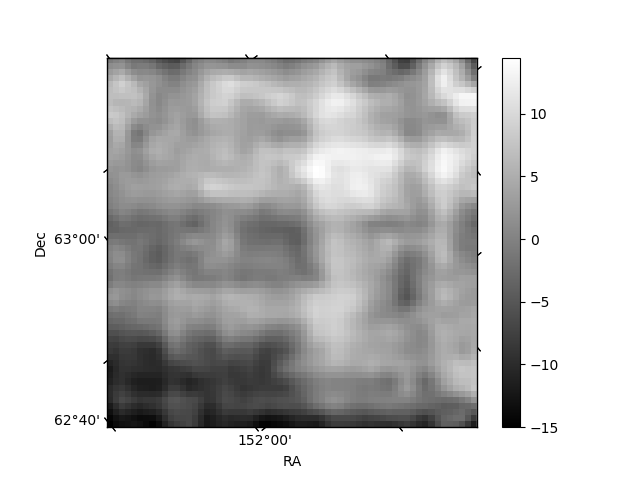
Histogram calculated using DETX and DETY for each event in the final _common_clean file
| Quadrant A | 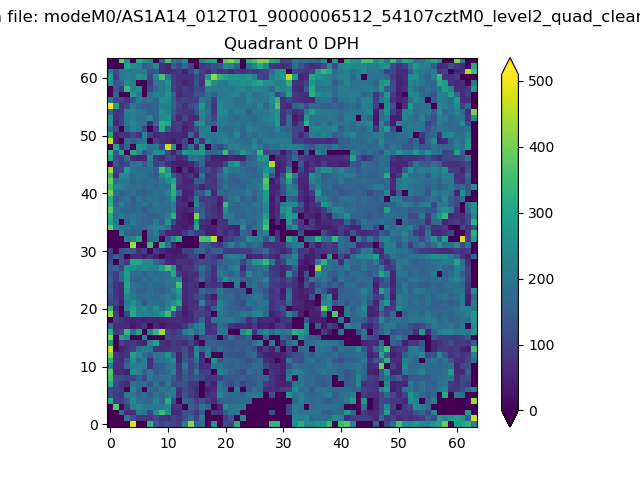 |
 |
Quadrant B |
|---|---|---|---|
| Quadrant D | 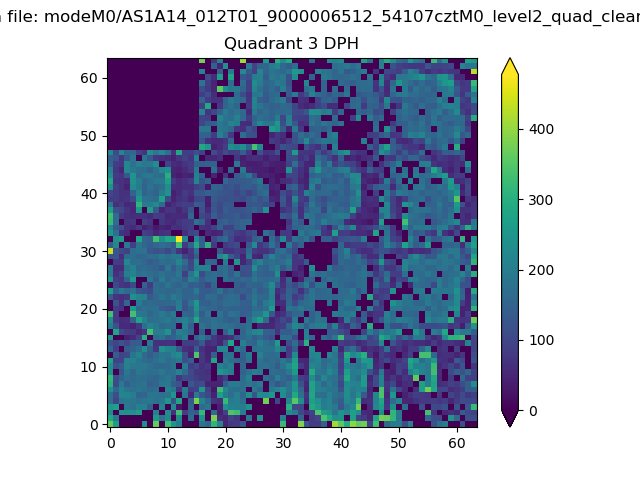 |
 |
Quadrant C |
| Plot type | Count rate plots | Images |
|---|---|---|
| Comparison with Poisson distribution Blue bars denote a histogram of data divided into 1 sec bins. Red curve is a Poisson curve with rate = median count rate of data. |
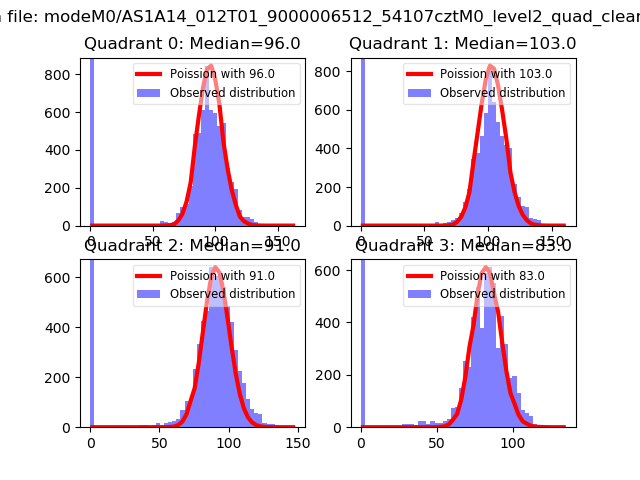 |
 |
| Quadrant-wise count rates Data is divided into 100 sec bins |
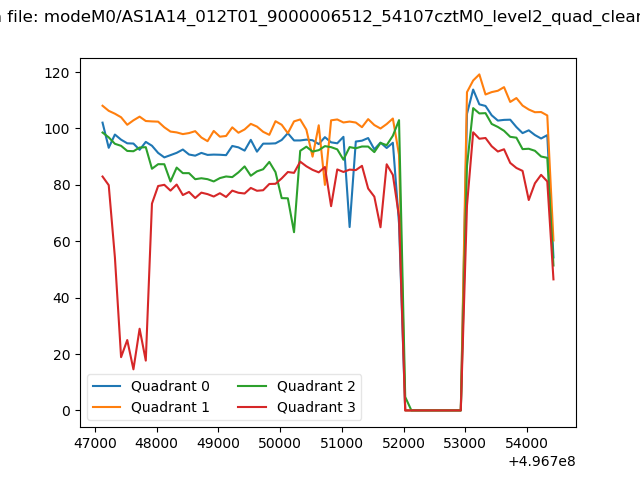 |
|
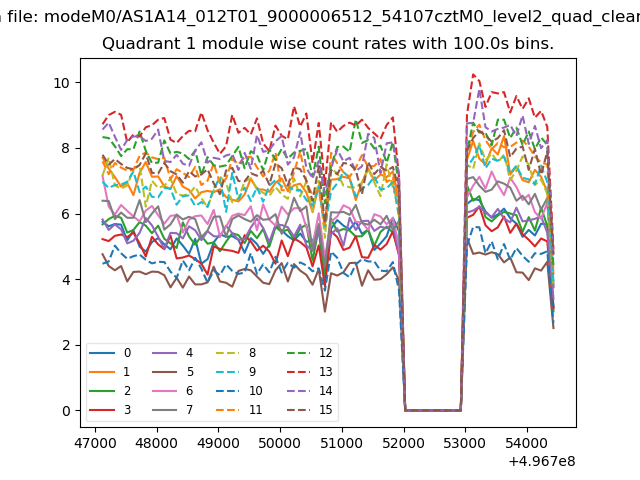
| Module-wise count rates for Quadrant A Data is divided into 100 sec bins |
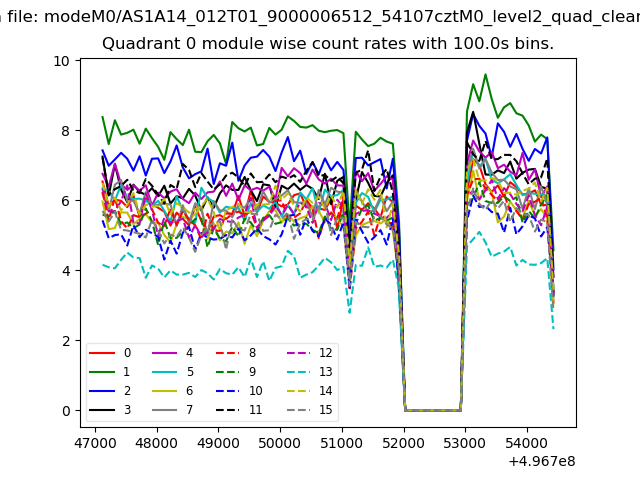 |
 |
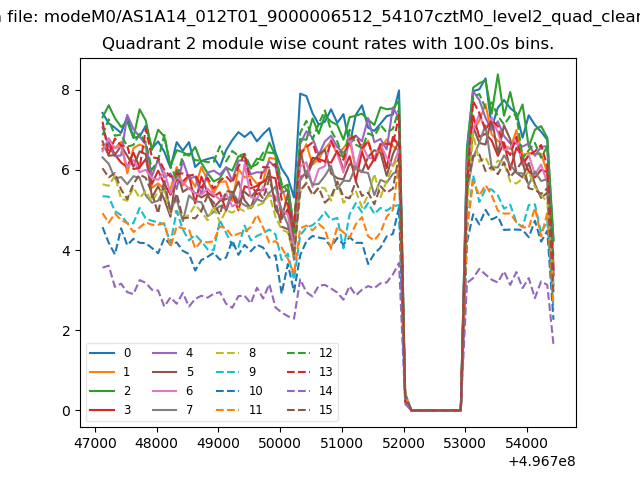
| Module-wise count rates for Quadrant B Data is divided into 100 sec bins |
 |
 |
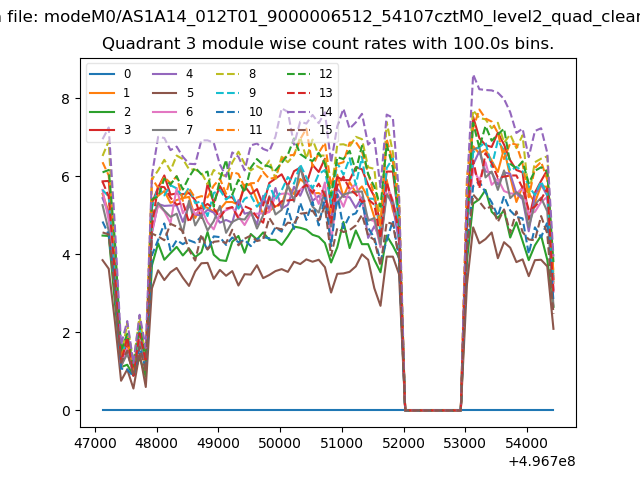
| Module-wise count rates for Quadrant C Data is divided into 100 sec bins |
 |
 |
| Module-wise count rates for Quadrant D Data is divided into 100 sec bins |
 |
 |
| Parameter | Plot |
|---|---|
| CZT HV Monitor | 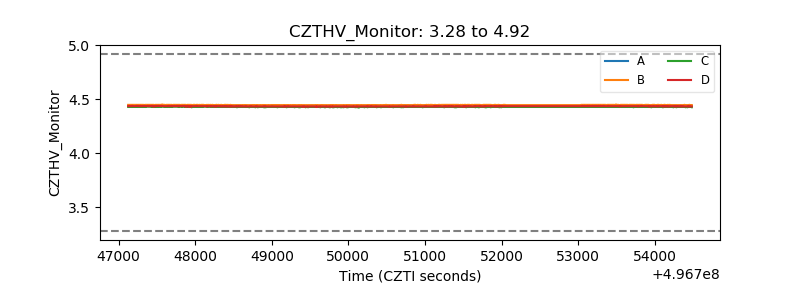 |
| D_VDD | 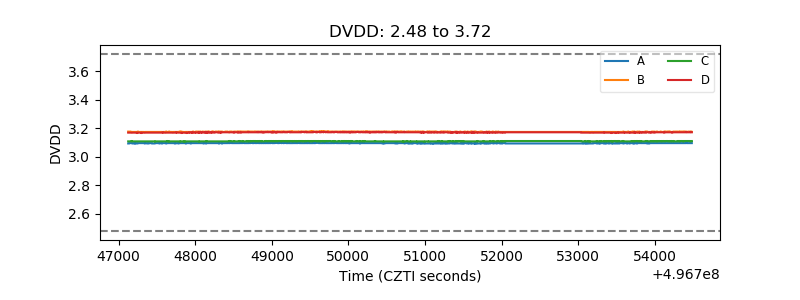 |
| Temperature 1 | 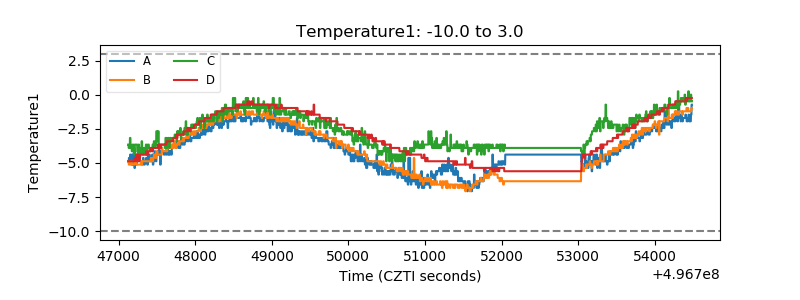 |
| Veto HV Monitor | 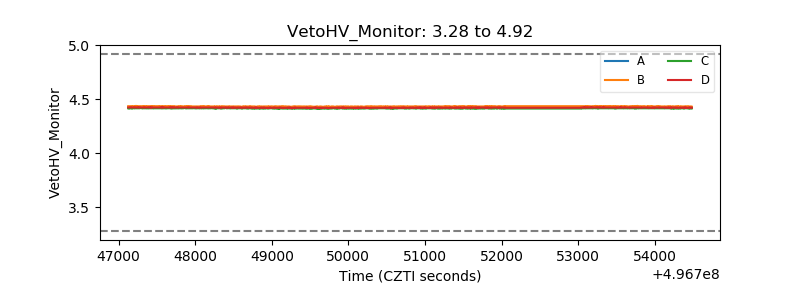 |
| Veto LLD | 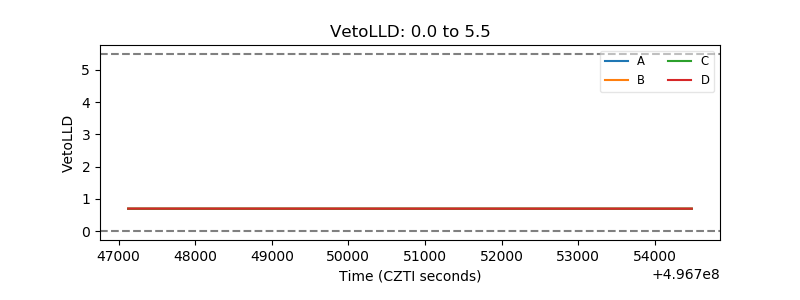 |
| Alpha Counter | 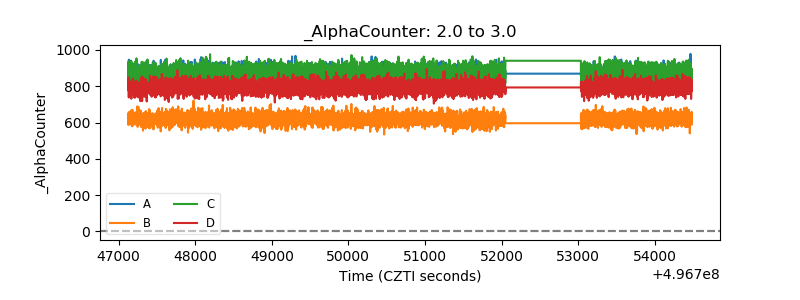 |
| _CPM_Rate | 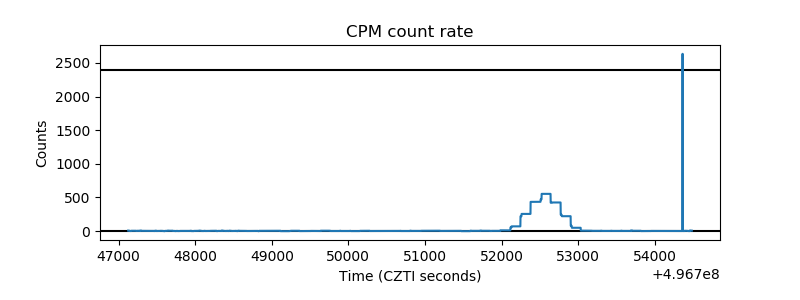 |
| CZT Counter | 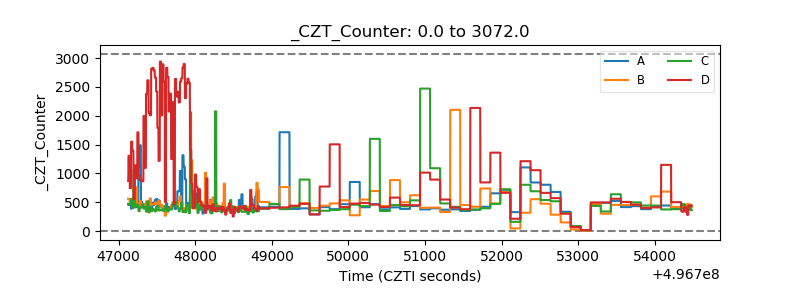 |
| +2.5 Volts monitor |  |
| +5 Volts monitor |  |
| _ROLL_ROT | 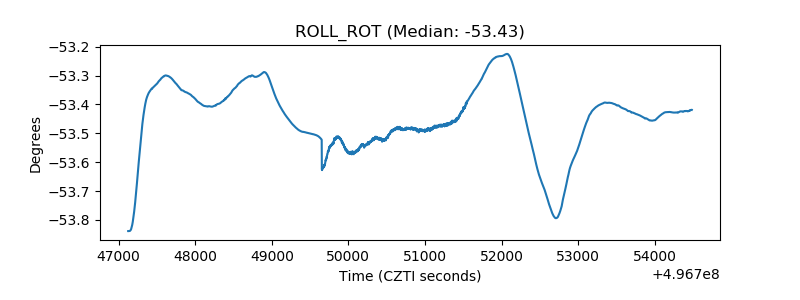 |
| _Roll_DEC | 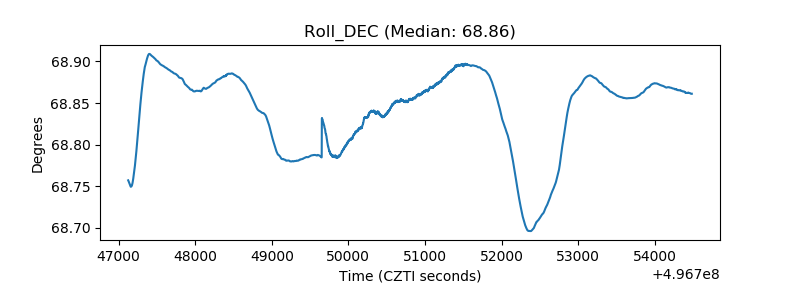 |
| _Roll_RA | 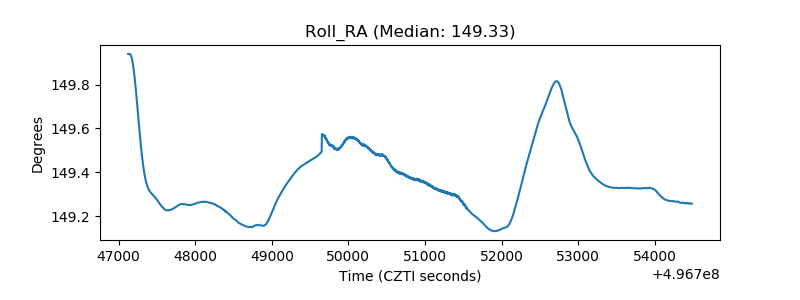 |
| Veto Counter | 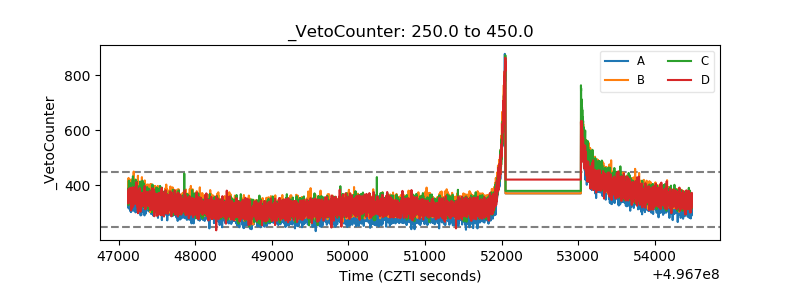 |