| Param | Original file | Final file |
|---|---|---|
| Filename | modeM0/AS1A14_012T01_9000006512_54109cztM0_level2.fits | modeM0/AS1A14_012T01_9000006512_54109cztM0_level2_quad_clean.evt |
| Size (bytes) | 473,414,400 | 89,677,440 |
| Size | 451.5 MB | 85.5 MB |
| Events in quadrant A | 2,997,648 | 611,259 |
| Events in quadrant B | 4,763,417 | 633,260 |
| Events in quadrant C | 4,973,587 | 523,785 |
| Events in quadrant D | 4,310,238 | 516,930 |
| Mode SS | |||
|---|---|---|---|
| Quadrant | BADHDUFLAG | Total packets | Discarded packets |
| A | 0 | 124 | 0 |
| B | 0 | 124 | 0 |
| C | 0 | 124 | 0 |
| D | 0 | 124 | 0 |
| Mode M0 | |||
|---|---|---|---|
| Quadrant | BADHDUFLAG | Total packets | Discarded packets |
| A | 0 | 13402 | 1 |
| B | 0 | 18334 | 1 |
| C | 0 | 19226 | 1 |
| D | 0 | 17085 | 1 |
| Mode M9 | |||
|---|---|---|---|
| Quadrant | BADHDUFLAG | Total packets | Discarded packets |
| A | 0 | 12 | 0 |
| B | 0 | 12 | 0 |
| C | 0 | 12 | 0 |
| D | 0 | 12 | 0 |
| Quadrant | Total seconds | Saturated seconds | Saturation percentage |
|---|---|---|---|
| A | 6164 | 138 | 2.238806% |
| B | 6165 | 464 | 7.526358% |
| C | 6165 | 791 | 12.830495% |
| D | 6165 | 420 | 6.812652% |
Noise dominated data is calculated using 1-second bins in cleaned event files. If a bin has >2000 counts, and if more than 50% of those come from <1% of pixels, then it is considered to be noise-dominated and hence unusable.
| Quadrant | # 1 sec bins | Bins with >0 counts | Bins with >2000 counts | High rate bins dominated by noise | Noise dominated (total time) | Noise dominated (detector-on time) | Marked lightcurve |
|---|---|---|---|---|---|---|---|
| A | 7294 | 6165 | 48 | 48 | 0.66% | 0.78% | 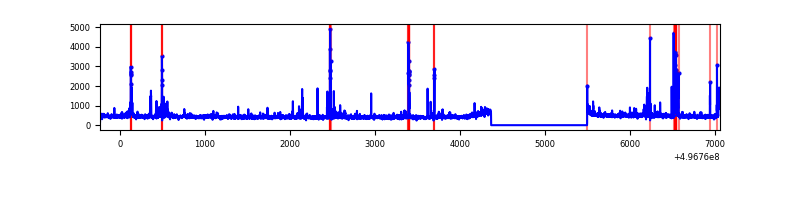 |
| B | 7295 | 6166 | 289 | 289 | 3.96% | 4.69% | 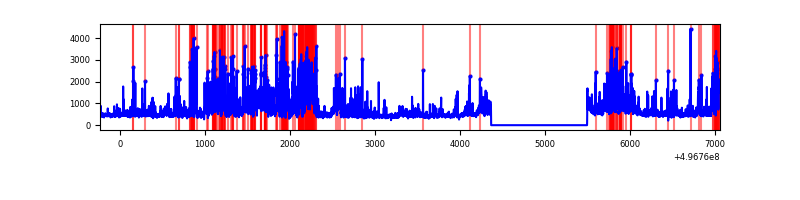 |
| C | 7295 | 6166 | 672 | 672 | 9.21% | 10.90% | 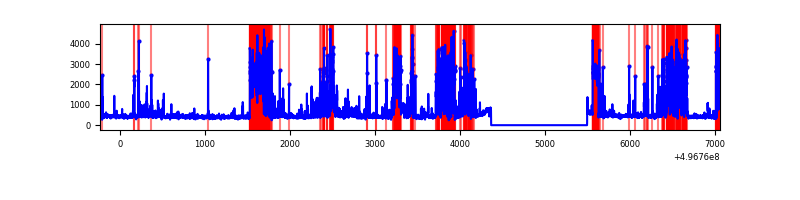 |
| D | 7295 | 6166 | 298 | 298 | 4.08% | 4.83% | 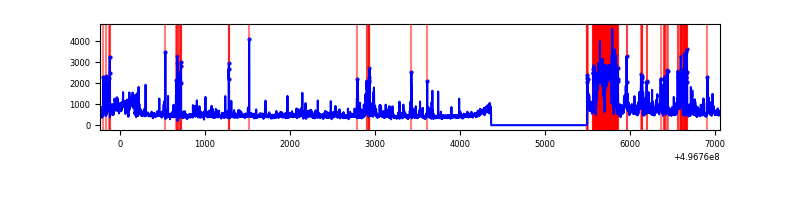 |
Top three noisy pixels from each quadrant. If the there are fewer than three noisy pixels in the level2.evt file, extra rows are filled as -1
| Pixel properties | Quadrant properties | ||||||
|---|---|---|---|---|---|---|---|
| Quadrant | DetID | PixID | Counts | Sigma | Mean | Median | Sigma |
| A | 15 | 174 | 150363 | 920.13 | 659 | 643 | 162.7 |
| A | 13 | 248 | 57530 | 349.61 | 659 | 643 | 162.7 |
| A | 0 | 8 | 48975 | 297.03 | 659 | 643 | 162.7 |
| B | 4 | 81 | 1220359 | 8943.93 | 642 | 621 | 136.4 |
| B | 0 | 213 | 312822 | 2289.27 | 642 | 621 | 136.4 |
| B | 10 | 245 | 230707 | 1687.14 | 642 | 621 | 136.4 |
| C | 1 | 241 | 1233334 | 7276.13 | 608 | 600 | 169.4 |
| C | 13 | 3 | 1048803 | 6186.94 | 608 | 600 | 169.4 |
| C | 9 | 53 | 88874 | 521.03 | 608 | 600 | 169.4 |
| D | 8 | 176 | 986705 | 5631.25 | 617 | 591 | 175.1 |
| D | 2 | 165 | 464607 | 2649.78 | 617 | 591 | 175.1 |
| D | 2 | 172 | 226647 | 1290.9 | 617 | 591 | 175.1 |
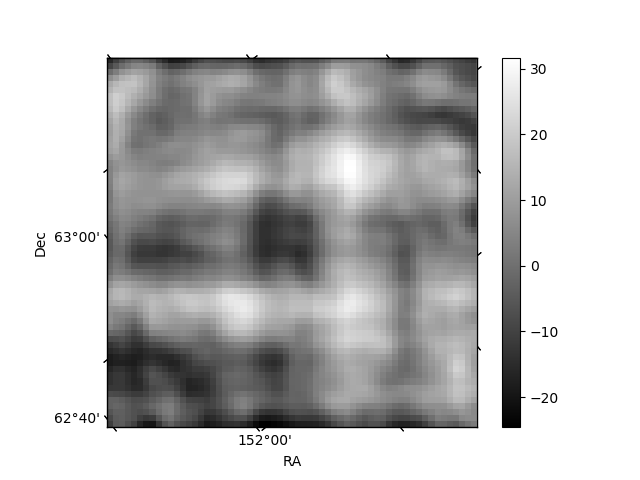
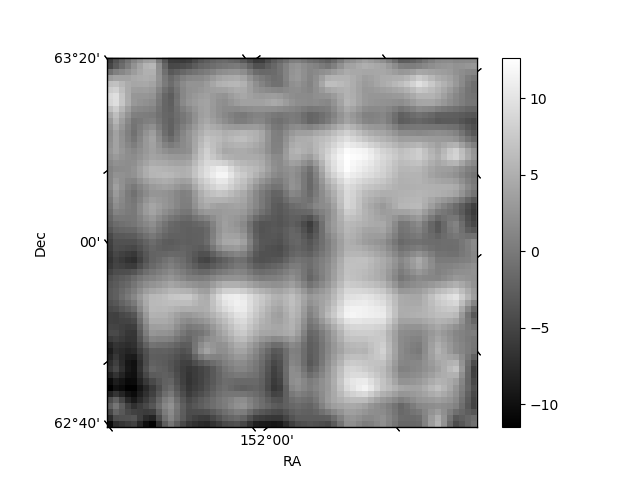
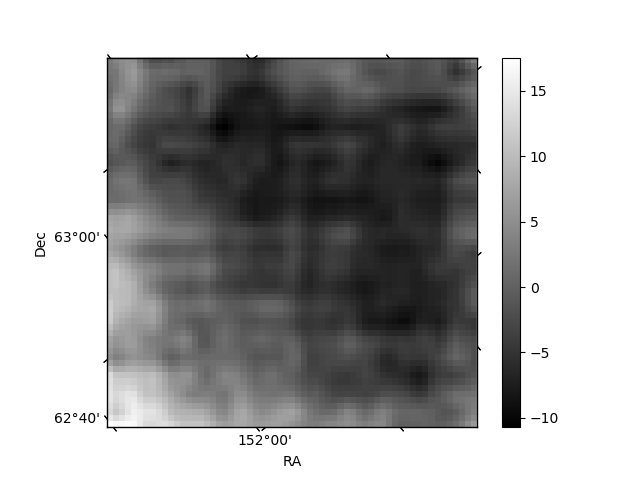
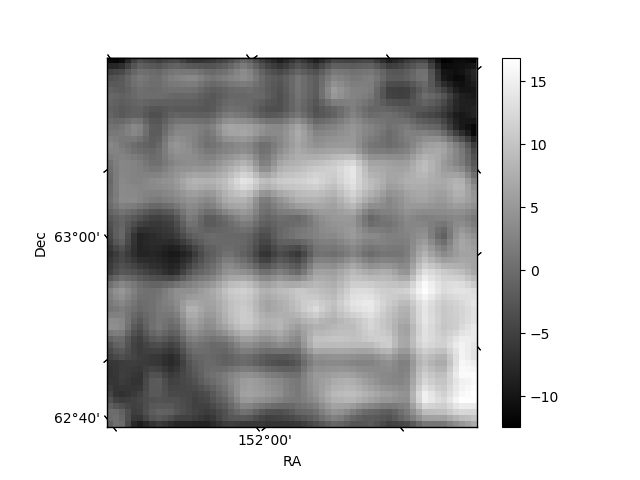
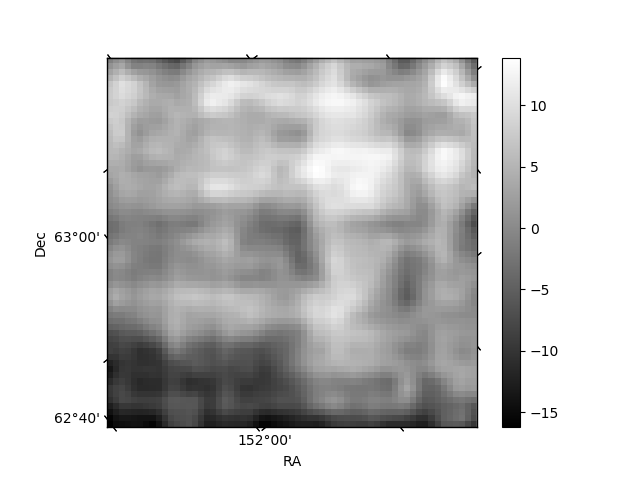
Histogram calculated using DETX and DETY for each event in the final _common_clean file
| Quadrant A | 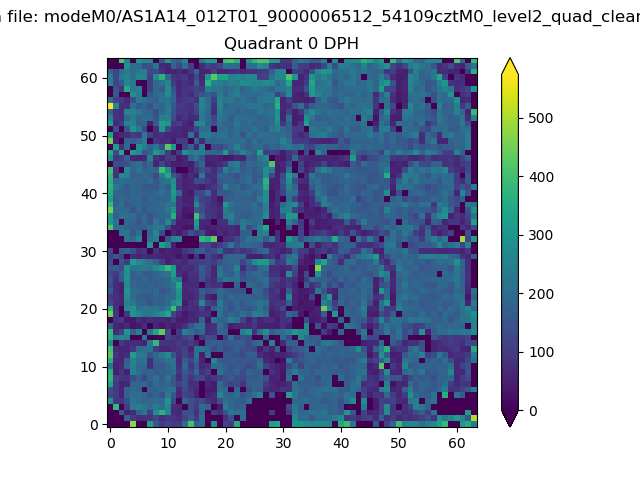 |
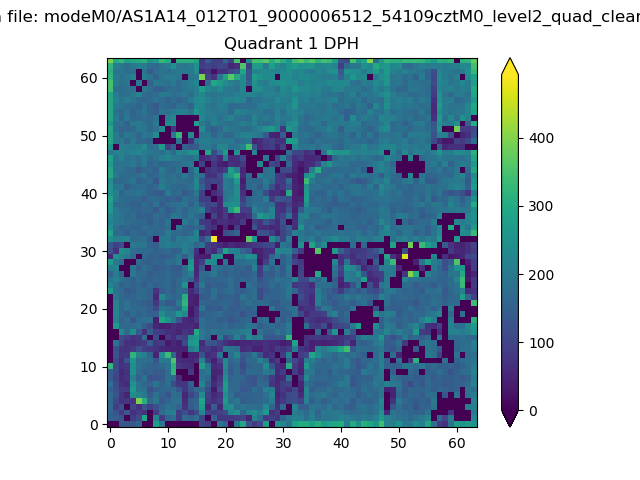 |
Quadrant B |
|---|---|---|---|
| Quadrant D | 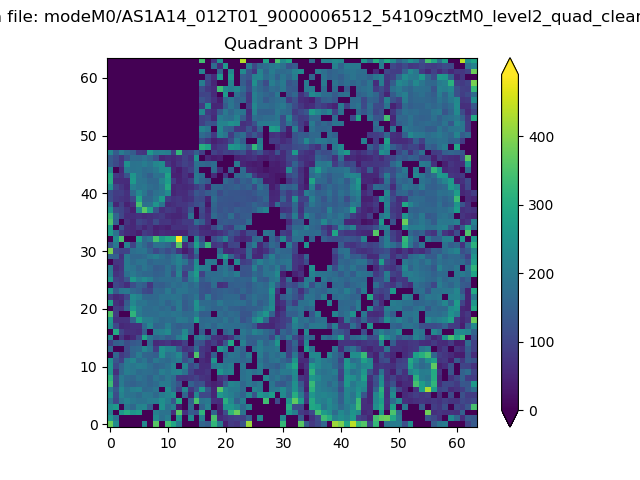 |
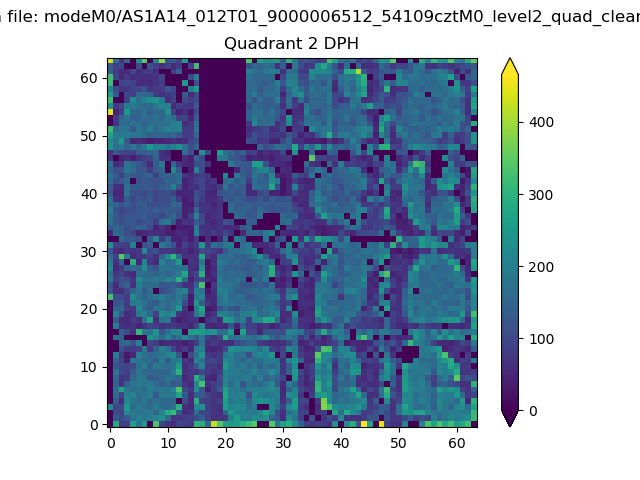 |
Quadrant C |
| Plot type | Count rate plots | Images |
|---|---|---|
| Comparison with Poisson distribution Blue bars denote a histogram of data divided into 1 sec bins. Red curve is a Poisson curve with rate = median count rate of data. |
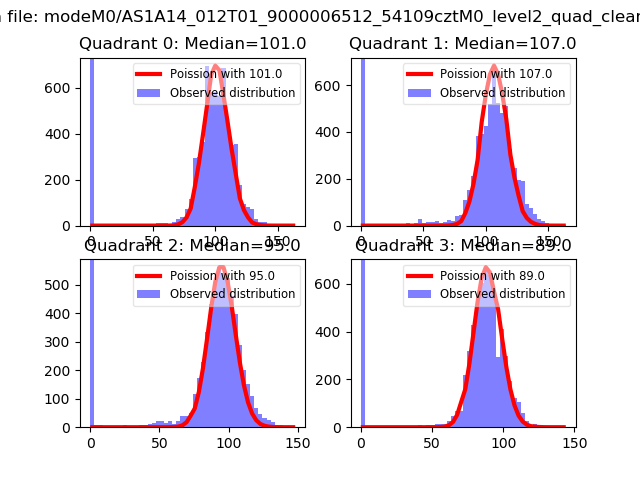 |
 |
| Quadrant-wise count rates Data is divided into 100 sec bins |
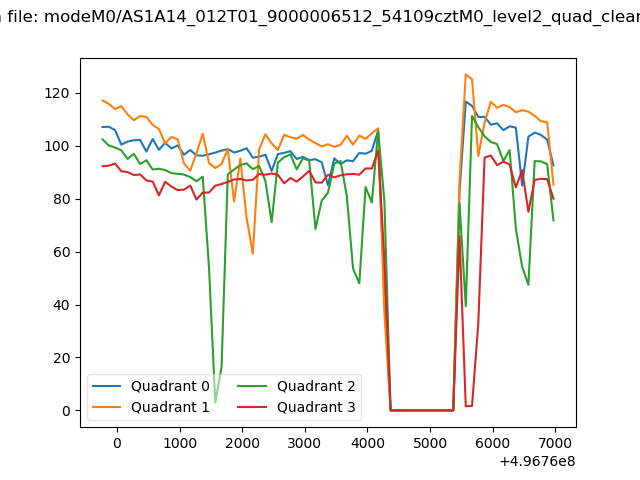 |
|
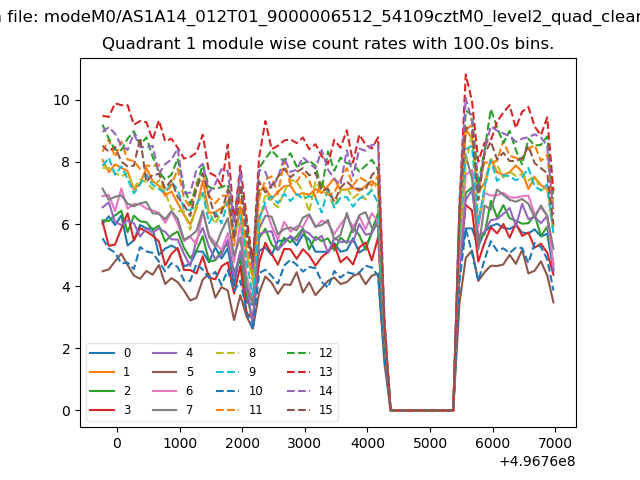
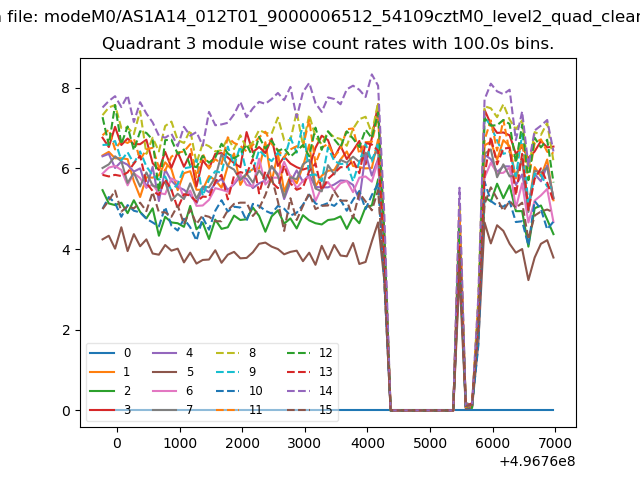
| Module-wise count rates for Quadrant A Data is divided into 100 sec bins |
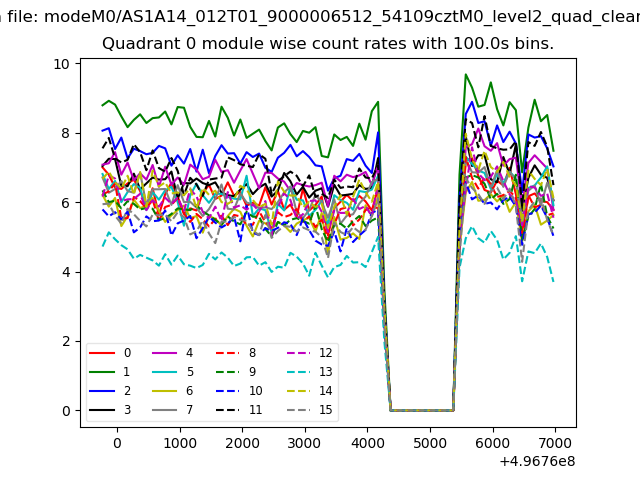 |
 |
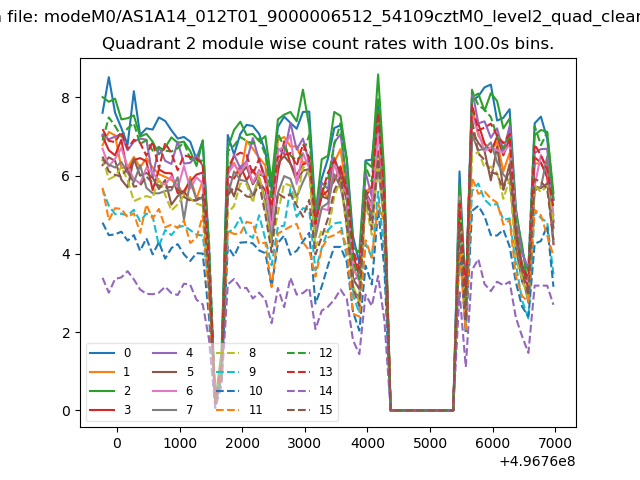
| Module-wise count rates for Quadrant B Data is divided into 100 sec bins |
 |
 |
| Module-wise count rates for Quadrant C Data is divided into 100 sec bins |
 |
 |
| Module-wise count rates for Quadrant D Data is divided into 100 sec bins |
 |
 |
| Parameter | Plot |
|---|---|
| CZT HV Monitor |  |
| D_VDD | 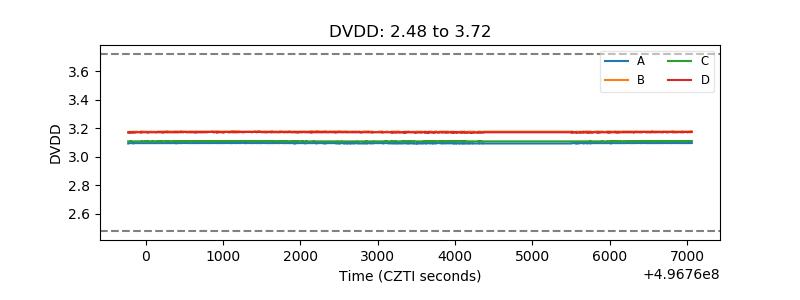 |
| Temperature 1 | 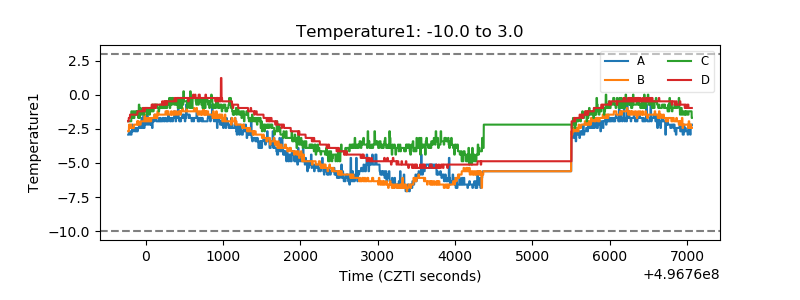 |
| Veto HV Monitor | 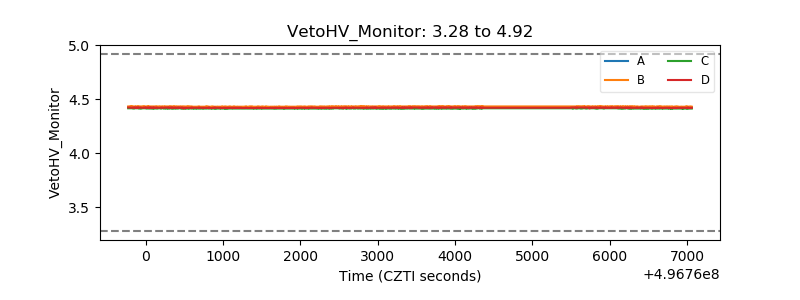 |
| Veto LLD | 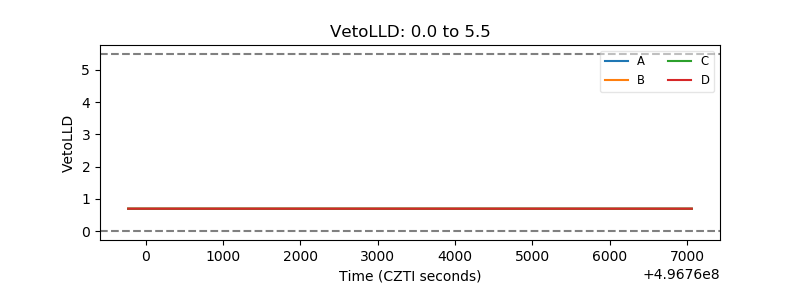 |
| Alpha Counter | 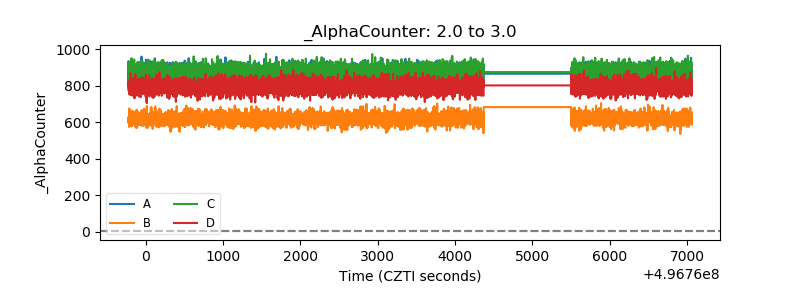 |
| _CPM_Rate | 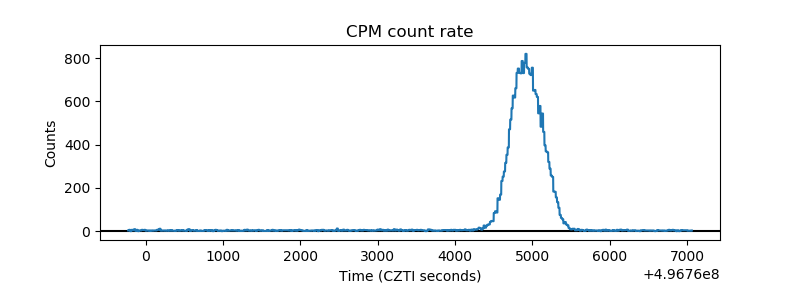 |
| CZT Counter | 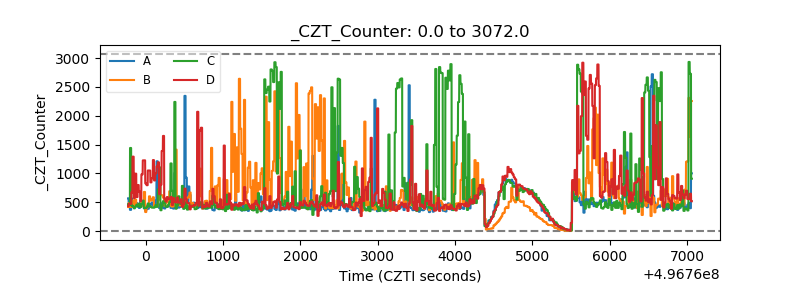 |
| +2.5 Volts monitor | 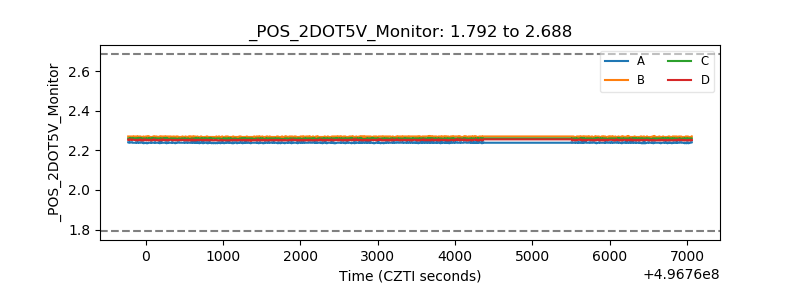 |
| +5 Volts monitor |  |
| _ROLL_ROT | 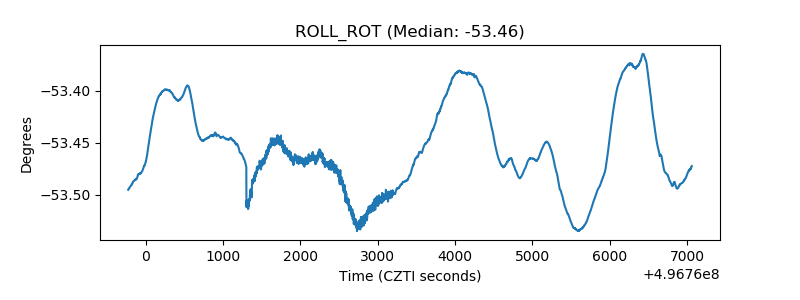 |
| _Roll_DEC | 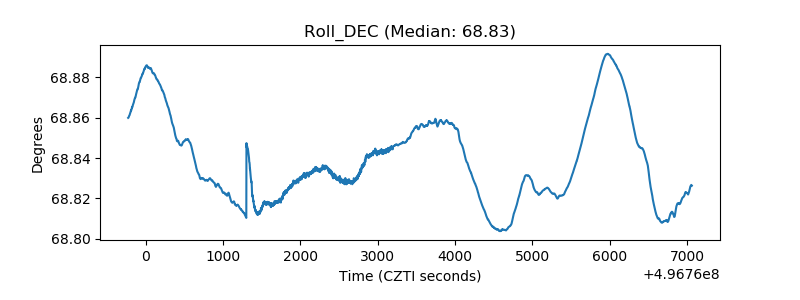 |
| _Roll_RA | 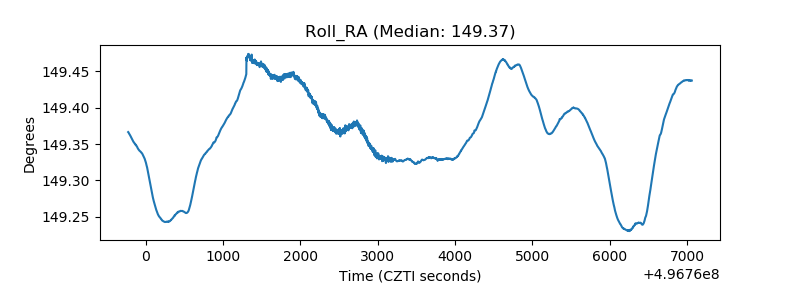 |
| Veto Counter | 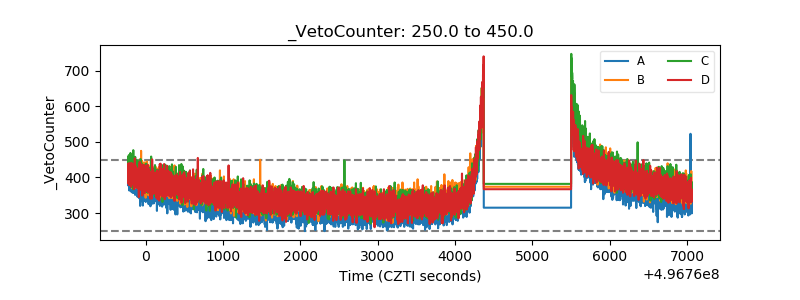 |