| Param | Original file | Final file |
|---|---|---|
| Filename | modeM0/AS1A14_012T01_9000006512_54110cztM0_level2.fits | modeM0/AS1A14_012T01_9000006512_54110cztM0_level2_quad_clean.evt |
| Size (bytes) | 424,517,760 | 92,154,240 |
| Size | 404.9 MB | 87.9 MB |
| Events in quadrant A | 3,238,055 | 604,413 |
| Events in quadrant B | 4,150,390 | 648,173 |
| Events in quadrant C | 3,743,027 | 563,694 |
| Events in quadrant D | 4,102,429 | 543,366 |
| Mode SS | |||
|---|---|---|---|
| Quadrant | BADHDUFLAG | Total packets | Discarded packets |
| A | 0 | 124 | 0 |
| B | 0 | 124 | 0 |
| C | 0 | 124 | 0 |
| D | 0 | 124 | 0 |
| Mode M0 | |||
|---|---|---|---|
| Quadrant | BADHDUFLAG | Total packets | Discarded packets |
| A | 0 | 14093 | 1 |
| B | 0 | 16640 | 1 |
| C | 0 | 15668 | 1 |
| D | 0 | 16517 | 1 |
| Mode M9 | |||
|---|---|---|---|
| Quadrant | BADHDUFLAG | Total packets | Discarded packets |
| A | 0 | 12 | 0 |
| B | 0 | 12 | 0 |
| C | 0 | 12 | 0 |
| D | 0 | 12 | 0 |
| Quadrant | Total seconds | Saturated seconds | Saturation percentage |
|---|---|---|---|
| A | 6177 | 188 | 3.043549% |
| B | 6177 | 239 | 3.869192% |
| C | 6177 | 369 | 5.973774% |
| D | 6177 | 159 | 2.574065% |
Noise dominated data is calculated using 1-second bins in cleaned event files. If a bin has >2000 counts, and if more than 50% of those come from <1% of pixels, then it is considered to be noise-dominated and hence unusable.
| Quadrant | # 1 sec bins | Bins with >0 counts | Bins with >2000 counts | High rate bins dominated by noise | Noise dominated (total time) | Noise dominated (detector-on time) | Marked lightcurve |
|---|---|---|---|---|---|---|---|
| A | 7312 | 6178 | 106 | 106 | 1.45% | 1.72% | 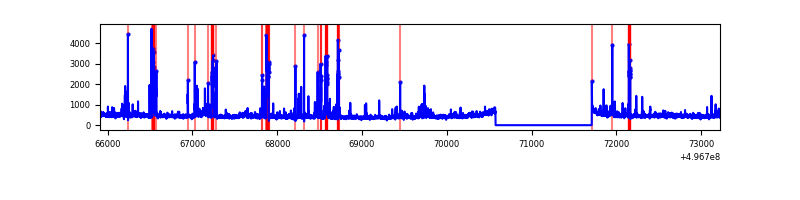 |
| B | 7312 | 6178 | 103 | 103 | 1.41% | 1.67% | 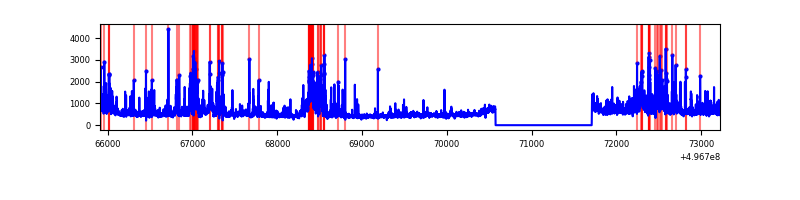 |
| C | 7312 | 6178 | 293 | 293 | 4.01% | 4.74% |  |
| D | 7312 | 6178 | 76 | 76 | 1.04% | 1.23% | 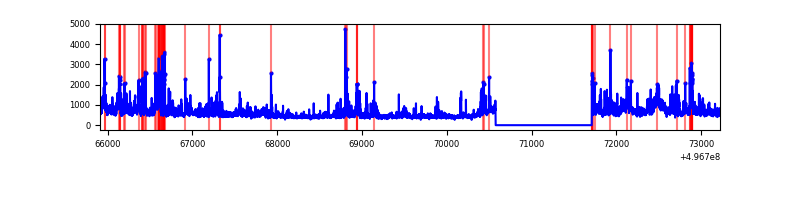 |
Top three noisy pixels from each quadrant. If the there are fewer than three noisy pixels in the level2.evt file, extra rows are filled as -1
| Pixel properties | Quadrant properties | ||||||
|---|---|---|---|---|---|---|---|
| Quadrant | DetID | PixID | Counts | Sigma | Mean | Median | Sigma |
| A | 15 | 174 | 234125 | 1427.54 | 657 | 641 | 163.6 |
| A | 4 | 249 | 160373 | 976.62 | 657 | 641 | 163.6 |
| A | 5 | 243 | 113982 | 692.98 | 657 | 641 | 163.6 |
| B | 0 | 213 | 402250 | 2932.99 | 650 | 627 | 136.9 |
| B | 15 | 20 | 224318 | 1633.58 | 650 | 627 | 136.9 |
| B | 14 | 167 | 223600 | 1628.34 | 650 | 627 | 136.9 |
| C | 1 | 241 | 557194 | 3190.9 | 635 | 629 | 174.4 |
| C | 13 | 3 | 514343 | 2945.22 | 635 | 629 | 174.4 |
| C | 15 | 233 | 42745 | 241.46 | 635 | 629 | 174.4 |
| D | 2 | 172 | 541202 | 2944.73 | 644 | 615 | 183.6 |
| D | 8 | 176 | 350747 | 1907.27 | 644 | 615 | 183.6 |
| D | 2 | 165 | 187615 | 1018.64 | 644 | 615 | 183.6 |
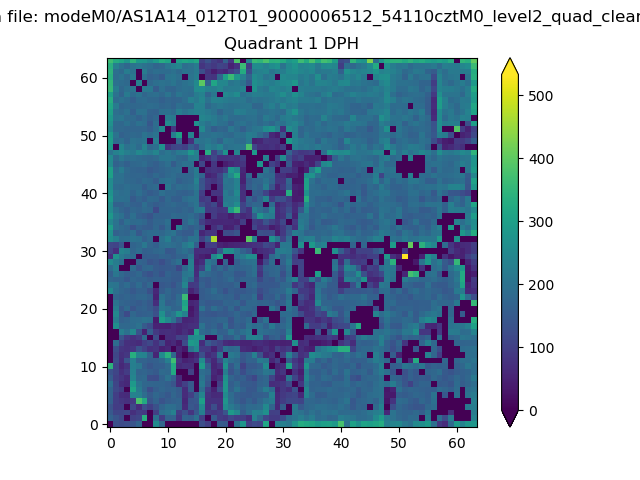
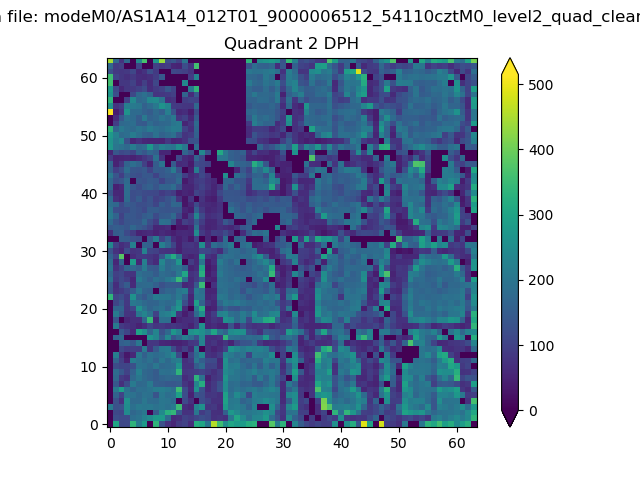
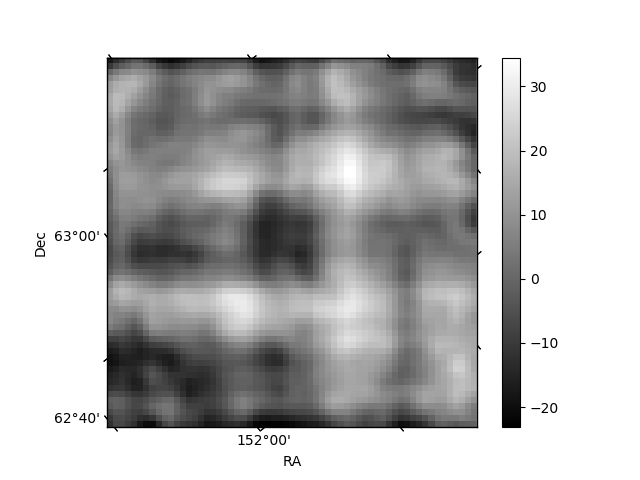
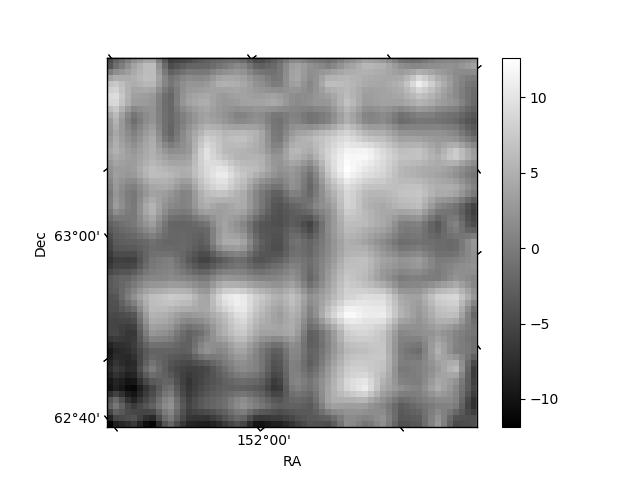
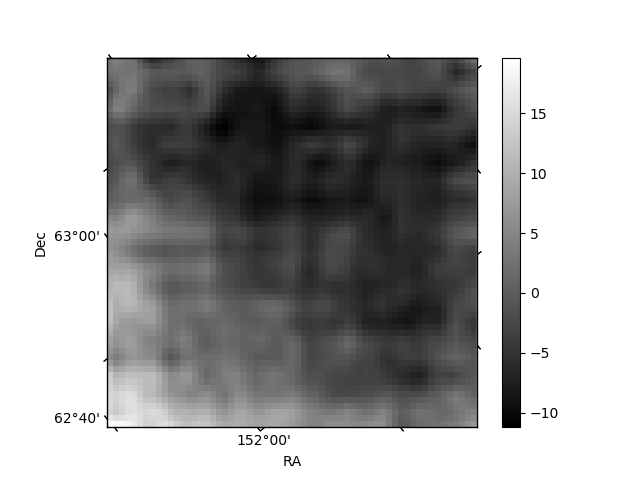
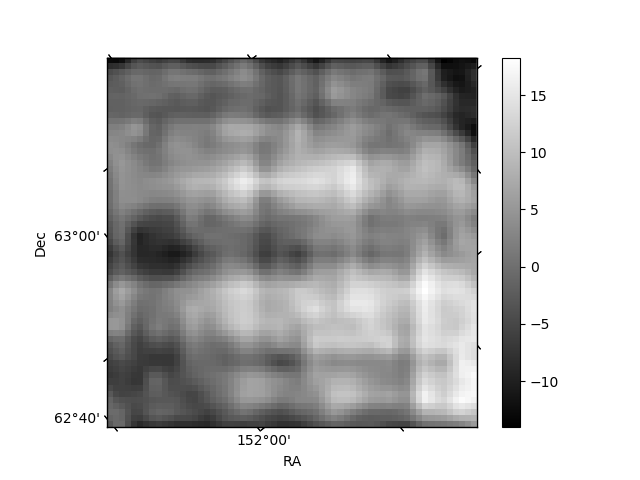
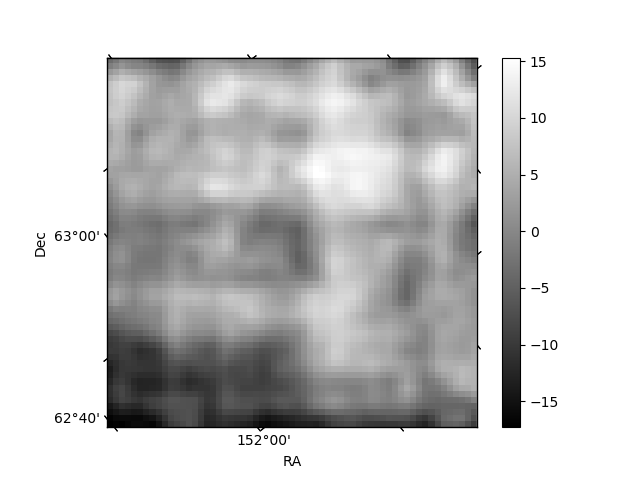
Histogram calculated using DETX and DETY for each event in the final _common_clean file
| Quadrant A | 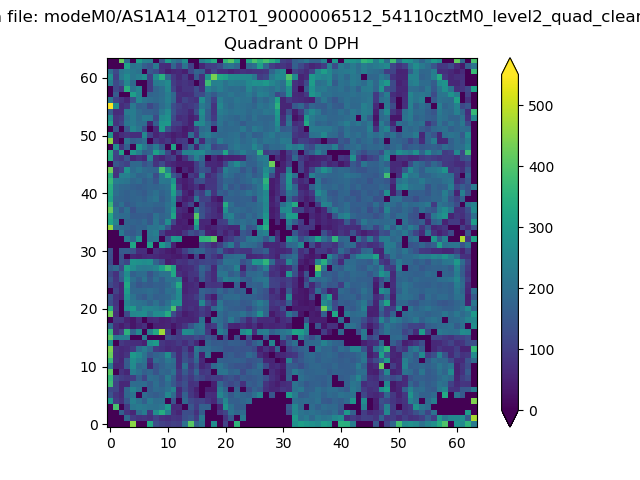 |
 |
Quadrant B |
|---|---|---|---|
| Quadrant D | 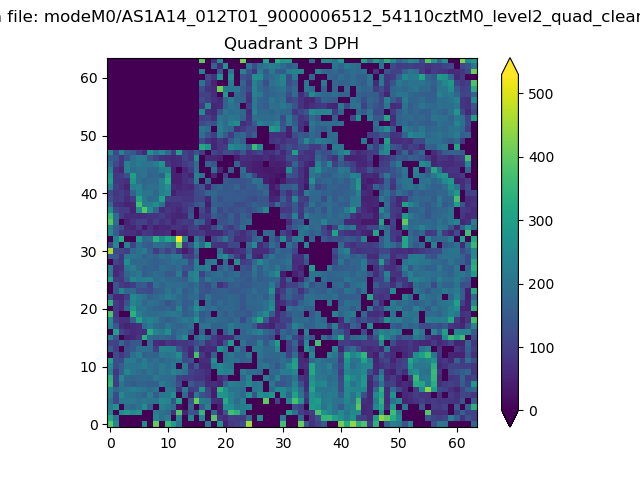 |
 |
Quadrant C |
| Plot type | Count rate plots | Images |
|---|---|---|
| Comparison with Poisson distribution Blue bars denote a histogram of data divided into 1 sec bins. Red curve is a Poisson curve with rate = median count rate of data. |
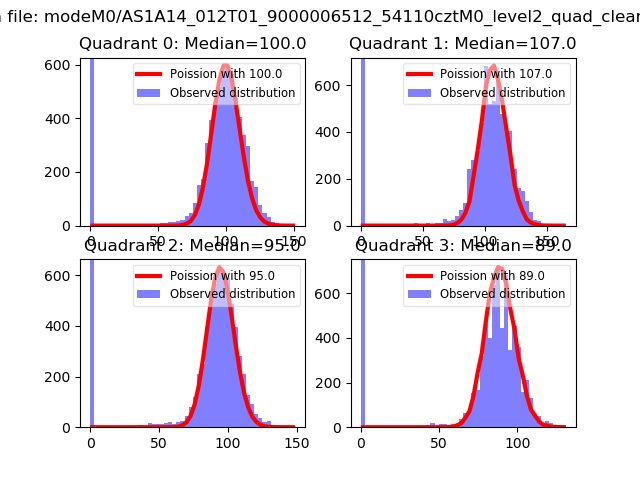 |
 |
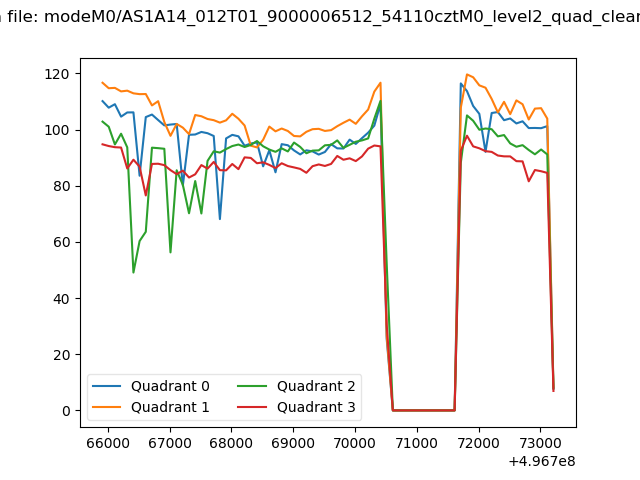
| Quadrant-wise count rates Data is divided into 100 sec bins |
 |
|
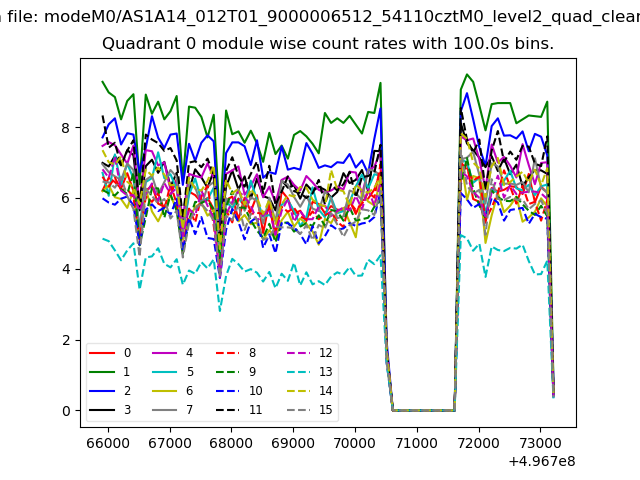
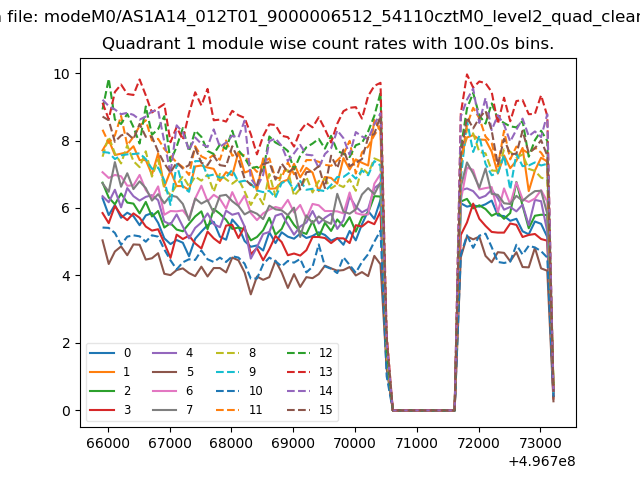
| Module-wise count rates for Quadrant A Data is divided into 100 sec bins |
 |
 |
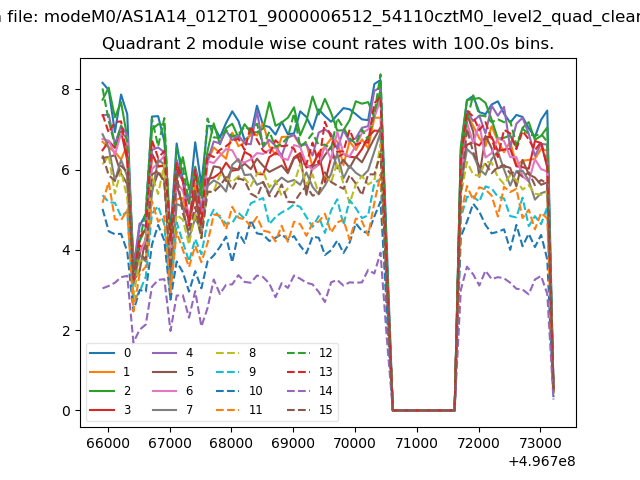
| Module-wise count rates for Quadrant B Data is divided into 100 sec bins |
 |
 |
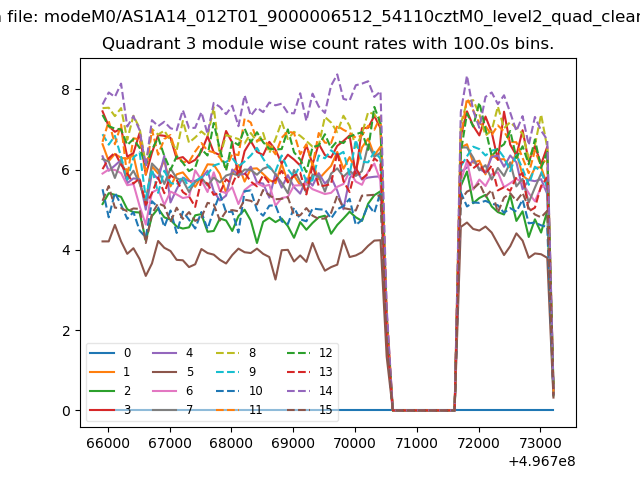
| Module-wise count rates for Quadrant C Data is divided into 100 sec bins |
 |
 |
| Module-wise count rates for Quadrant D Data is divided into 100 sec bins |
 |
 |
| Parameter | Plot |
|---|---|
| CZT HV Monitor | 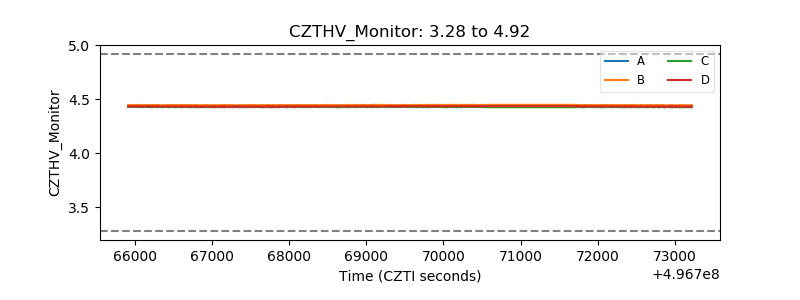 |
| D_VDD | 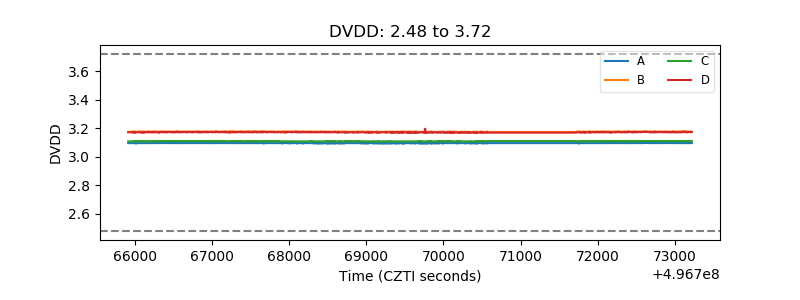 |
| Temperature 1 | 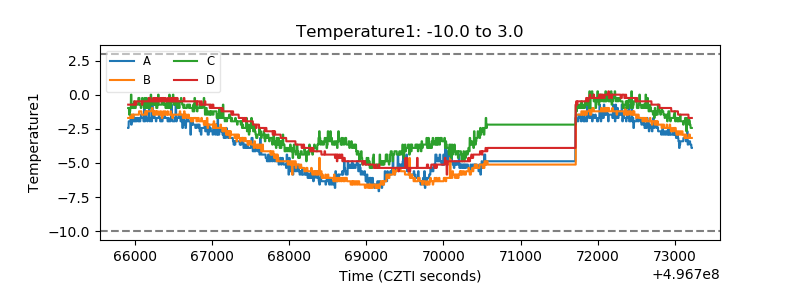 |
| Veto HV Monitor | 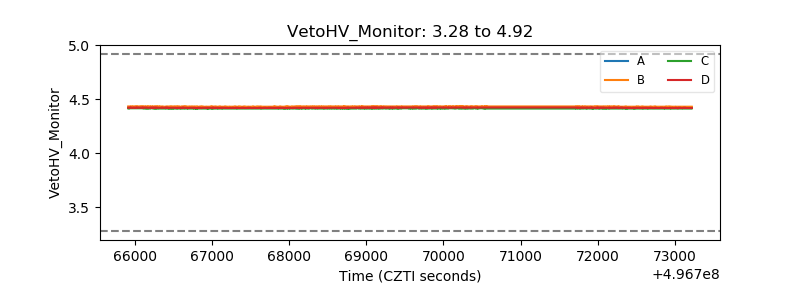 |
| Veto LLD |  |
| Alpha Counter | 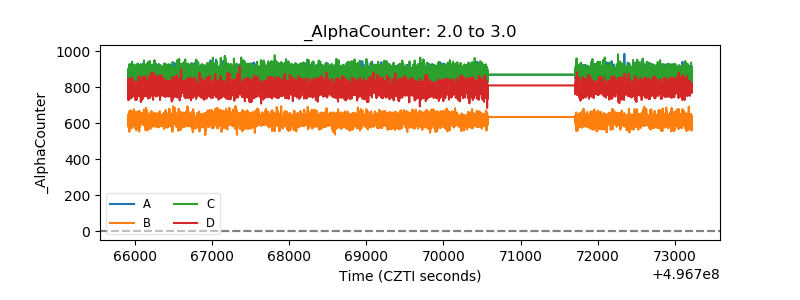 |
| _CPM_Rate | 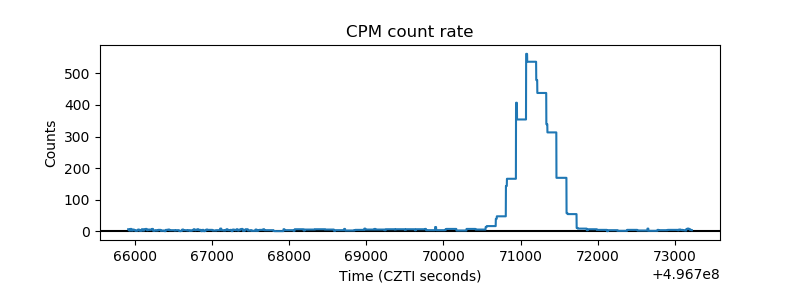 |
| CZT Counter | 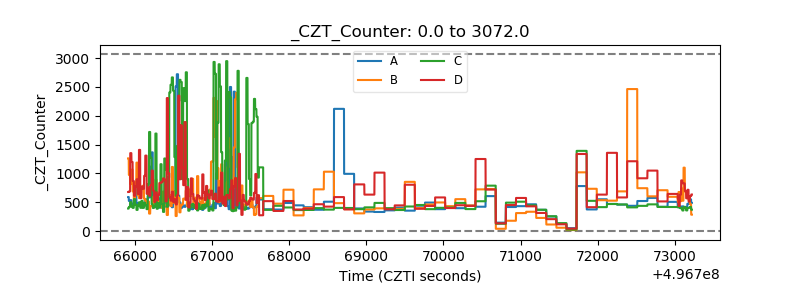 |
| +2.5 Volts monitor | 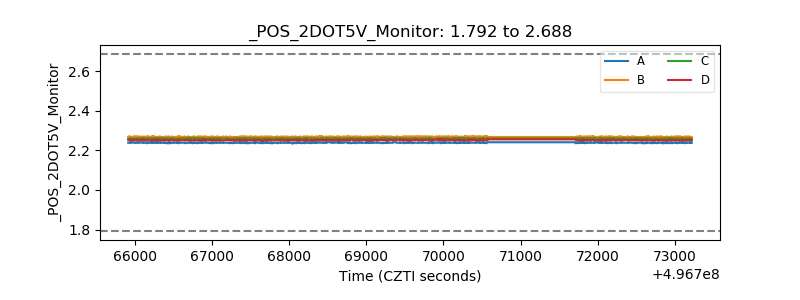 |
| +5 Volts monitor | 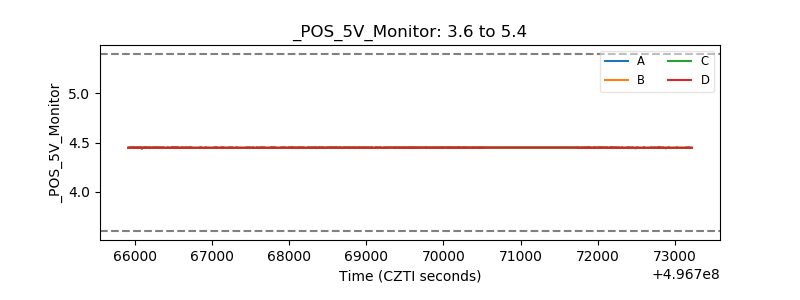 |
| _ROLL_ROT | 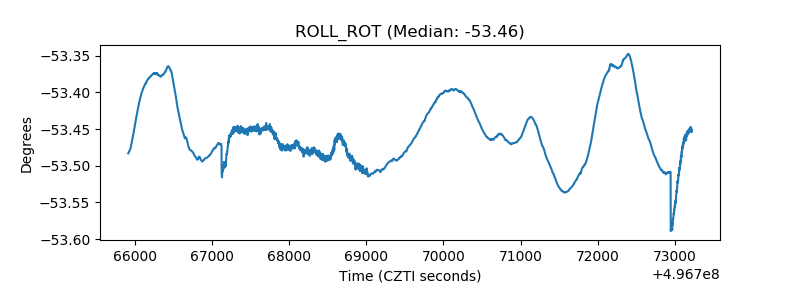 |
| _Roll_DEC | 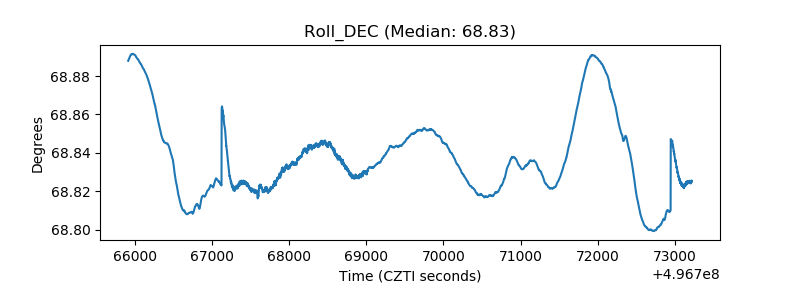 |
| _Roll_RA | 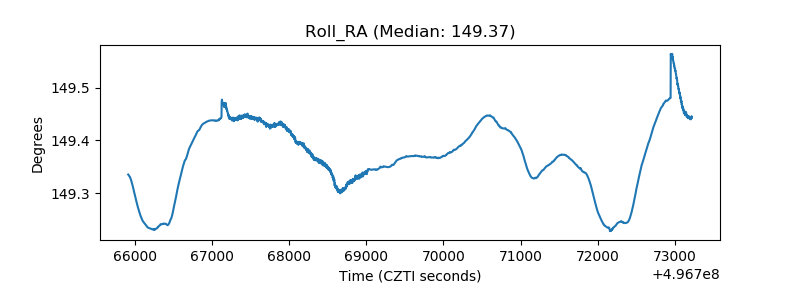 |
| Veto Counter | 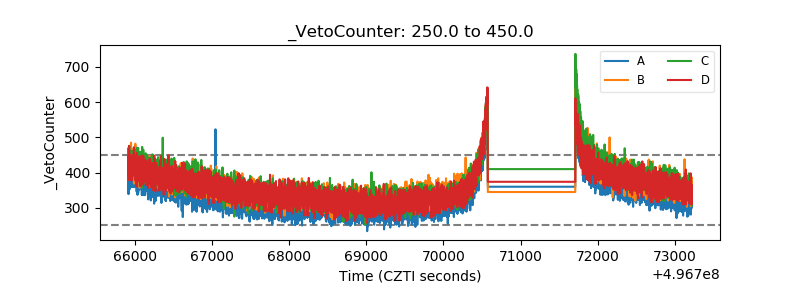 |