| Param | Original file | Final file |
|---|---|---|
| Filename | modeM0/AS1A14_012T01_9000006512_54111cztM0_level2.fits | modeM0/AS1A14_012T01_9000006512_54111cztM0_level2_quad_clean.evt |
| Size (bytes) | 397,658,880 | 91,782,720 |
| Size | 379.2 MB | 87.5 MB |
| Events in quadrant A | 2,805,990 | 606,089 |
| Events in quadrant B | 4,616,927 | 622,271 |
| Events in quadrant C | 2,987,247 | 579,074 |
| Events in quadrant D | 3,828,072 | 539,520 |
| Mode SS | |||
|---|---|---|---|
| Quadrant | BADHDUFLAG | Total packets | Discarded packets |
| A | 0 | 126 | 0 |
| B | 0 | 126 | 0 |
| C | 0 | 126 | 0 |
| D | 0 | 126 | 0 |
| Mode M0 | |||
|---|---|---|---|
| Quadrant | BADHDUFLAG | Total packets | Discarded packets |
| A | 0 | 13053 | 1 |
| B | 0 | 18094 | 2 |
| C | 0 | 13519 | 1 |
| D | 0 | 15704 | 1 |
| Mode M9 | |||
|---|---|---|---|
| Quadrant | BADHDUFLAG | Total packets | Discarded packets |
| A | 0 | 11 | 0 |
| B | 0 | 11 | 0 |
| C | 0 | 11 | 0 |
| D | 0 | 11 | 0 |
| Quadrant | Total seconds | Saturated seconds | Saturation percentage |
|---|---|---|---|
| A | 6193 | 52 | 0.839658% |
| B | 6192 | 424 | 6.847545% |
| C | 6193 | 79 | 1.275634% |
| D | 6193 | 69 | 1.114161% |
Noise dominated data is calculated using 1-second bins in cleaned event files. If a bin has >2000 counts, and if more than 50% of those come from <1% of pixels, then it is considered to be noise-dominated and hence unusable.
| Quadrant | # 1 sec bins | Bins with >0 counts | Bins with >2000 counts | High rate bins dominated by noise | Noise dominated (total time) | Noise dominated (detector-on time) | Marked lightcurve |
|---|---|---|---|---|---|---|---|
| A | 7278 | 6194 | 23 | 23 | 0.32% | 0.37% | 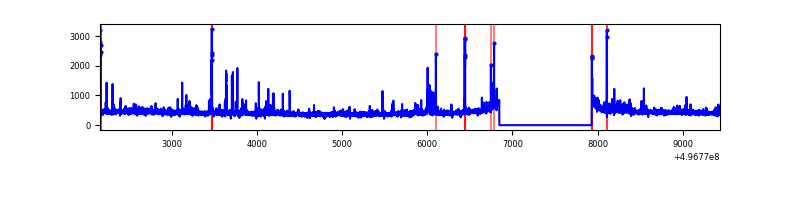 |
| B | 7277 | 6193 | 255 | 255 | 3.50% | 4.12% | 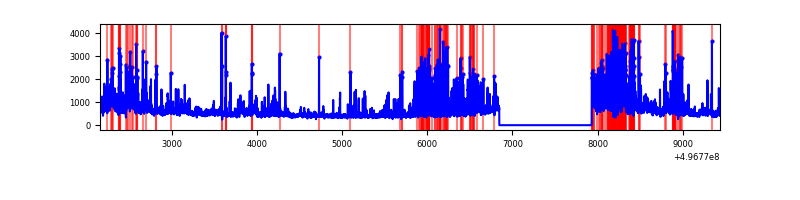 |
| C | 7278 | 6194 | 46 | 46 | 0.63% | 0.74% | 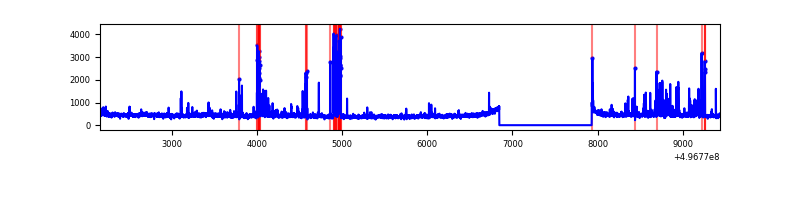 |
| D | 7278 | 6194 | 31 | 31 | 0.43% | 0.50% | 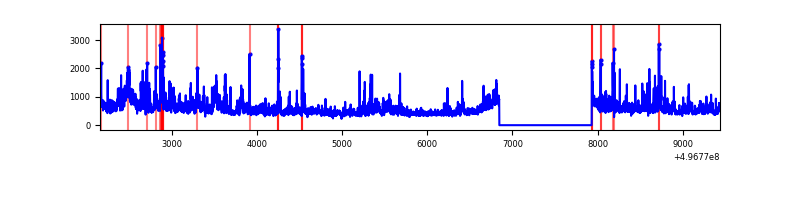 |
Top three noisy pixels from each quadrant. If the there are fewer than three noisy pixels in the level2.evt file, extra rows are filled as -1
| Pixel properties | Quadrant properties | ||||||
|---|---|---|---|---|---|---|---|
| Quadrant | DetID | PixID | Counts | Sigma | Mean | Median | Sigma |
| A | 4 | 249 | 87292 | 534.95 | 651 | 636 | 162.0 |
| A | 15 | 174 | 55888 | 341.08 | 651 | 636 | 162.0 |
| A | 12 | 17 | 34692 | 210.24 | 651 | 636 | 162.0 |
| B | 5 | 236 | 1017162 | 7563.71 | 633 | 611 | 134.4 |
| B | 15 | 20 | 290431 | 2156.42 | 633 | 611 | 134.4 |
| B | 0 | 213 | 276017 | 2049.17 | 633 | 611 | 134.4 |
| C | 1 | 241 | 114408 | 644.29 | 641 | 631 | 176.6 |
| C | 15 | 147 | 100296 | 564.37 | 641 | 631 | 176.6 |
| C | 15 | 157 | 54502 | 305.05 | 641 | 631 | 176.6 |
| D | 2 | 172 | 713364 | 3938.08 | 635 | 607 | 181.0 |
| D | 2 | 153 | 202164 | 1113.63 | 635 | 607 | 181.0 |
| D | 8 | 176 | 104958 | 576.55 | 635 | 607 | 181.0 |
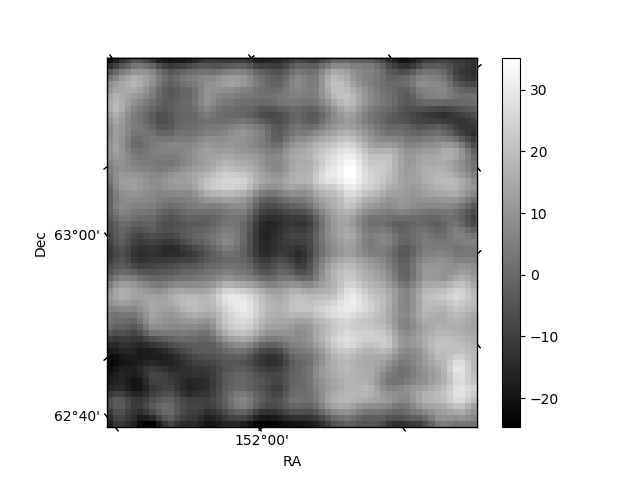
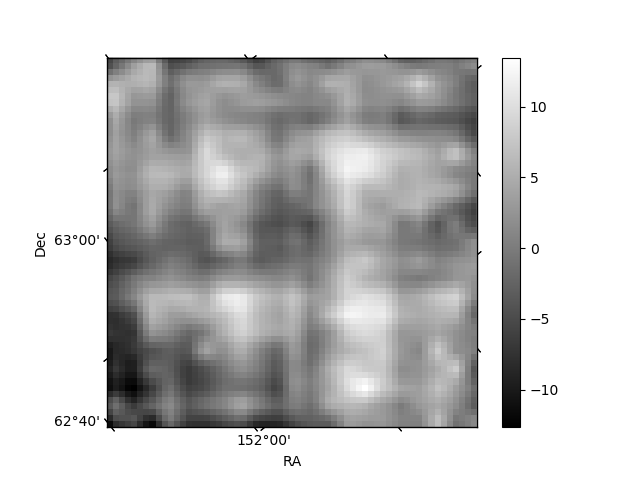
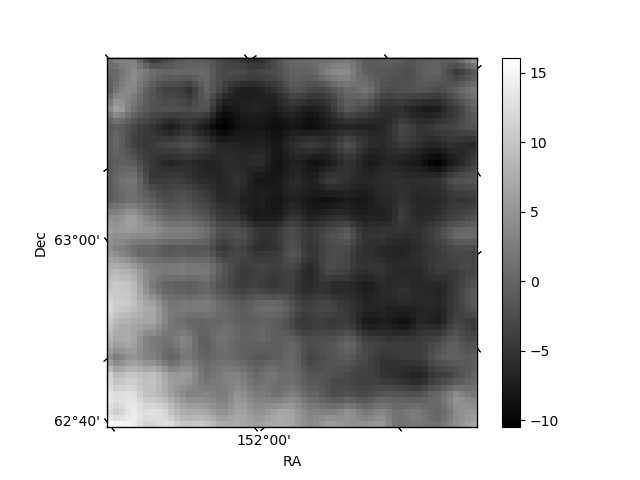
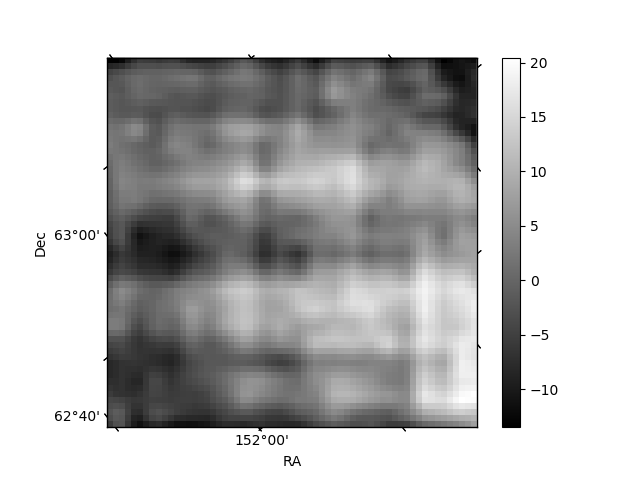
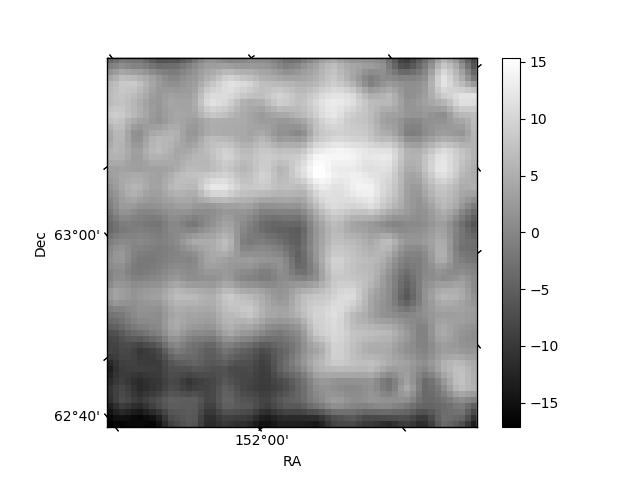
Histogram calculated using DETX and DETY for each event in the final _common_clean file
| Quadrant A | 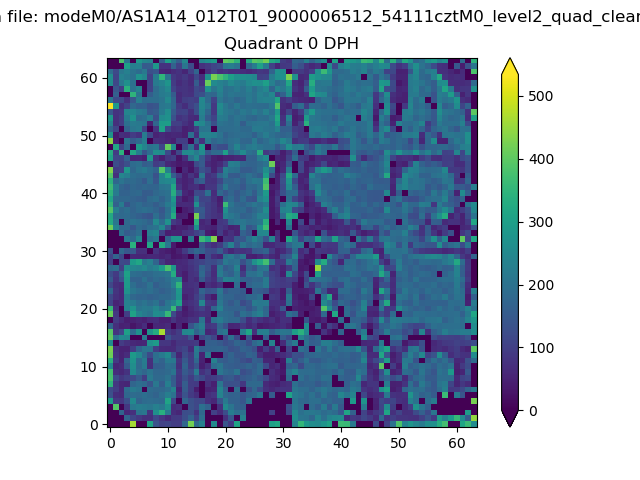 |
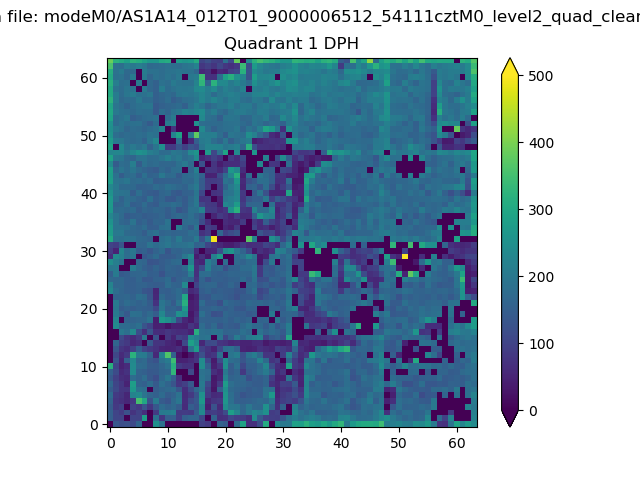 |
Quadrant B |
|---|---|---|---|
| Quadrant D | 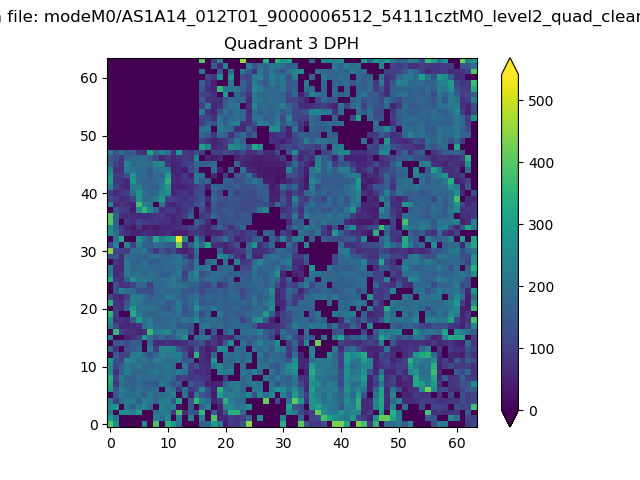 |
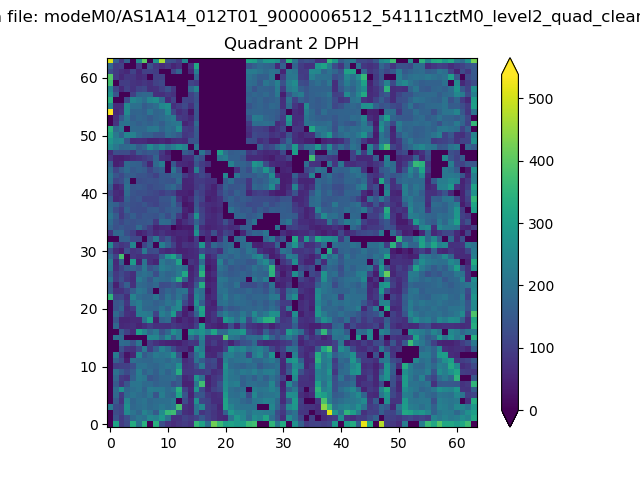 |
Quadrant C |
| Plot type | Count rate plots | Images |
|---|---|---|
| Comparison with Poisson distribution Blue bars denote a histogram of data divided into 1 sec bins. Red curve is a Poisson curve with rate = median count rate of data. |
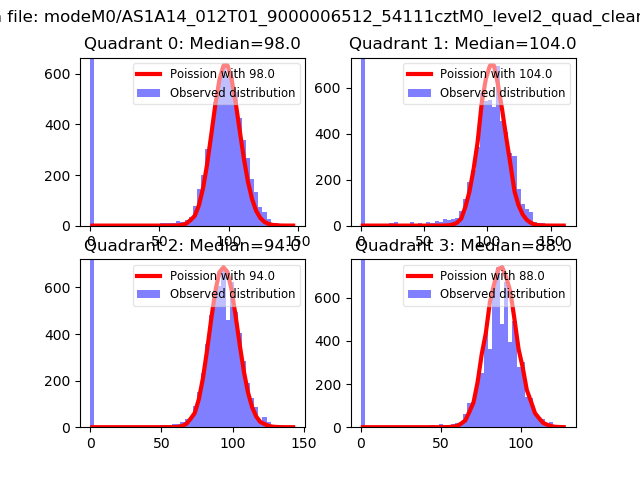 |
 |
| Quadrant-wise count rates Data is divided into 100 sec bins |
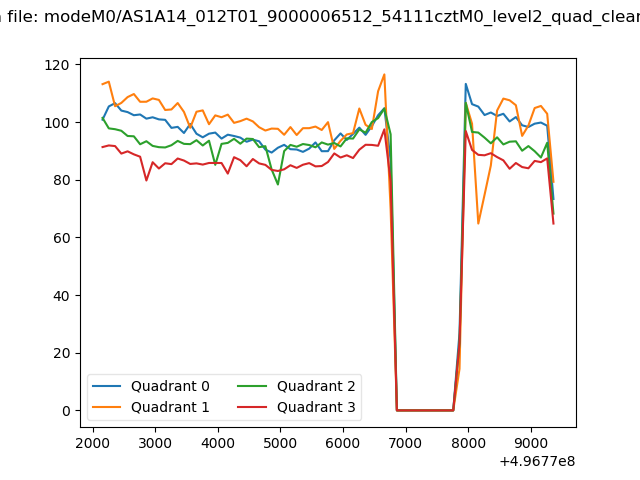 |
|
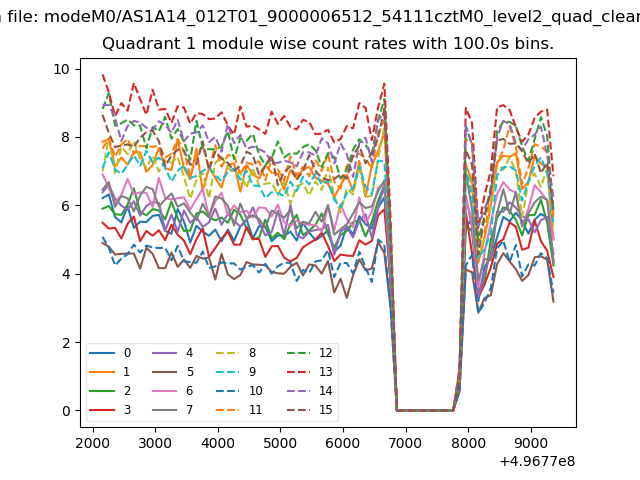
| Module-wise count rates for Quadrant A Data is divided into 100 sec bins |
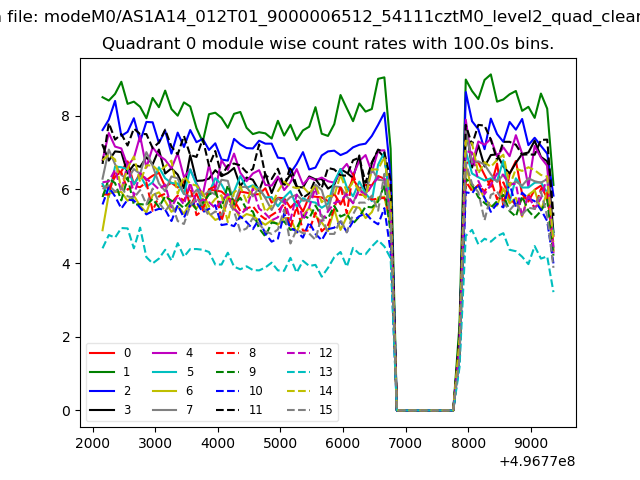 |
 |
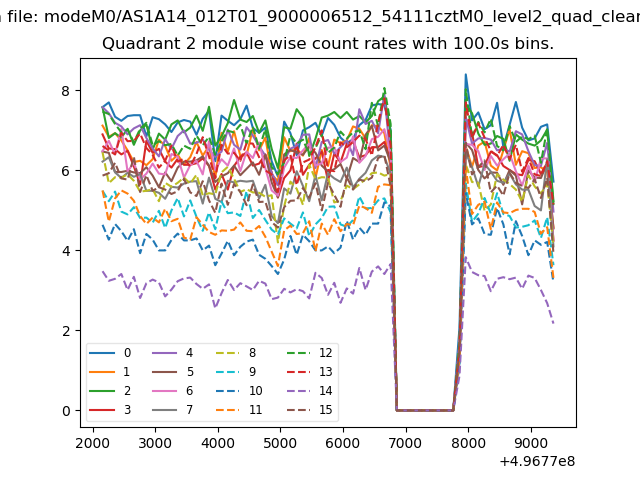
| Module-wise count rates for Quadrant B Data is divided into 100 sec bins |
 |
 |
| Module-wise count rates for Quadrant C Data is divided into 100 sec bins |
 |
 |
| Module-wise count rates for Quadrant D Data is divided into 100 sec bins |
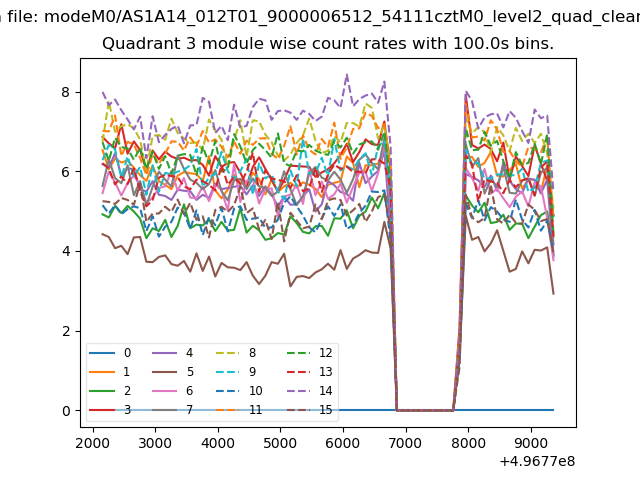 |
 |
| Parameter | Plot |
|---|---|
| CZT HV Monitor | 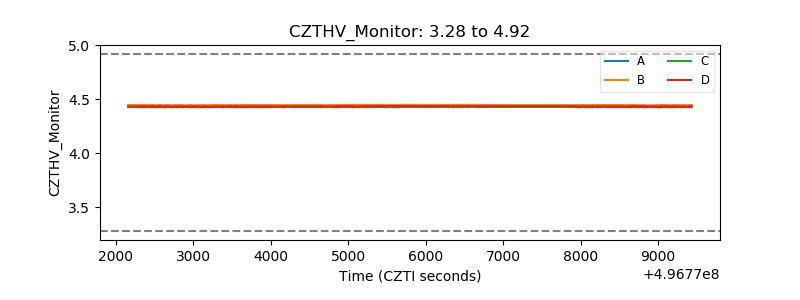 |
| D_VDD | 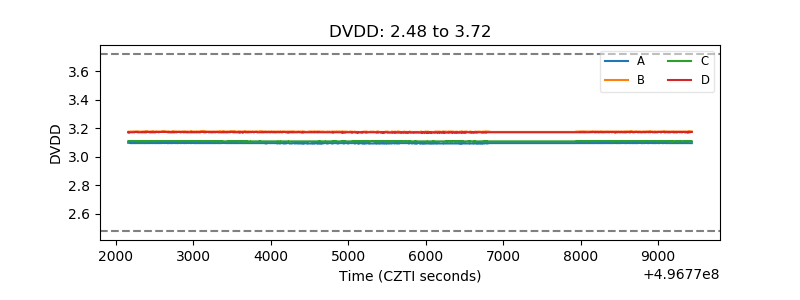 |
| Temperature 1 | 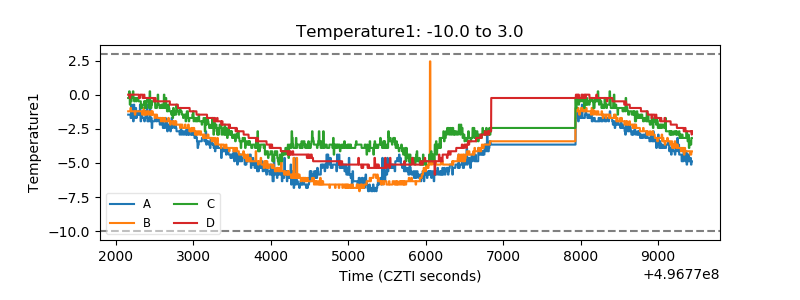 |
| Veto HV Monitor | 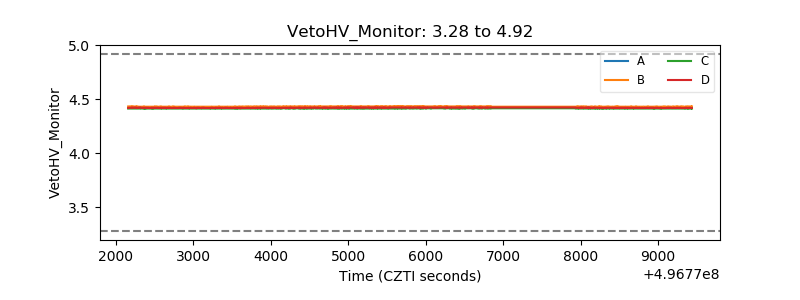 |
| Veto LLD | 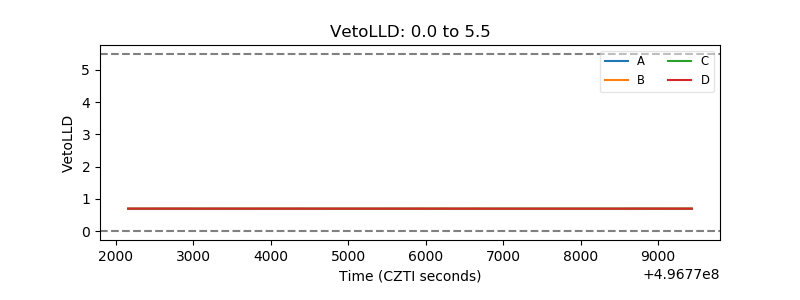 |
| Alpha Counter | 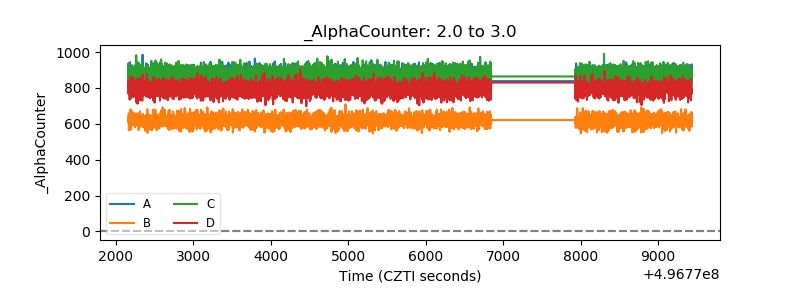 |
| _CPM_Rate | 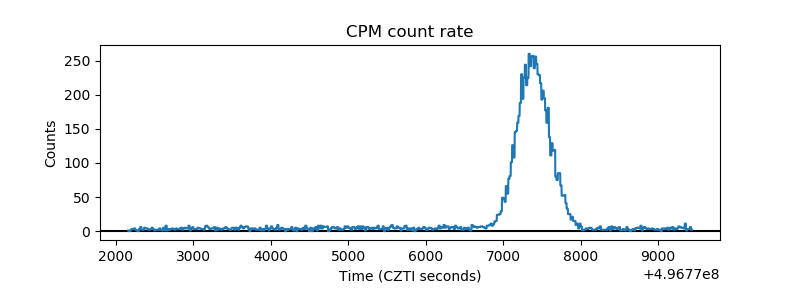 |
| CZT Counter | 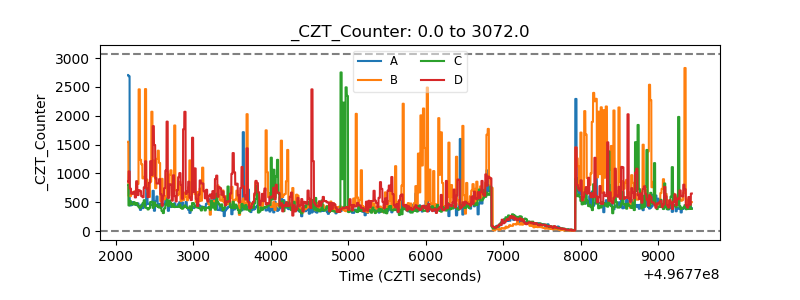 |
| +2.5 Volts monitor |  |
| +5 Volts monitor |  |
| _ROLL_ROT | 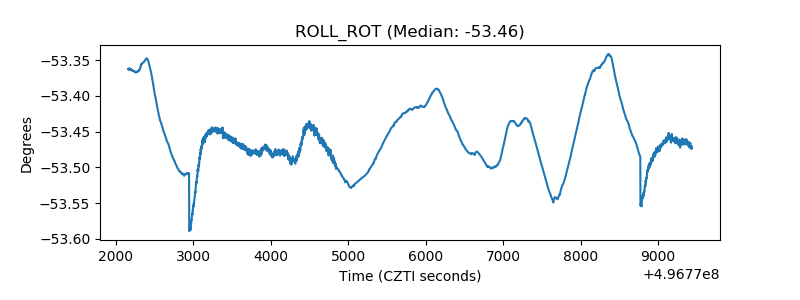 |
| _Roll_DEC | 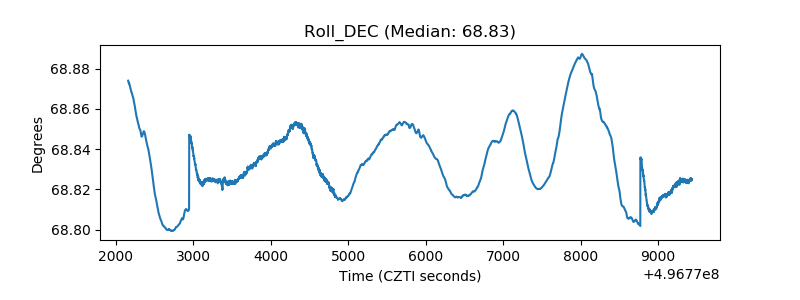 |
| _Roll_RA | 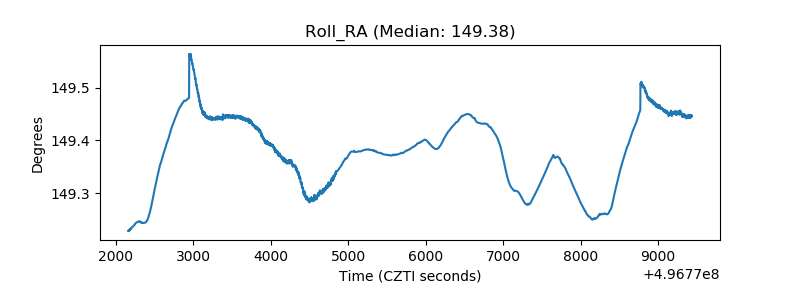 |
| Veto Counter | 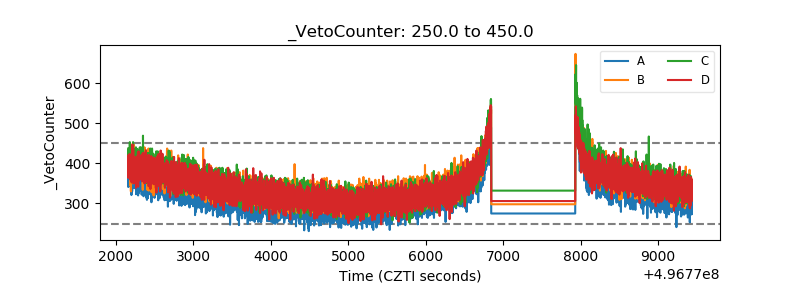 |