| Param | Original file | Final file |
|---|---|---|
| Filename | modeM0/AS1A14_012T01_9000006512_54113cztM0_level2.fits | modeM0/AS1A14_012T01_9000006512_54113cztM0_level2_quad_clean.evt |
| Size (bytes) | 549,233,280 | 97,721,280 |
| Size | 523.8 MB | 93.2 MB |
| Events in quadrant A | 3,732,961 | 648,845 |
| Events in quadrant B | 5,420,397 | 644,127 |
| Events in quadrant C | 4,568,134 | 587,906 |
| Events in quadrant D | 6,020,358 | 550,065 |
| Mode SS | |||
|---|---|---|---|
| Quadrant | BADHDUFLAG | Total packets | Discarded packets |
| A | 0 | 154 | 0 |
| B | 0 | 154 | 0 |
| C | 0 | 154 | 0 |
| D | 0 | 154 | 0 |
| Mode M0 | |||
|---|---|---|---|
| Quadrant | BADHDUFLAG | Total packets | Discarded packets |
| A | 0 | 16885 | 3 |
| B | 0 | 21767 | 3 |
| C | 0 | 19501 | 3 |
| D | 0 | 23248 | 3 |
| Mode M9 | |||
|---|---|---|---|
| Quadrant | BADHDUFLAG | Total packets | Discarded packets |
| A | 0 | 4 | 0 |
| B | 0 | 4 | 0 |
| C | 0 | 5 | 0 |
| D | 0 | 5 | 0 |
| Quadrant | Total seconds | Saturated seconds | Saturation percentage |
|---|---|---|---|
| A | 7580 | 132 | 1.741425% |
| B | 7580 | 781 | 10.303430% |
| C | 7580 | 504 | 6.649077% |
| D | 7580 | 497 | 6.556728% |
Noise dominated data is calculated using 1-second bins in cleaned event files. If a bin has >2000 counts, and if more than 50% of those come from <1% of pixels, then it is considered to be noise-dominated and hence unusable.
| Quadrant | # 1 sec bins | Bins with >0 counts | Bins with >2000 counts | High rate bins dominated by noise | Noise dominated (total time) | Noise dominated (detector-on time) | Marked lightcurve |
|---|---|---|---|---|---|---|---|
| A | 8032 | 7859 | 63 | 63 | 0.78% | 0.80% | 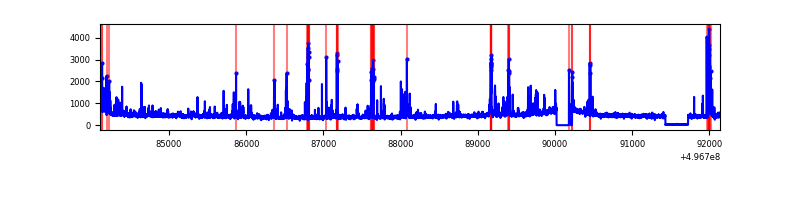 |
| B | 8032 | 7859 | 353 | 353 | 4.39% | 4.49% | 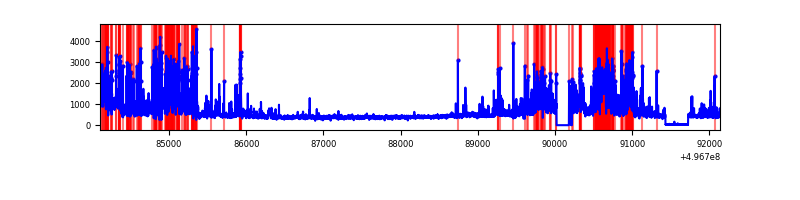 |
| C | 8032 | 7859 | 303 | 303 | 3.77% | 3.86% | 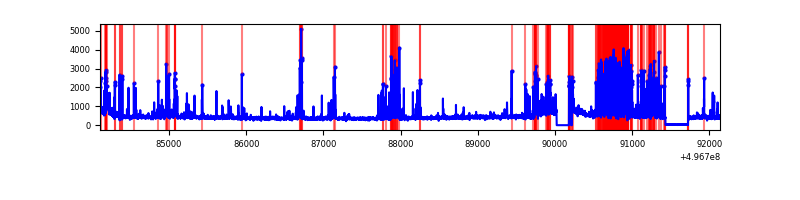 |
| D | 8032 | 7856 | 336 | 336 | 4.18% | 4.28% | 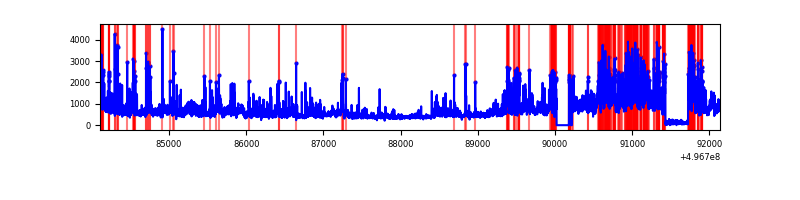 |
Top three noisy pixels from each quadrant. If the there are fewer than three noisy pixels in the level2.evt file, extra rows are filled as -1
| Pixel properties | Quadrant properties | ||||||
|---|---|---|---|---|---|---|---|
| Quadrant | DetID | PixID | Counts | Sigma | Mean | Median | Sigma |
| A | 0 | 8 | 211733 | 1063.14 | 800 | 781 | 198.4 |
| A | 4 | 249 | 105890 | 529.72 | 800 | 781 | 198.4 |
| A | 15 | 174 | 78931 | 393.86 | 800 | 781 | 198.4 |
| B | 5 | 236 | 499307 | 3061.06 | 771 | 742 | 162.9 |
| B | 5 | 185 | 485864 | 2978.52 | 771 | 742 | 162.9 |
| B | 8 | 234 | 351607 | 2154.22 | 771 | 742 | 162.9 |
| C | 15 | 147 | 894547 | 4223.76 | 769 | 762 | 211.6 |
| C | 13 | 3 | 380881 | 1796.33 | 769 | 762 | 211.6 |
| C | 15 | 157 | 111940 | 525.39 | 769 | 762 | 211.6 |
| D | 2 | 165 | 799070 | 3645.7 | 768 | 732 | 219.0 |
| D | 2 | 172 | 604794 | 2758.52 | 768 | 732 | 219.0 |
| D | 8 | 176 | 392572 | 1789.38 | 768 | 732 | 219.0 |
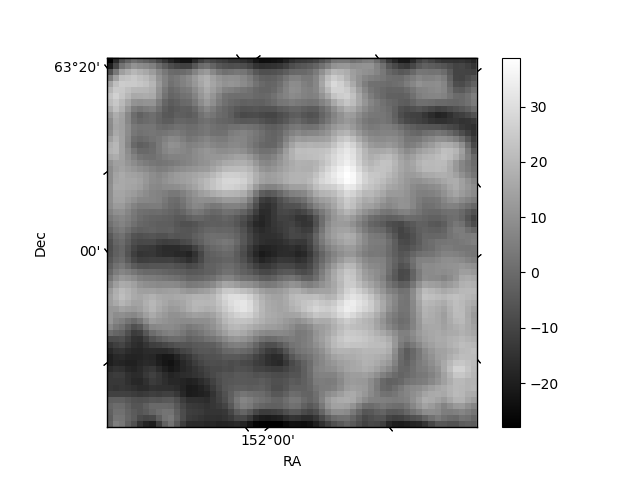
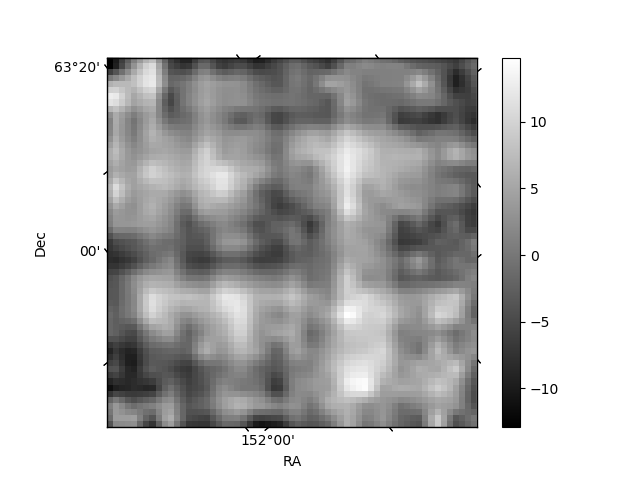
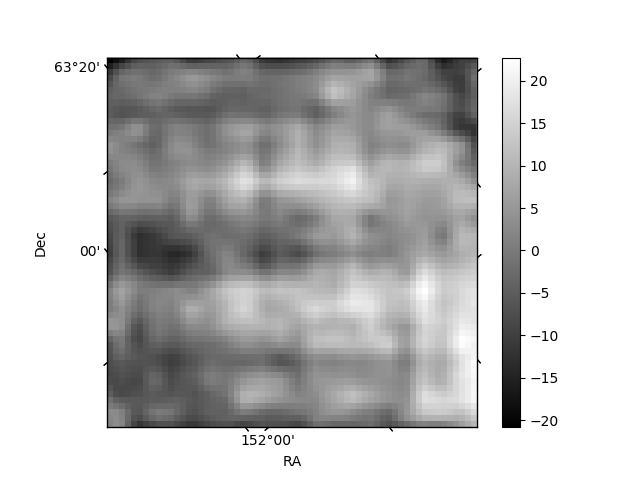
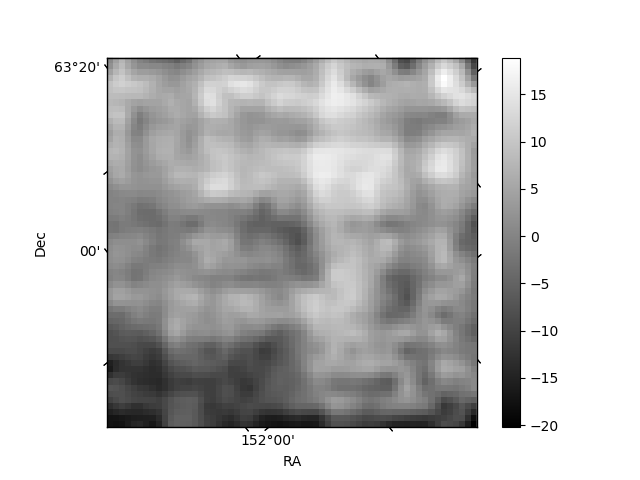
Histogram calculated using DETX and DETY for each event in the final _common_clean file
| Quadrant A | 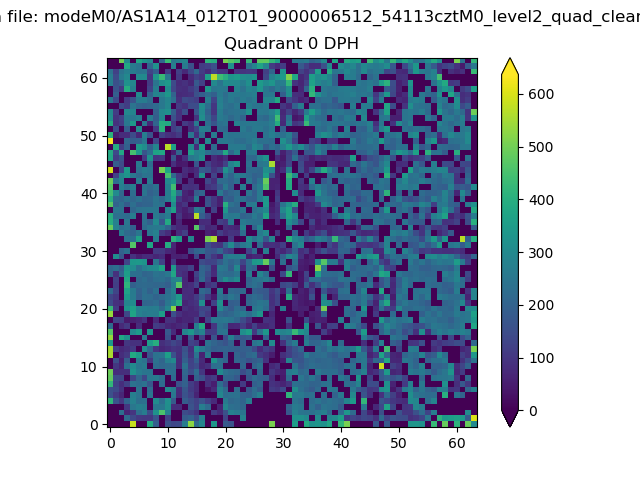 |
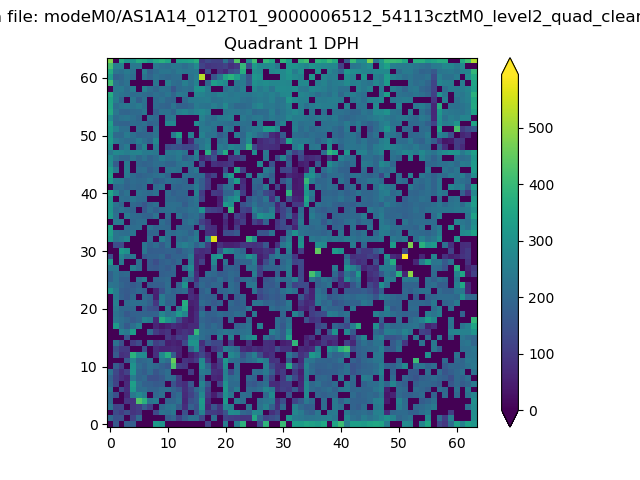 |
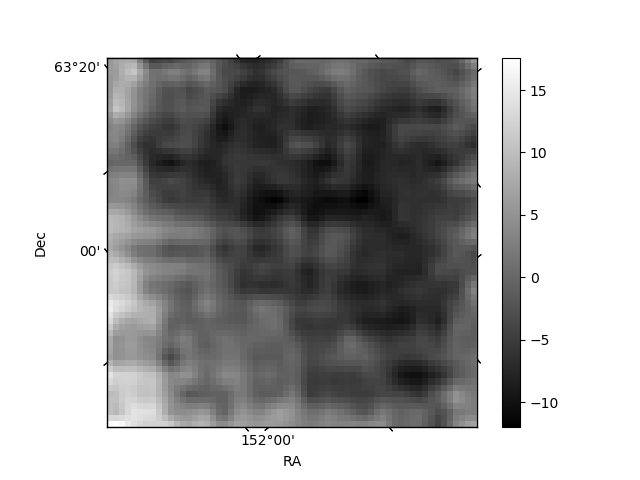
Quadrant B |
|---|---|---|---|
| Quadrant D | 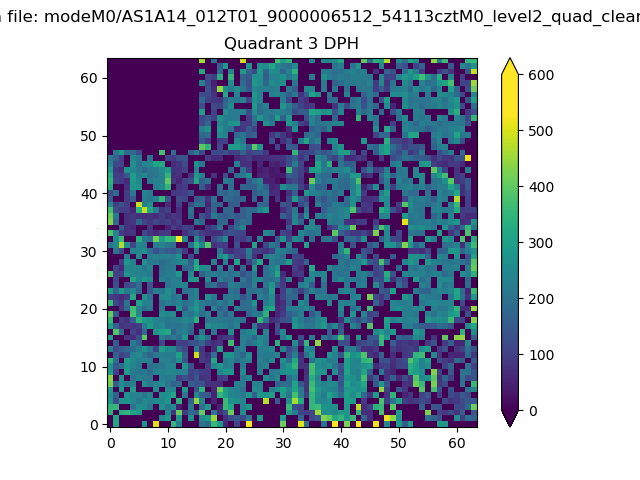 |
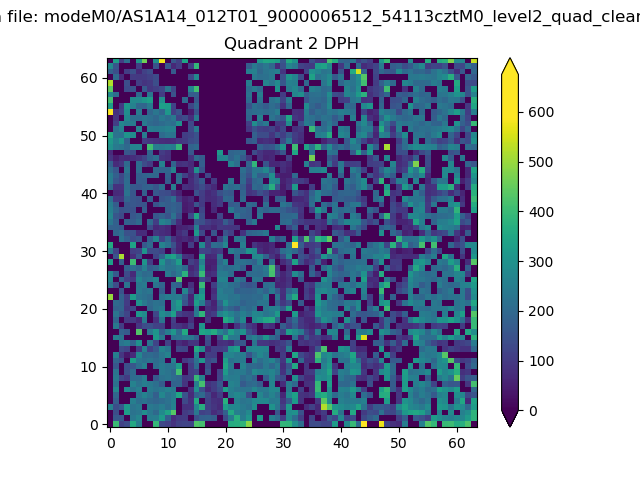 |
Quadrant C |
| Plot type | Count rate plots | Images |
|---|---|---|
| Comparison with Poisson distribution Blue bars denote a histogram of data divided into 1 sec bins. Red curve is a Poisson curve with rate = median count rate of data. |
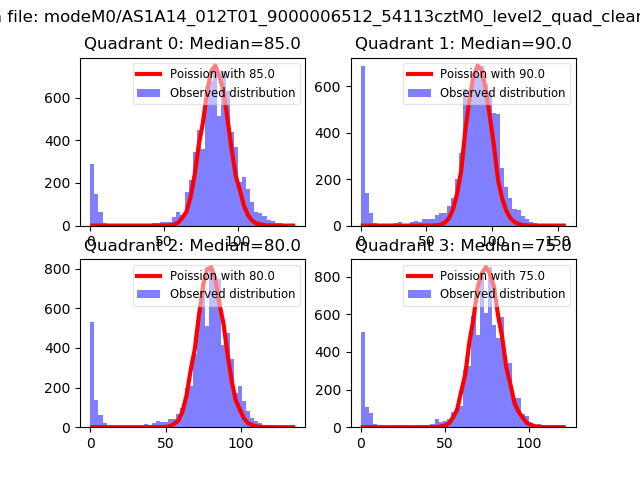 |
 |
| Quadrant-wise count rates Data is divided into 100 sec bins |
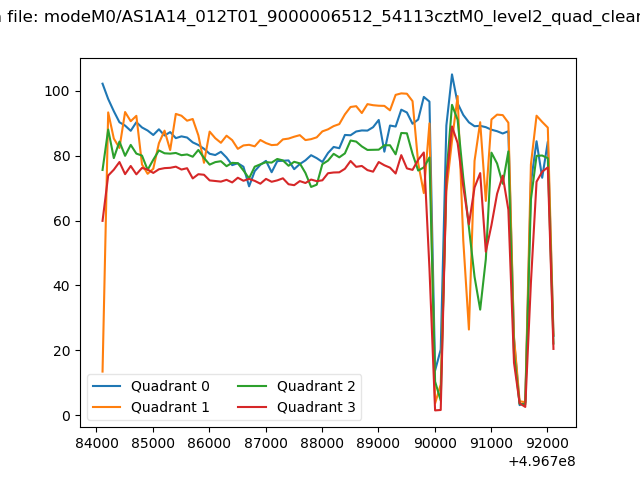 |
|
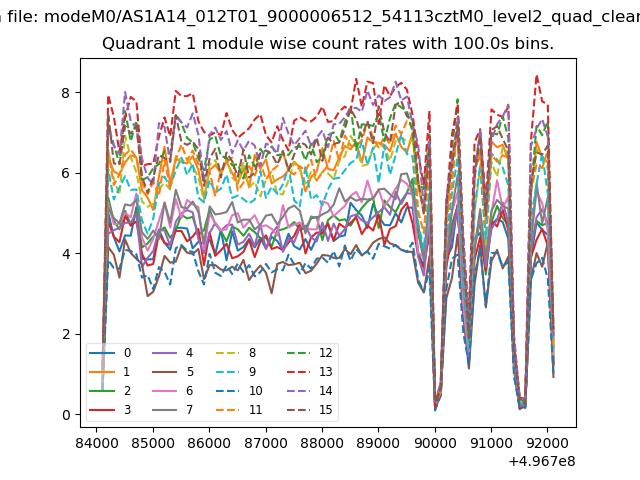
| Module-wise count rates for Quadrant A Data is divided into 100 sec bins |
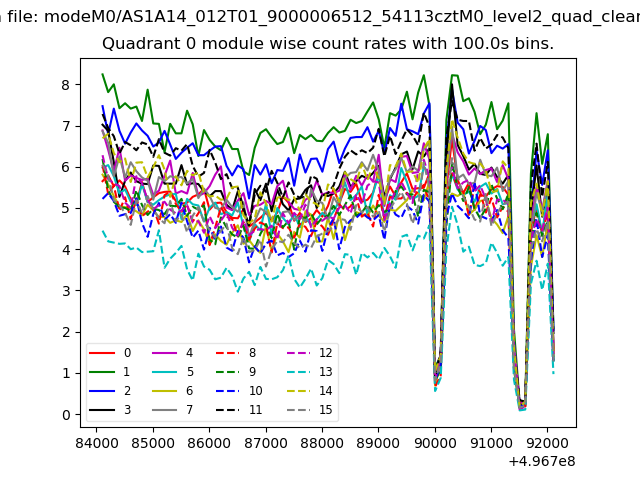 |
 |
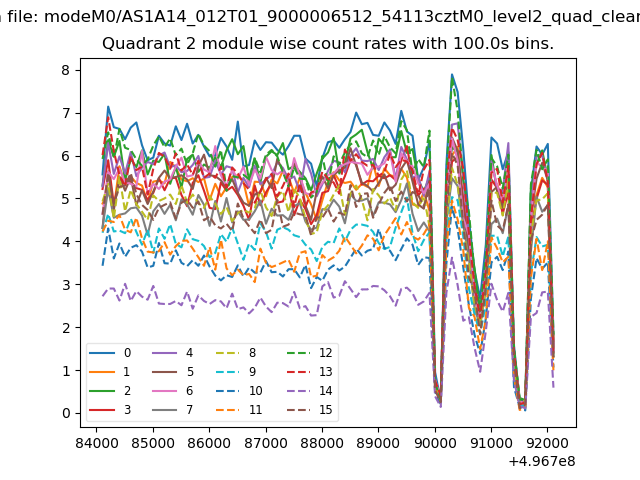
| Module-wise count rates for Quadrant B Data is divided into 100 sec bins |
 |
 |
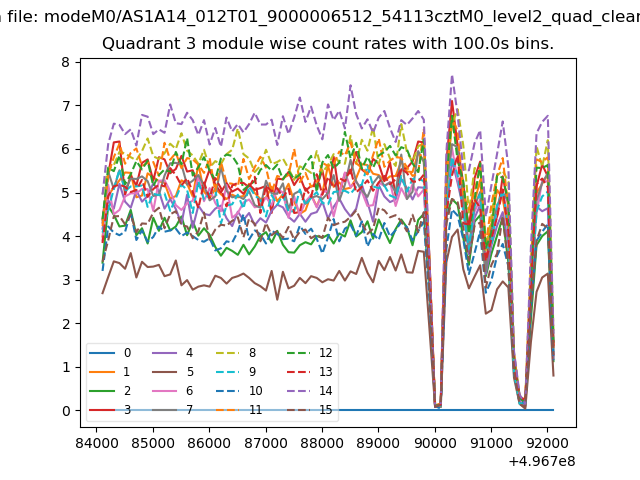
| Module-wise count rates for Quadrant C Data is divided into 100 sec bins |
 |
 |
| Module-wise count rates for Quadrant D Data is divided into 100 sec bins |
 |
 |
| Parameter | Plot |
|---|---|
| CZT HV Monitor | 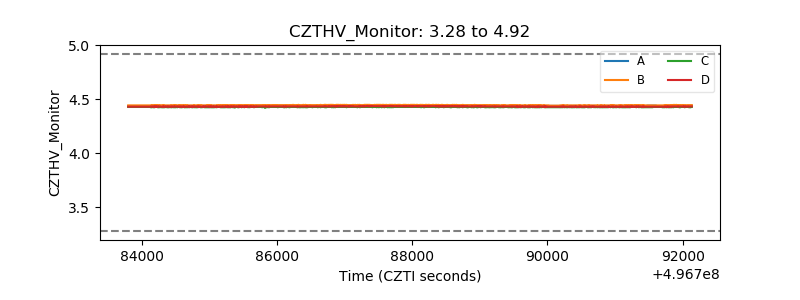 |
| D_VDD | 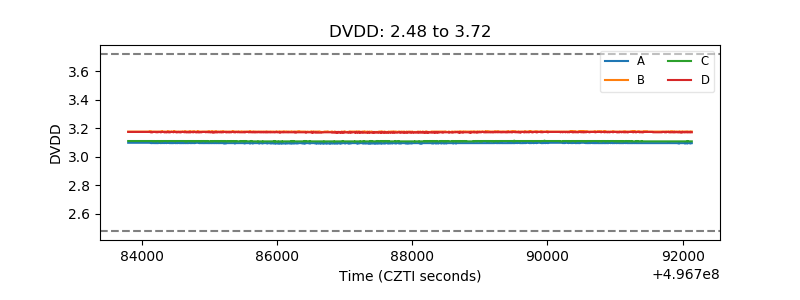 |
| Temperature 1 | 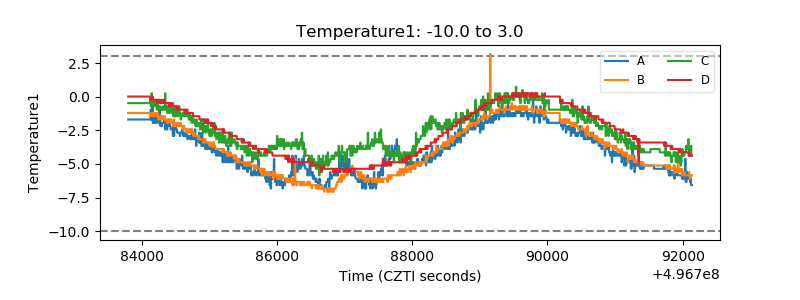 |
| Veto HV Monitor | 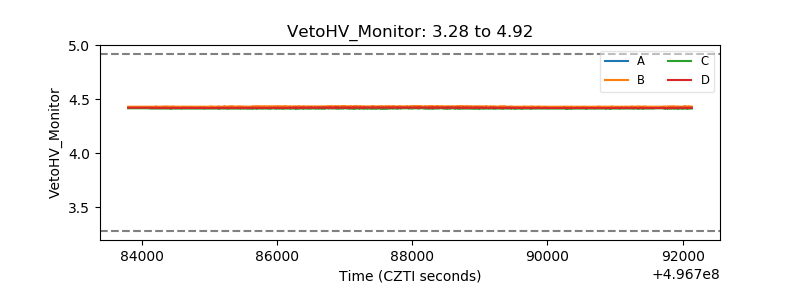 |
| Veto LLD | 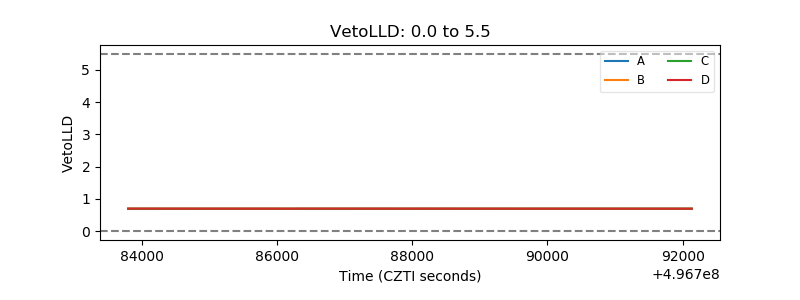 |
| Alpha Counter | 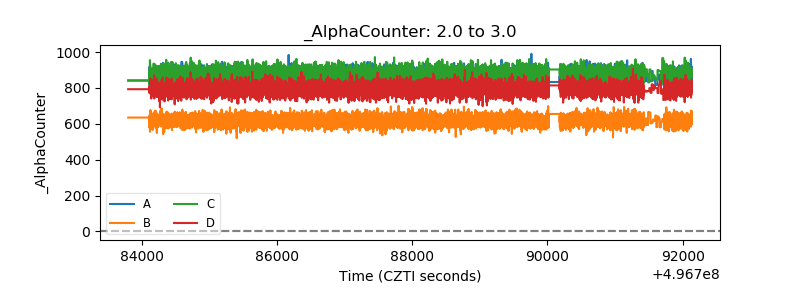 |
| _CPM_Rate | 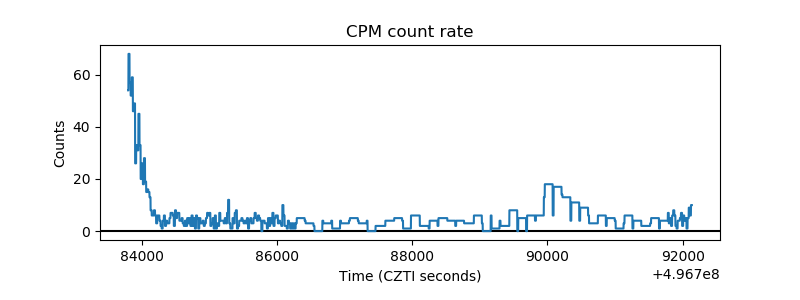 |
| CZT Counter | 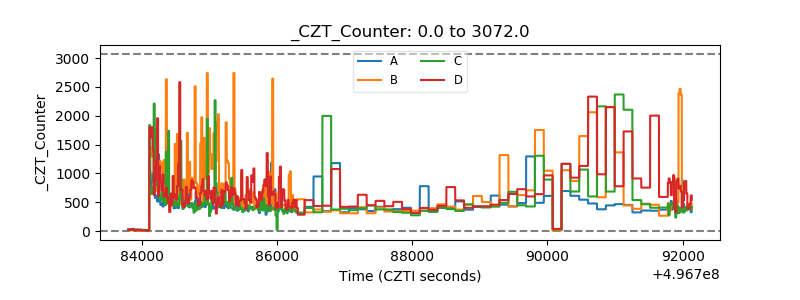 |
| +2.5 Volts monitor |  |
| +5 Volts monitor | 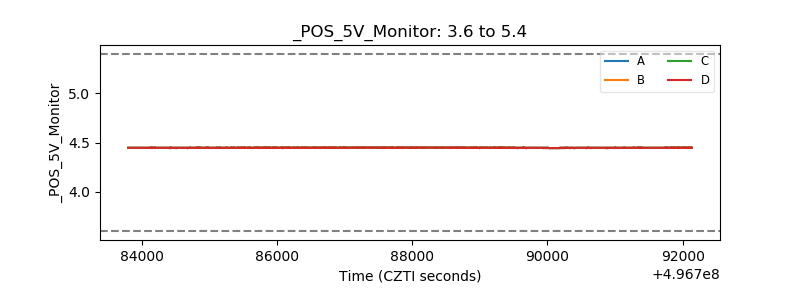 |
| _ROLL_ROT | 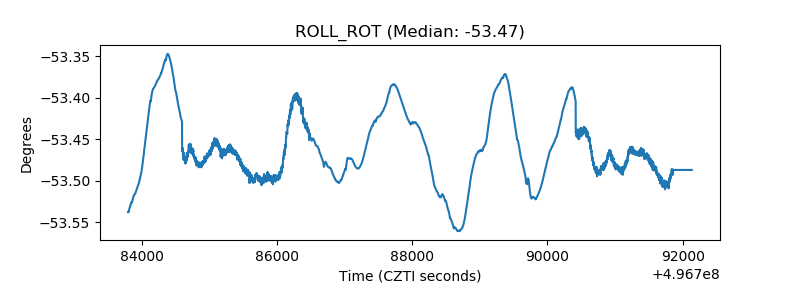 |
| _Roll_DEC | 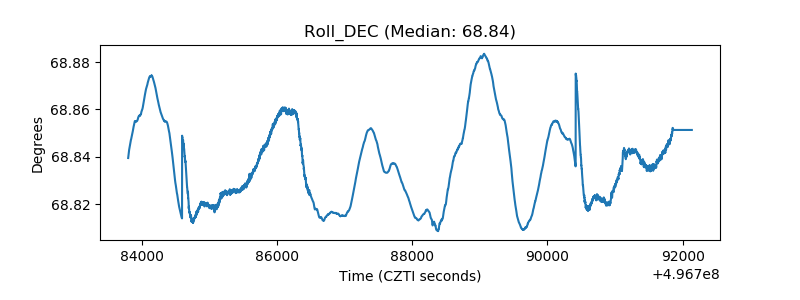 |
| _Roll_RA | 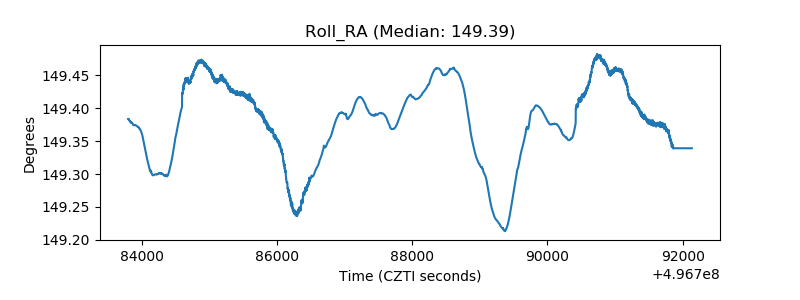 |
| Veto Counter | 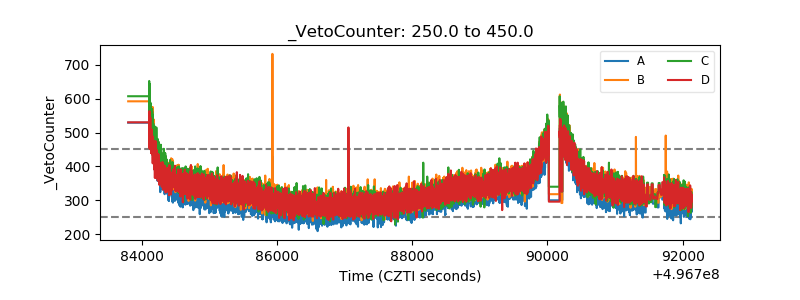 |