| Param | Original file | Final file |
|---|---|---|
| Filename | modeM0/AS1A14_012T01_9000006512_54114cztM0_level2.fits | modeM0/AS1A14_012T01_9000006512_54114cztM0_level2_quad_clean.evt |
| Size (bytes) | 623,825,280 | 104,567,040 |
| Size | 594.9 MB | 99.7 MB |
| Events in quadrant A | 4,211,619 | 686,999 |
| Events in quadrant B | 5,300,485 | 701,046 |
| Events in quadrant C | 6,468,868 | 602,243 |
| Events in quadrant D | 6,462,570 | 594,429 |
| Mode SS | |||
|---|---|---|---|
| Quadrant | BADHDUFLAG | Total packets | Discarded packets |
| A | 0 | 172 | 0 |
| B | 0 | 172 | 0 |
| C | 0 | 172 | 0 |
| D | 0 | 172 | 0 |
| Mode M0 | |||
|---|---|---|---|
| Quadrant | BADHDUFLAG | Total packets | Discarded packets |
| A | 0 | 18910 | 2 |
| B | 0 | 22131 | 2 |
| C | 0 | 25648 | 2 |
| D | 0 | 25136 | 2 |
| Mode M9 | |||
|---|---|---|---|
| Quadrant | BADHDUFLAG | Total packets | Discarded packets |
| A | 0 | 1 | 0 |
| B | 0 | 1 | 0 |
| C | 0 | 1 | 0 |
| D | 0 | 1 | 0 |
| Quadrant | Total seconds | Saturated seconds | Saturation percentage |
|---|---|---|---|
| A | 8354 | 184 | 2.202538% |
| B | 8354 | 608 | 7.277951% |
| C | 8355 | 1027 | 12.292041% |
| D | 8355 | 450 | 5.385996% |
Noise dominated data is calculated using 1-second bins in cleaned event files. If a bin has >2000 counts, and if more than 50% of those come from <1% of pixels, then it is considered to be noise-dominated and hence unusable.
| Quadrant | # 1 sec bins | Bins with >0 counts | Bins with >2000 counts | High rate bins dominated by noise | Noise dominated (total time) | Noise dominated (detector-on time) | Marked lightcurve |
|---|---|---|---|---|---|---|---|
| A | 8806 | 8633 | 88 | 88 | 1.00% | 1.02% | 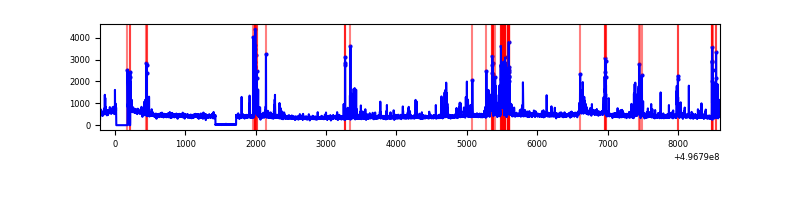 |
| B | 8806 | 8633 | 272 | 272 | 3.09% | 3.15% | 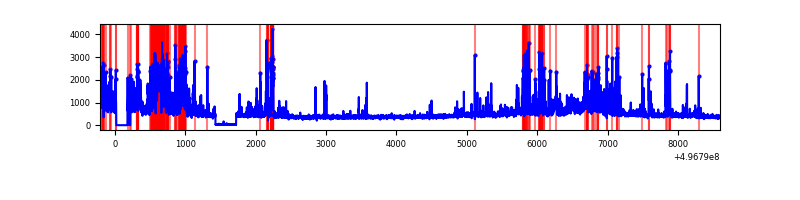 |
| C | 8807 | 8634 | 788 | 788 | 8.95% | 9.13% | 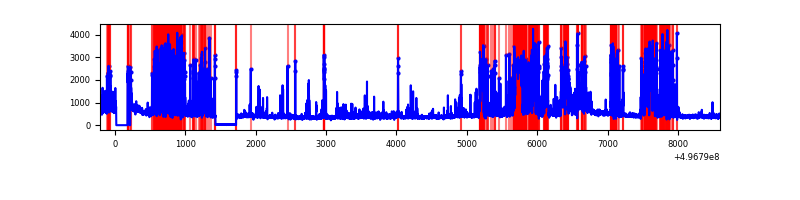 |
| D | 8807 | 8631 | 314 | 314 | 3.57% | 3.64% | 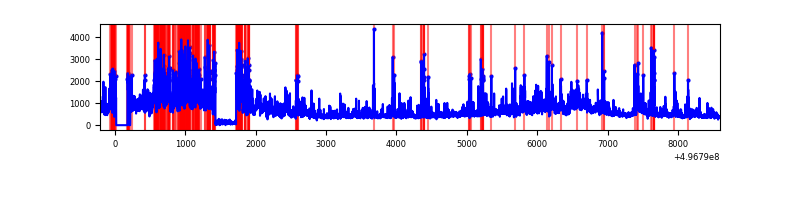 |
Top three noisy pixels from each quadrant. If the there are fewer than three noisy pixels in the level2.evt file, extra rows are filled as -1
| Pixel properties | Quadrant properties | ||||||
|---|---|---|---|---|---|---|---|
| Quadrant | DetID | PixID | Counts | Sigma | Mean | Median | Sigma |
| A | 15 | 174 | 282929 | 1303.5 | 881 | 859 | 216.4 |
| A | 0 | 8 | 218866 | 1007.45 | 881 | 859 | 216.4 |
| A | 13 | 248 | 91413 | 418.47 | 881 | 859 | 216.4 |
| B | 5 | 185 | 511961 | 2774.72 | 864 | 832 | 184.2 |
| B | 0 | 213 | 318555 | 1724.79 | 864 | 832 | 184.2 |
| B | 15 | 20 | 269367 | 1457.77 | 864 | 832 | 184.2 |
| C | 1 | 241 | 1277439 | 5605.73 | 825 | 816 | 227.7 |
| C | 15 | 147 | 1121547 | 4921.2 | 825 | 816 | 227.7 |
| C | 13 | 3 | 626299 | 2746.53 | 825 | 816 | 227.7 |
| D | 2 | 165 | 1195268 | 4903.37 | 851 | 810 | 243.6 |
| D | 2 | 172 | 505866 | 2073.31 | 851 | 810 | 243.6 |
| D | 8 | 176 | 329556 | 1349.54 | 851 | 810 | 243.6 |
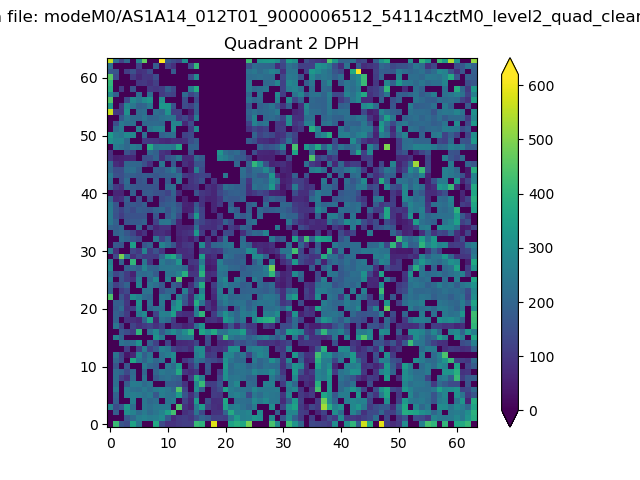
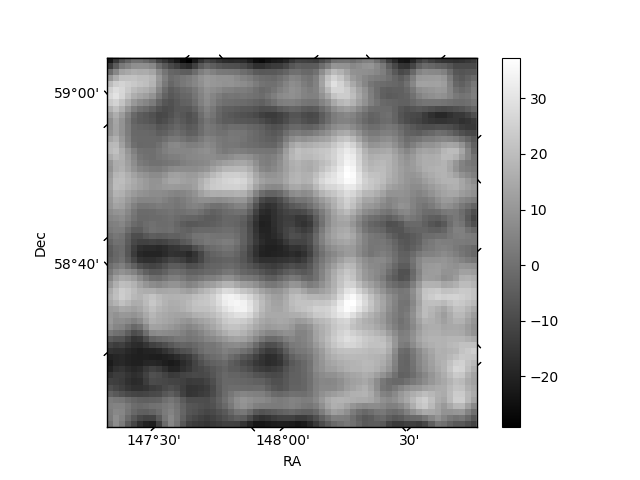
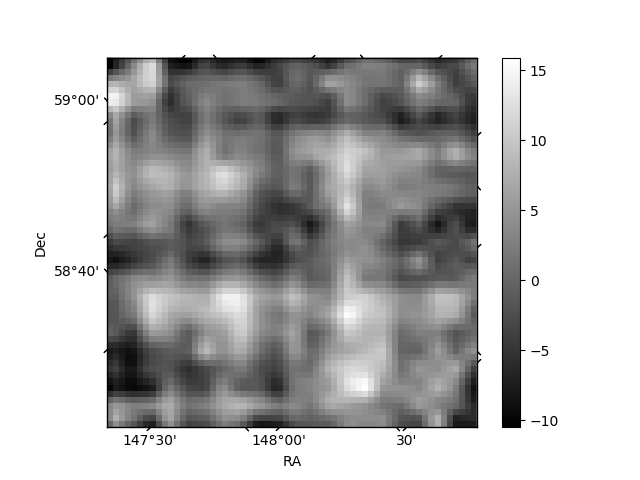
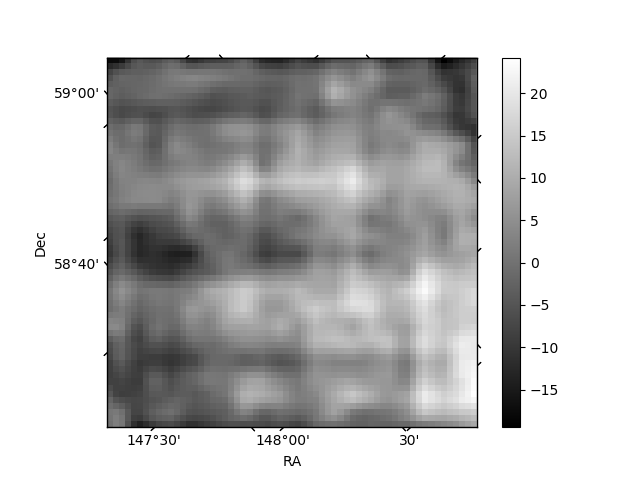
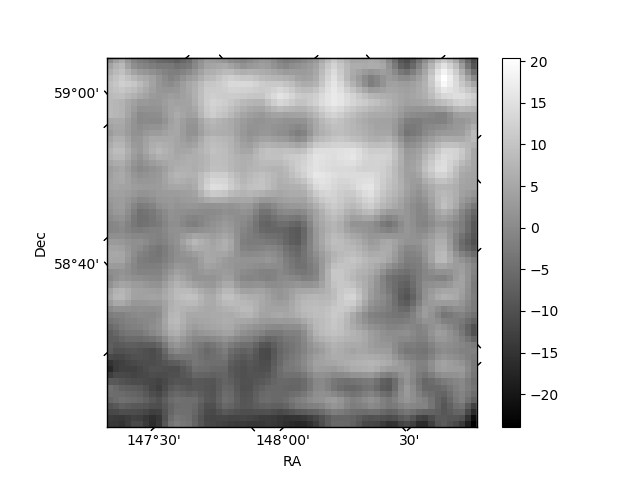
Histogram calculated using DETX and DETY for each event in the final _common_clean file
| Quadrant A | 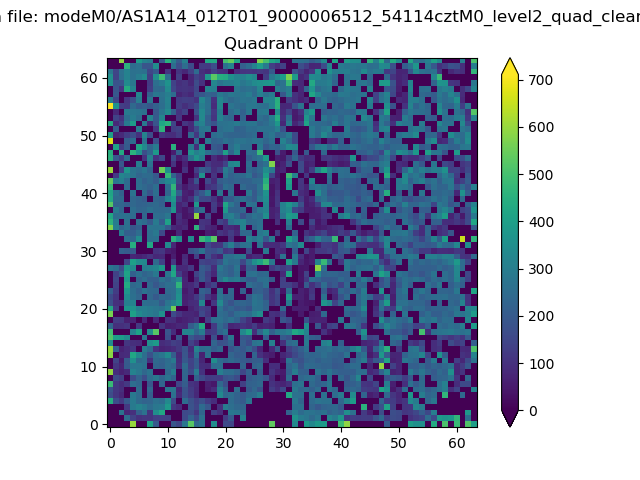 |
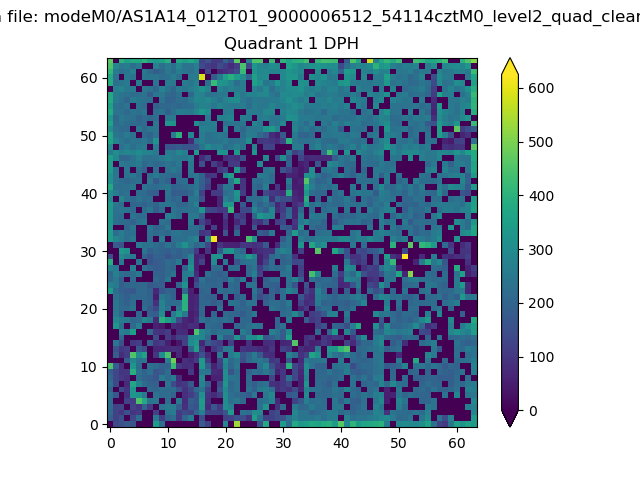 |
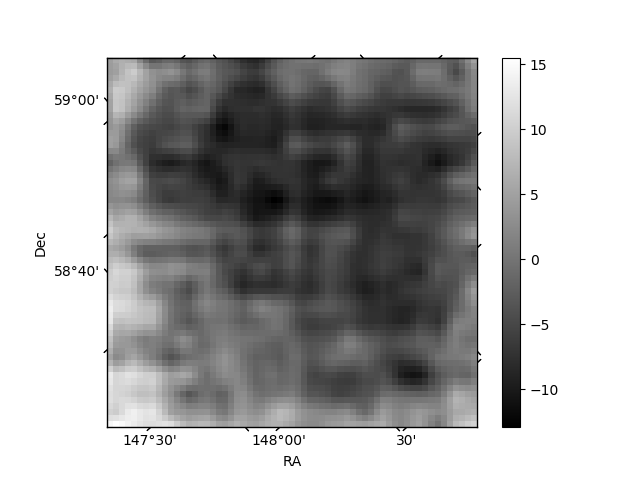
Quadrant B |
|---|---|---|---|
| Quadrant D | 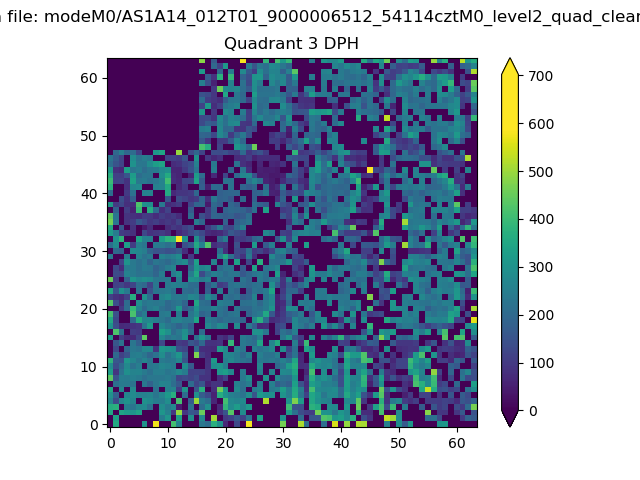 |
 |
Quadrant C |
| Plot type | Count rate plots | Images |
|---|---|---|
| Comparison with Poisson distribution Blue bars denote a histogram of data divided into 1 sec bins. Red curve is a Poisson curve with rate = median count rate of data. |
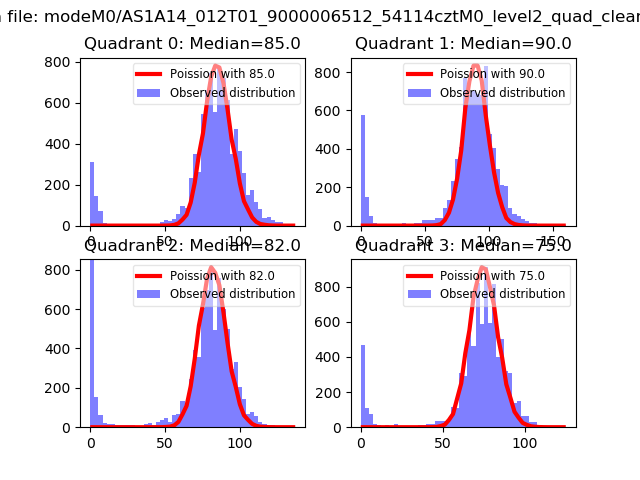 |
 |
| Quadrant-wise count rates Data is divided into 100 sec bins |
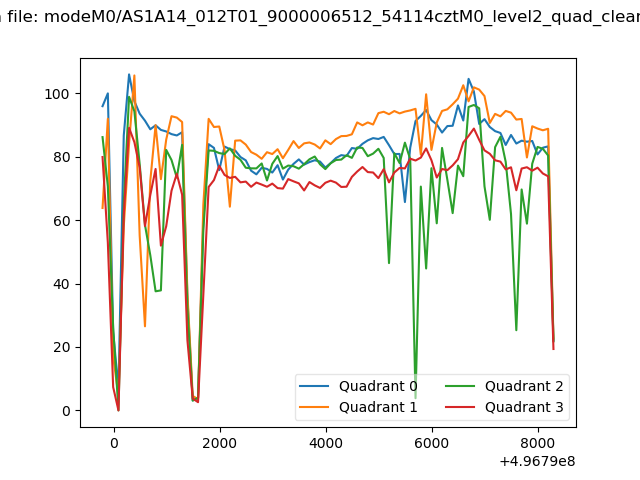 |
|
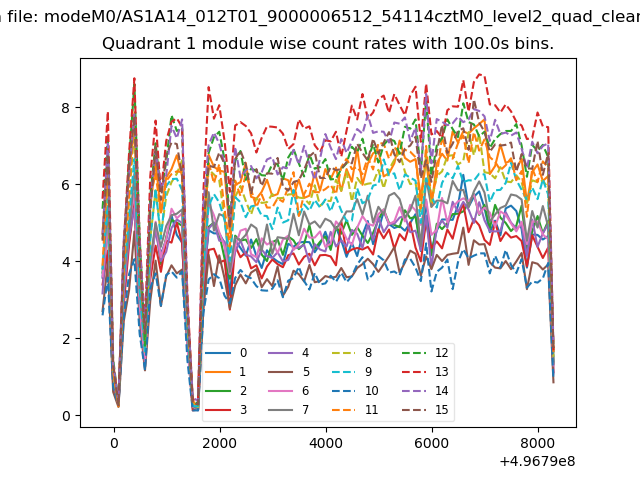
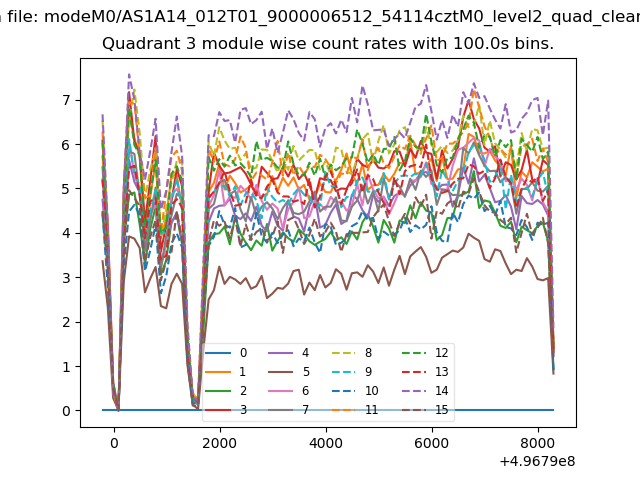
| Module-wise count rates for Quadrant A Data is divided into 100 sec bins |
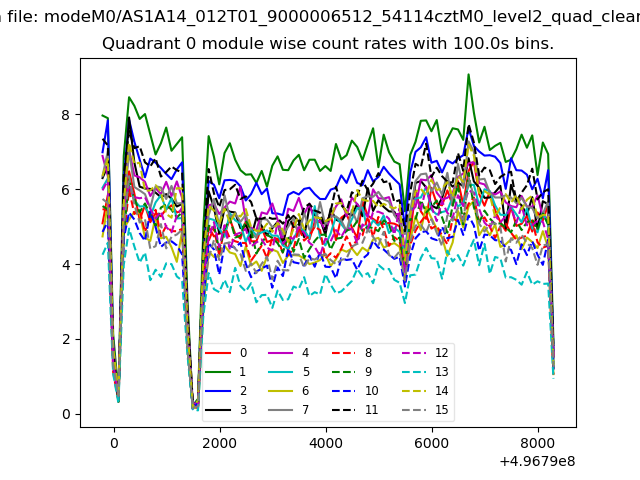 |
 |
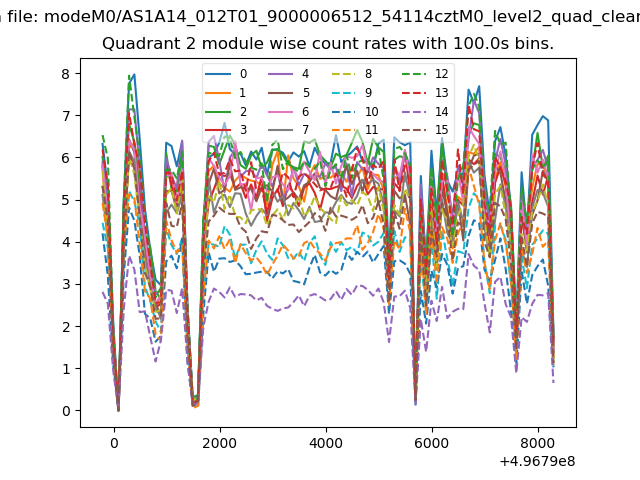
| Module-wise count rates for Quadrant B Data is divided into 100 sec bins |
 |
 |
| Module-wise count rates for Quadrant C Data is divided into 100 sec bins |
 |
 |
| Module-wise count rates for Quadrant D Data is divided into 100 sec bins |
 |
 |
| Parameter | Plot |
|---|---|
| CZT HV Monitor |  |
| D_VDD | 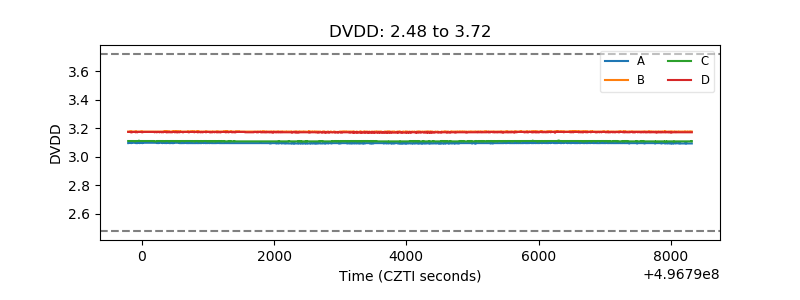 |
| Temperature 1 | 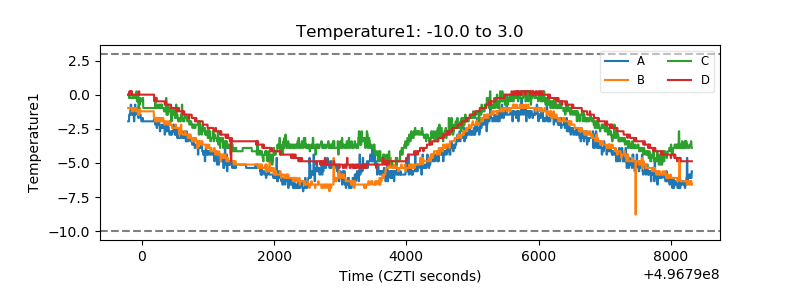 |
| Veto HV Monitor | 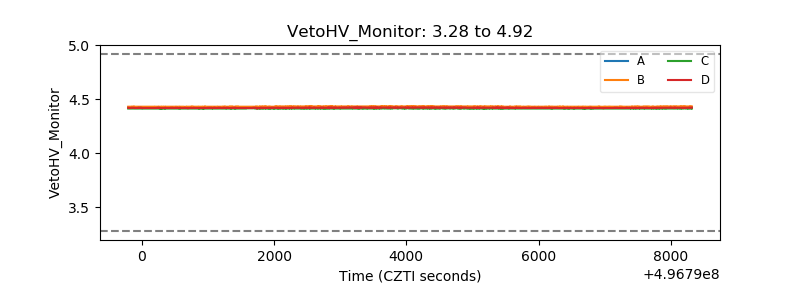 |
| Veto LLD | 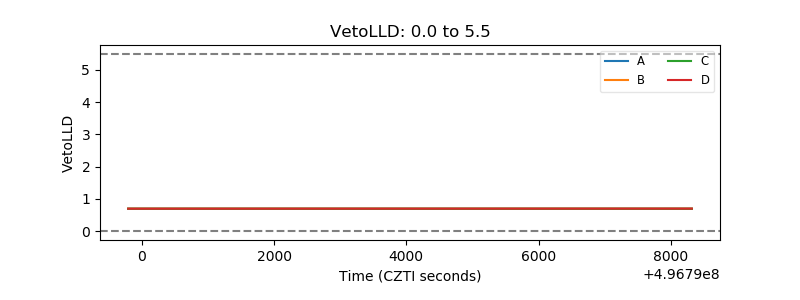 |
| Alpha Counter |  |
| _CPM_Rate | 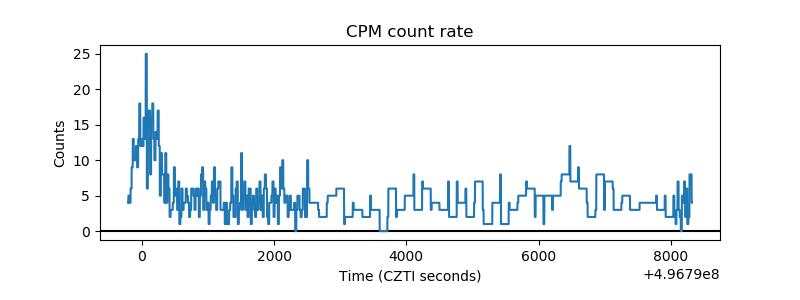 |
| CZT Counter | 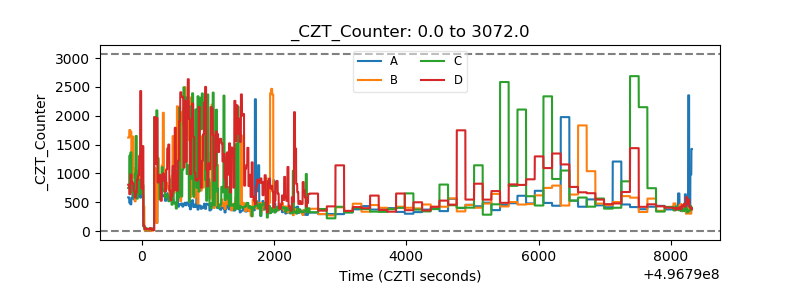 |
| +2.5 Volts monitor | 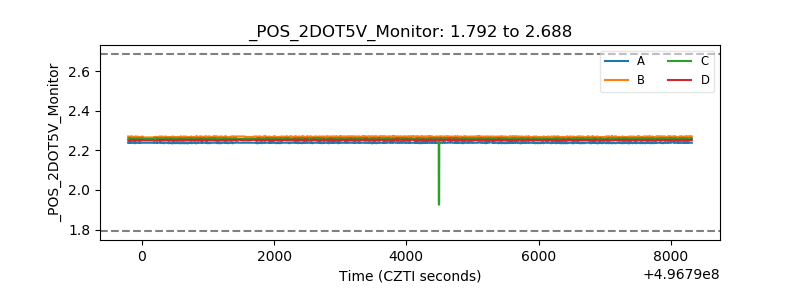 |
| +5 Volts monitor | 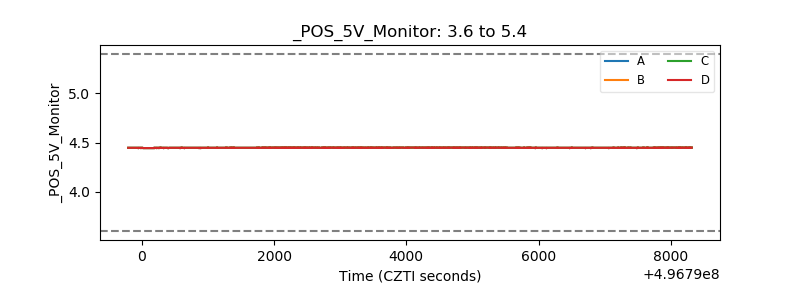 |
| _ROLL_ROT | 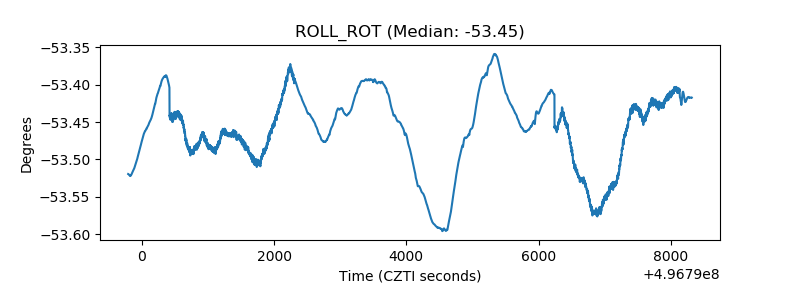 |
| _Roll_DEC | 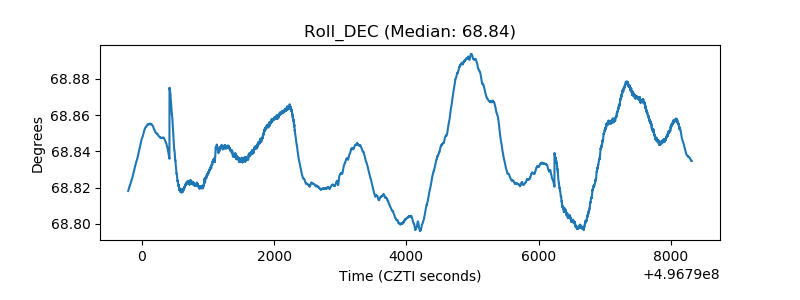 |
| _Roll_RA | 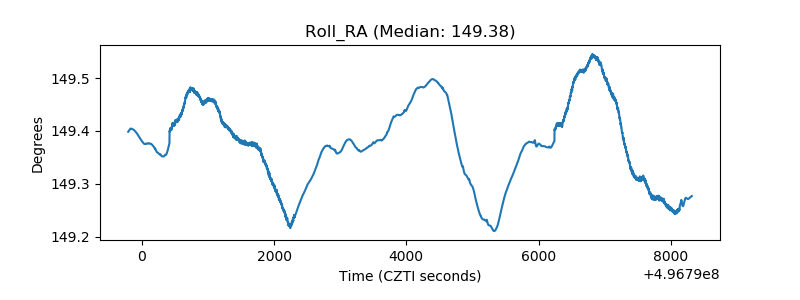 |
| Veto Counter | 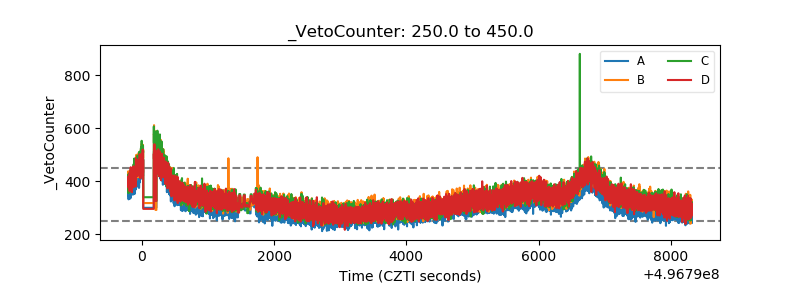 |