| Param | Original file | Final file |
|---|---|---|
| Filename | modeM0/AS1A14_012T01_9000006512_54115cztM0_level2.fits | modeM0/AS1A14_012T01_9000006512_54115cztM0_level2_quad_clean.evt |
| Size (bytes) | 537,560,640 | 109,831,680 |
| Size | 512.7 MB | 104.7 MB |
| Events in quadrant A | 4,335,360 | 718,733 |
| Events in quadrant B | 4,672,506 | 748,805 |
| Events in quadrant C | 5,323,226 | 661,396 |
| Events in quadrant D | 4,955,694 | 648,743 |
| Mode SS | |||
|---|---|---|---|
| Quadrant | BADHDUFLAG | Total packets | Discarded packets |
| A | 0 | 158 | 0 |
| B | 0 | 158 | 0 |
| C | 0 | 158 | 0 |
| D | 0 | 158 | 0 |
| Mode M0 | |||
|---|---|---|---|
| Quadrant | BADHDUFLAG | Total packets | Discarded packets |
| A | 0 | 18845 | 0 |
| B | 0 | 19876 | 0 |
| C | 0 | 21936 | 0 |
| D | 0 | 20472 | 0 |
| Quadrant | Total seconds | Saturated seconds | Saturation percentage |
|---|---|---|---|
| A | 7875 | 210 | 2.666667% |
| B | 7876 | 464 | 5.891315% |
| C | 7876 | 654 | 8.303707% |
| D | 7876 | 246 | 3.123413% |
Noise dominated data is calculated using 1-second bins in cleaned event files. If a bin has >2000 counts, and if more than 50% of those come from <1% of pixels, then it is considered to be noise-dominated and hence unusable.
| Quadrant | # 1 sec bins | Bins with >0 counts | Bins with >2000 counts | High rate bins dominated by noise | Noise dominated (total time) | Noise dominated (detector-on time) | Marked lightcurve |
|---|---|---|---|---|---|---|---|
| A | 7875 | 7875 | 163 | 163 | 2.07% | 2.07% | 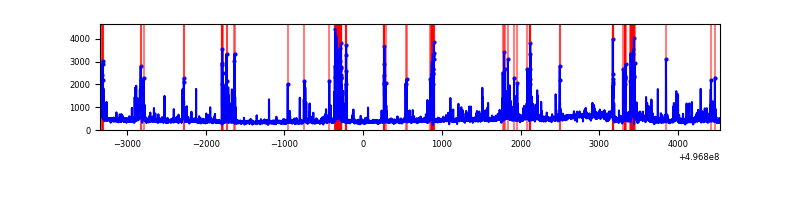 |
| B | 7876 | 7876 | 159 | 159 | 2.02% | 2.02% | 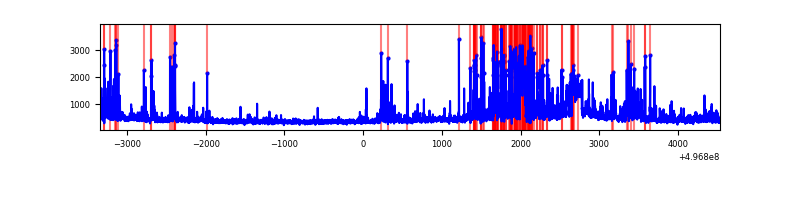 |
| C | 7876 | 7876 | 597 | 597 | 7.58% | 7.58% |  |
| D | 7876 | 7876 | 233 | 233 | 2.96% | 2.96% | 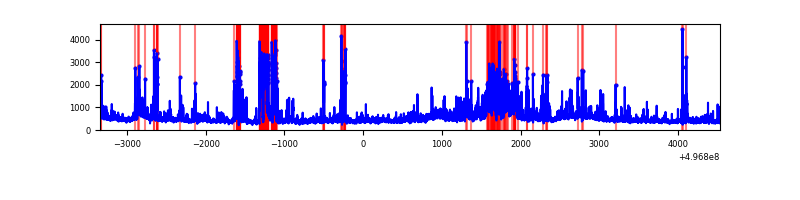 |
Top three noisy pixels from each quadrant. If the there are fewer than three noisy pixels in the level2.evt file, extra rows are filled as -1
| Pixel properties | Quadrant properties | ||||||
|---|---|---|---|---|---|---|---|
| Quadrant | DetID | PixID | Counts | Sigma | Mean | Median | Sigma |
| A | 0 | 8 | 498931 | 2466.08 | 807 | 787 | 202.0 |
| A | 13 | 248 | 204519 | 1008.58 | 807 | 787 | 202.0 |
| A | 15 | 174 | 143888 | 708.43 | 807 | 787 | 202.0 |
| B | 5 | 236 | 478329 | 2828.84 | 790 | 761 | 168.8 |
| B | 0 | 213 | 315695 | 1865.49 | 790 | 761 | 168.8 |
| B | 15 | 20 | 222418 | 1312.97 | 790 | 761 | 168.8 |
| C | 1 | 241 | 1532361 | 7243.94 | 771 | 765 | 211.4 |
| C | 13 | 3 | 454200 | 2144.59 | 771 | 765 | 211.4 |
| C | 15 | 147 | 178027 | 838.39 | 771 | 765 | 211.4 |
| D | 2 | 165 | 715885 | 3201.03 | 787 | 750 | 223.4 |
| D | 8 | 176 | 360809 | 1611.67 | 787 | 750 | 223.4 |
| D | 2 | 172 | 184692 | 823.35 | 787 | 750 | 223.4 |
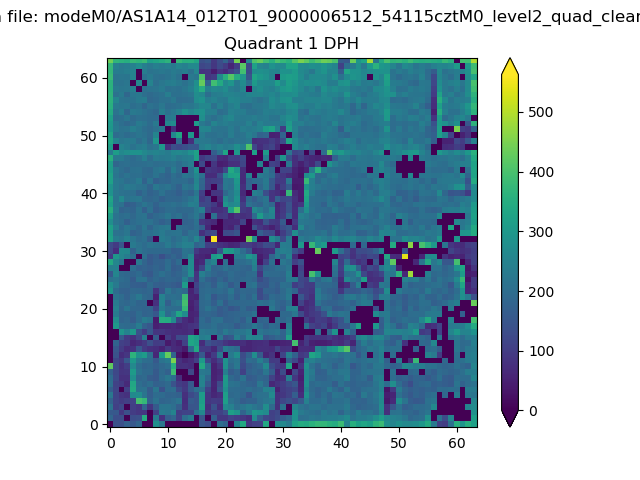
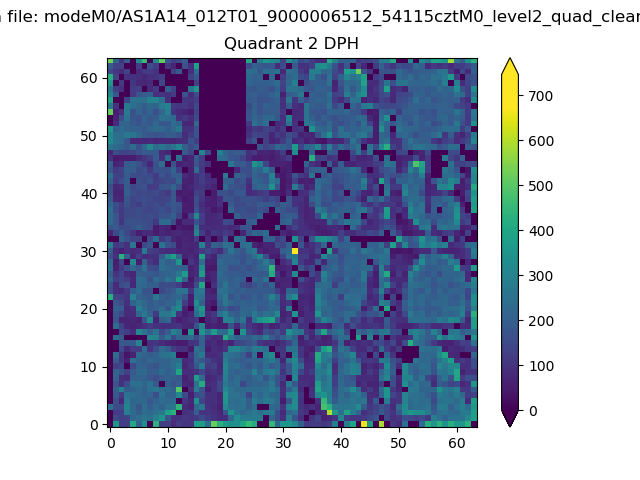
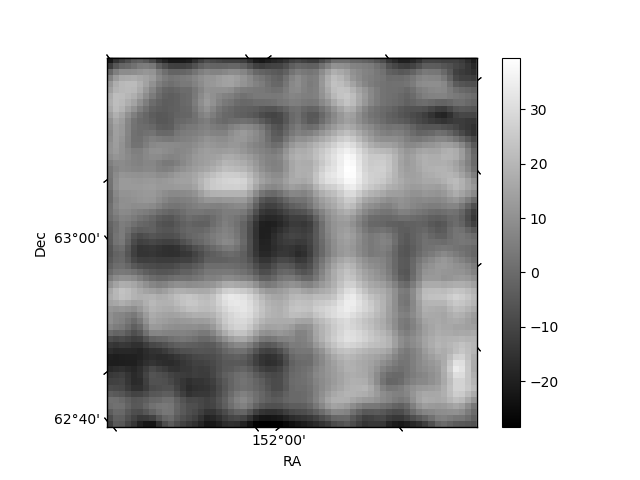
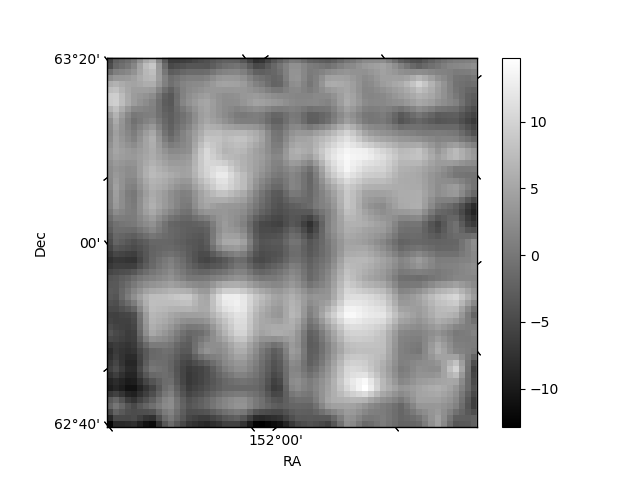
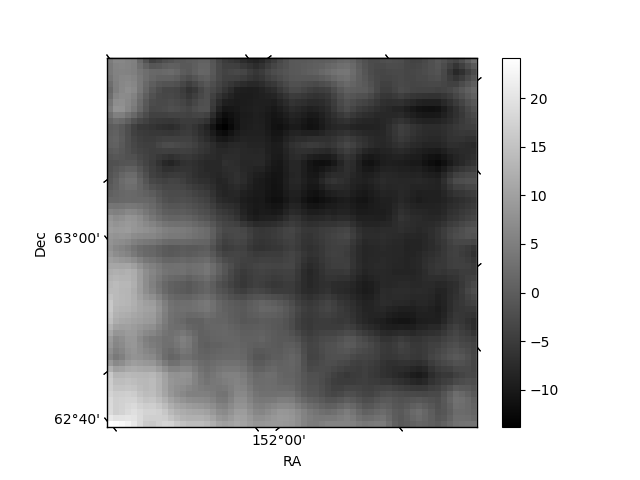
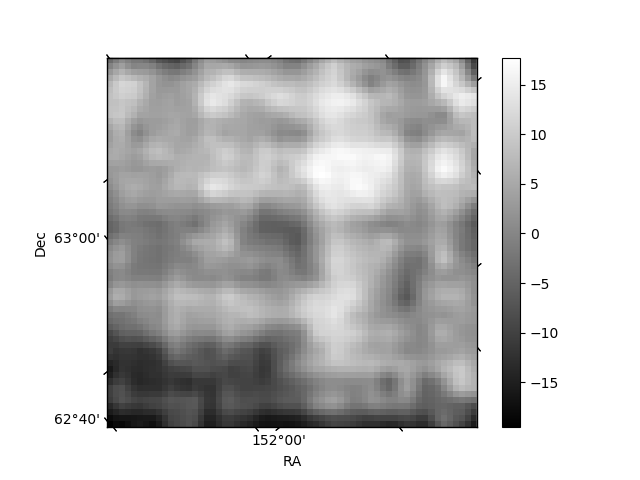
Histogram calculated using DETX and DETY for each event in the final _common_clean file
| Quadrant A | 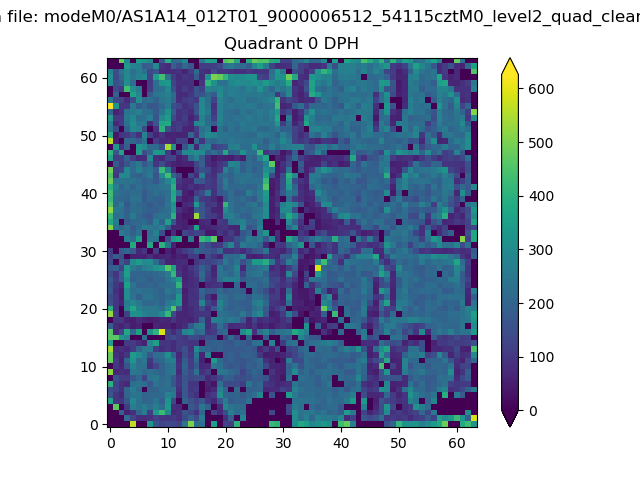 |
 |
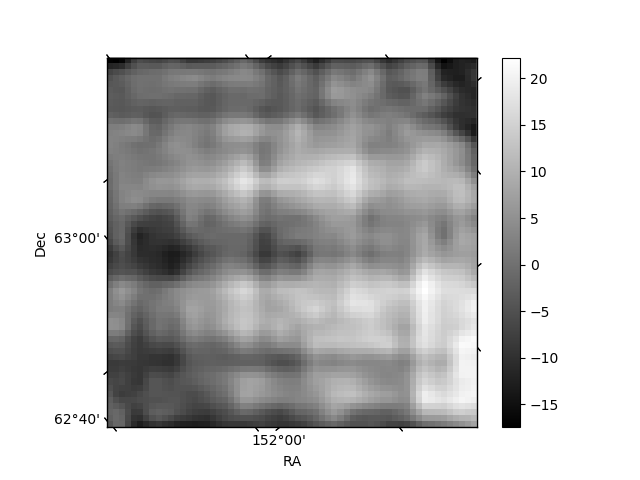
Quadrant B |
|---|---|---|---|
| Quadrant D | 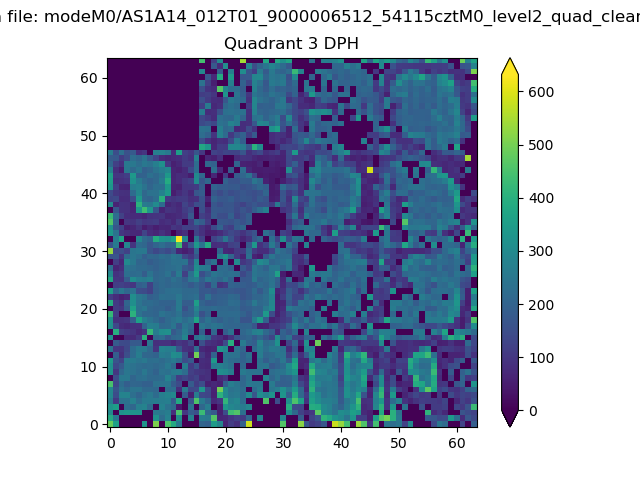 |
 |
Quadrant C |
| Plot type | Count rate plots | Images |
|---|---|---|
| Comparison with Poisson distribution Blue bars denote a histogram of data divided into 1 sec bins. Red curve is a Poisson curve with rate = median count rate of data. |
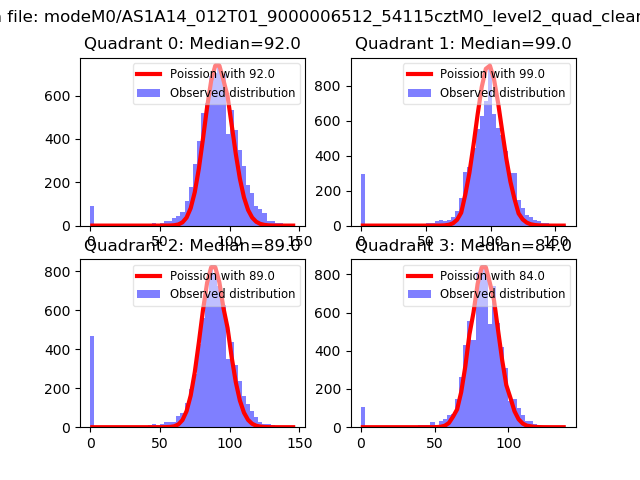 |
 |
| Quadrant-wise count rates Data is divided into 100 sec bins |
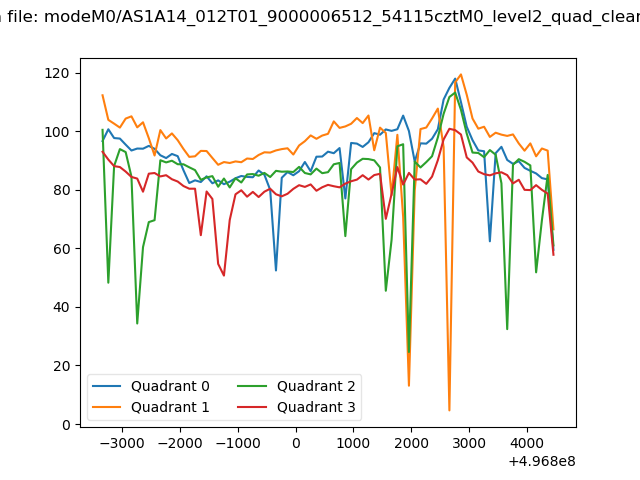 |
|
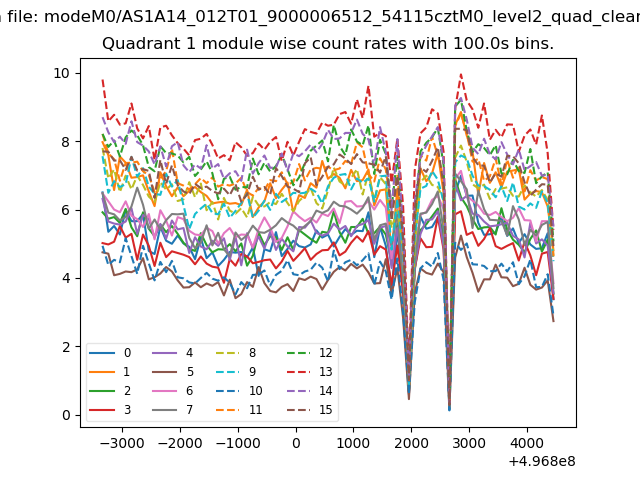
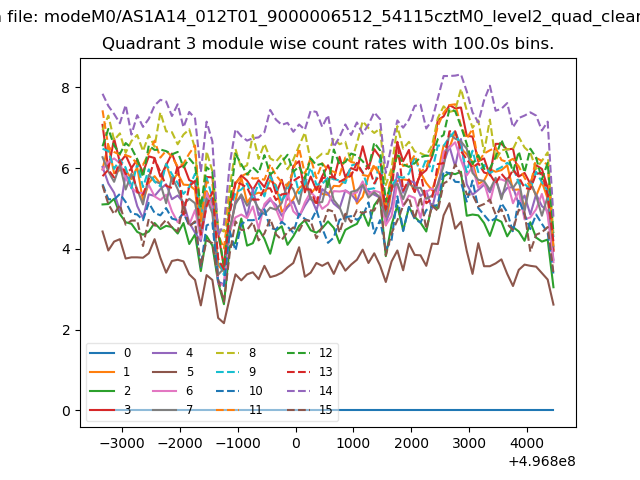
| Module-wise count rates for Quadrant A Data is divided into 100 sec bins |
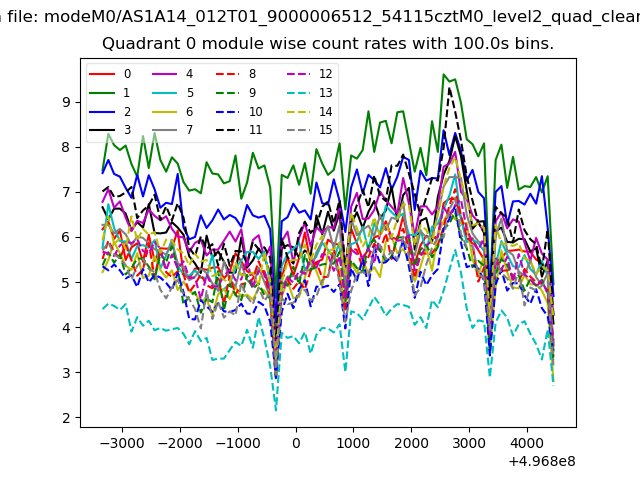 |
 |
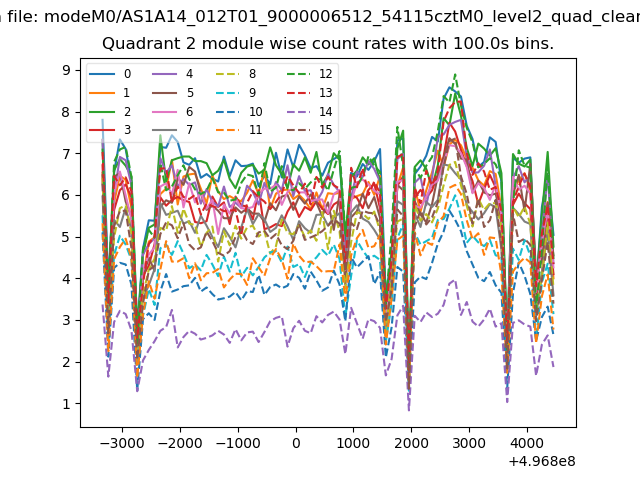
| Module-wise count rates for Quadrant B Data is divided into 100 sec bins |
 |
 |
| Module-wise count rates for Quadrant C Data is divided into 100 sec bins |
 |
 |
| Module-wise count rates for Quadrant D Data is divided into 100 sec bins |
 |
 |
| Parameter | Plot |
|---|---|
| CZT HV Monitor | 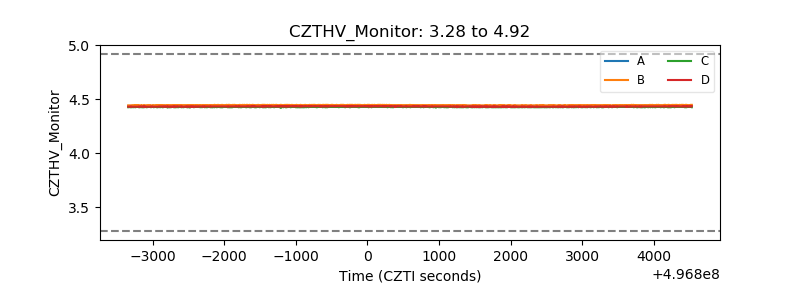 |
| D_VDD | 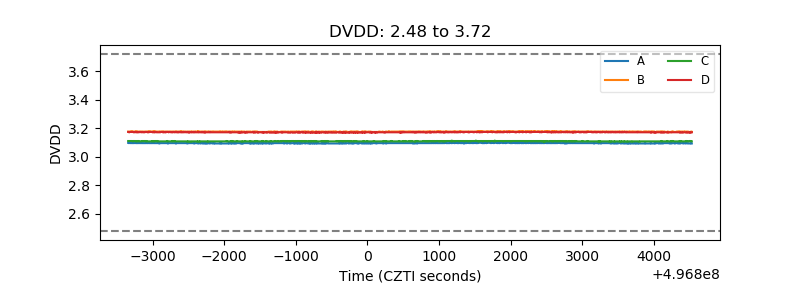 |
| Temperature 1 | 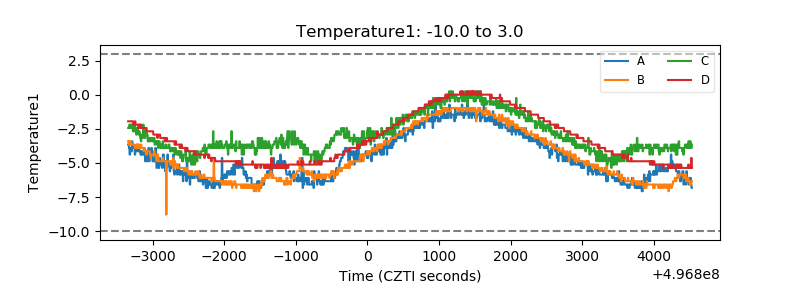 |
| Veto HV Monitor |  |
| Veto LLD | 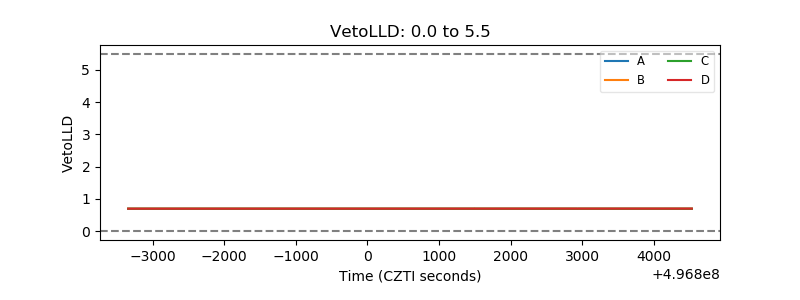 |
| Alpha Counter | 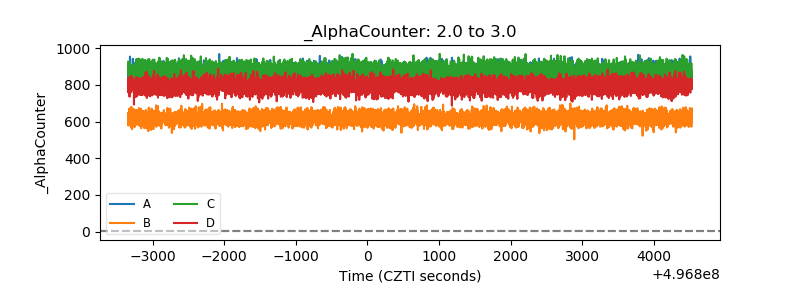 |
| _CPM_Rate | 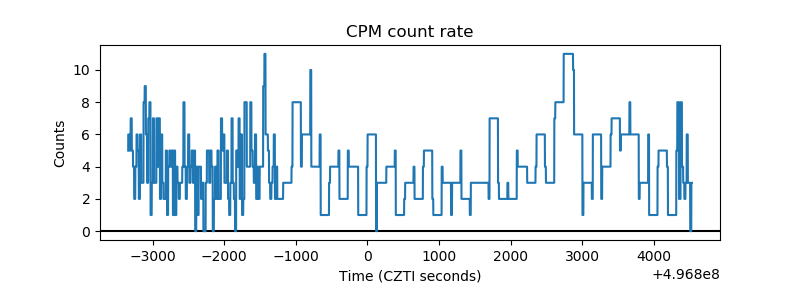 |
| CZT Counter | 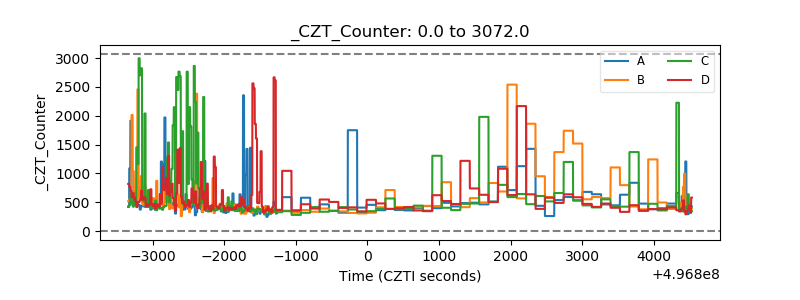 |
| +2.5 Volts monitor | 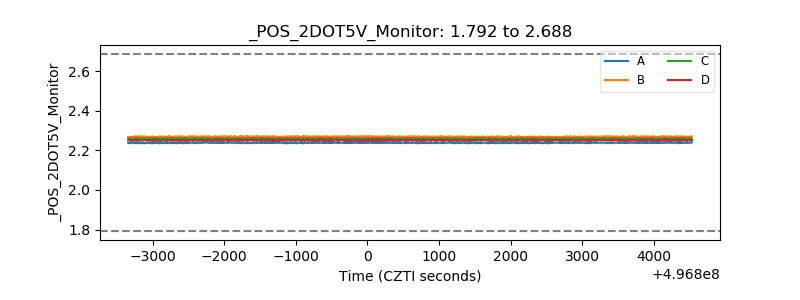 |
| +5 Volts monitor |  |
| _ROLL_ROT | 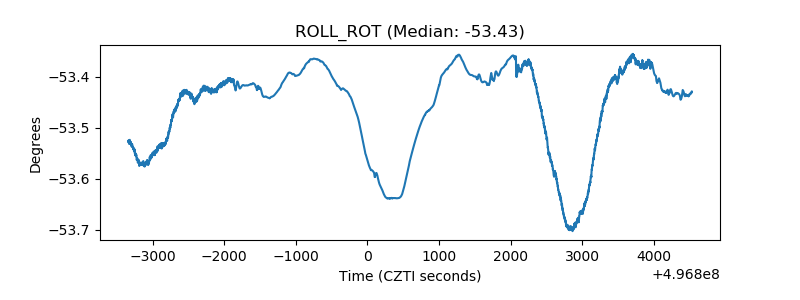 |
| _Roll_DEC | 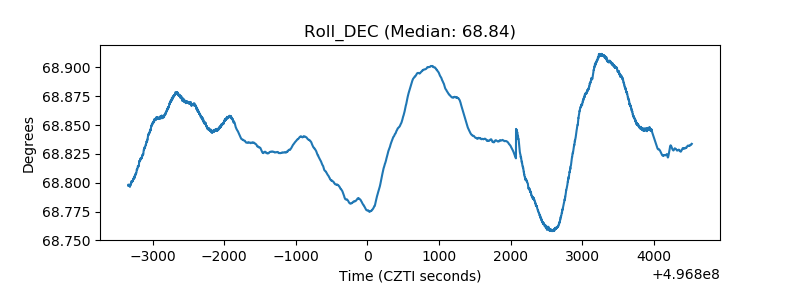 |
| _Roll_RA | 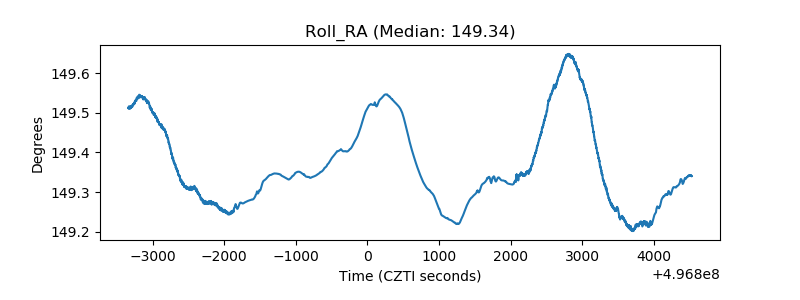 |
| Veto Counter | 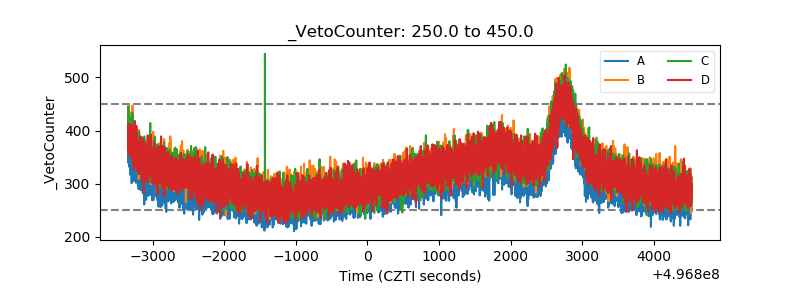 |