| Param | Original file | Final file |
|---|---|---|
| Filename | modeM0/AS1A14_012T01_9000006512_54118cztM0_level2.fits | modeM0/AS1A14_012T01_9000006512_54118cztM0_level2_quad_clean.evt |
| Size (bytes) | 1,283,731,200 | 269,400,960 |
| Size | 1.2 GB | 256.9 MB |
| Events in quadrant A | 10,194,749 | 1,762,258 |
| Events in quadrant B | 11,110,024 | 1,887,697 |
| Events in quadrant C | 11,696,434 | 1,638,200 |
| Events in quadrant D | 13,006,676 | 1,523,379 |
| Mode SS | |||
|---|---|---|---|
| Quadrant | BADHDUFLAG | Total packets | Discarded packets |
| A | 0 | 396 | 0 |
| B | 0 | 396 | 0 |
| C | 0 | 396 | 0 |
| D | 0 | 396 | 0 |
| Mode M0 | |||
|---|---|---|---|
| Quadrant | BADHDUFLAG | Total packets | Discarded packets |
| A | 0 | 45156 | 3 |
| B | 0 | 47297 | 3 |
| C | 0 | 49509 | 3 |
| D | 0 | 53144 | 3 |
| Mode M9 | |||
|---|---|---|---|
| Quadrant | BADHDUFLAG | Total packets | Discarded packets |
| A | 0 | 12 | 0 |
| B | 0 | 12 | 0 |
| C | 0 | 12 | 0 |
| D | 0 | 12 | 0 |
| Quadrant | Total seconds | Saturated seconds | Saturation percentage |
|---|---|---|---|
| A | 19523 | 447 | 2.289607% |
| B | 19524 | 583 | 2.986068% |
| C | 19524 | 989 | 5.065560% |
| D | 19524 | 1035 | 5.301168% |
Noise dominated data is calculated using 1-second bins in cleaned event files. If a bin has >2000 counts, and if more than 50% of those come from <1% of pixels, then it is considered to be noise-dominated and hence unusable.
| Quadrant | # 1 sec bins | Bins with >0 counts | Bins with >2000 counts | High rate bins dominated by noise | Noise dominated (total time) | Noise dominated (detector-on time) | Marked lightcurve |
|---|---|---|---|---|---|---|---|
| A | 20713 | 19525 | 261 | 261 | 1.26% | 1.34% | 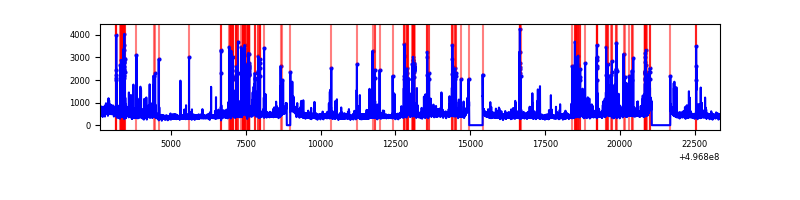 |
| B | 20714 | 19527 | 169 | 169 | 0.82% | 0.87% | 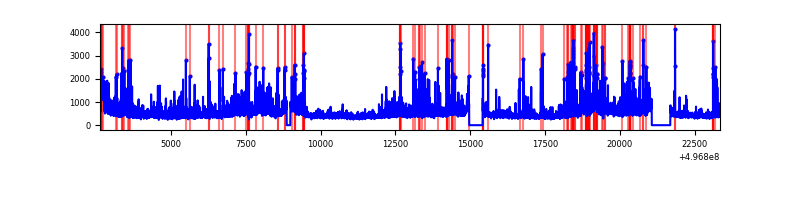 |
| C | 20714 | 19527 | 811 | 811 | 3.92% | 4.15% | 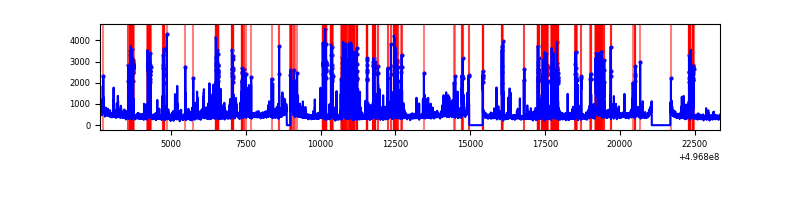 |
| D | 20714 | 19526 | 882 | 882 | 4.26% | 4.52% | 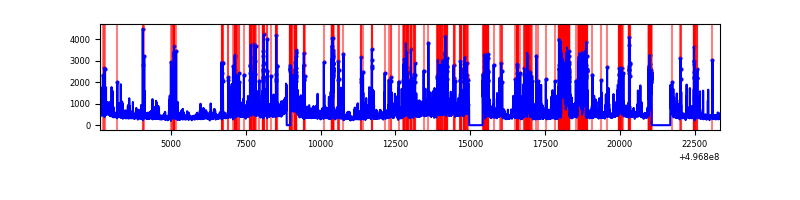 |
Top three noisy pixels from each quadrant. If the there are fewer than three noisy pixels in the level2.evt file, extra rows are filled as -1
| Pixel properties | Quadrant properties | ||||||
|---|---|---|---|---|---|---|---|
| Quadrant | DetID | PixID | Counts | Sigma | Mean | Median | Sigma |
| A | 15 | 174 | 610977 | 1226.62 | 2028 | 1980 | 496.5 |
| A | 0 | 8 | 433078 | 868.3 | 2028 | 1980 | 496.5 |
| A | 3 | 130 | 401816 | 805.33 | 2028 | 1980 | 496.5 |
| B | 5 | 236 | 576423 | 1343.11 | 2016 | 1942 | 427.7 |
| B | 15 | 20 | 552909 | 1288.13 | 2016 | 1942 | 427.7 |
| B | 4 | 81 | 343451 | 798.43 | 2016 | 1942 | 427.7 |
| C | 1 | 241 | 2233540 | 4170.37 | 1949 | 1930 | 535.1 |
| C | 13 | 3 | 949196 | 1770.23 | 1949 | 1930 | 535.1 |
| C | 15 | 233 | 196612 | 363.82 | 1949 | 1930 | 535.1 |
| D | 8 | 176 | 2150007 | 3915.46 | 1927 | 1847 | 548.6 |
| D | 2 | 165 | 1533354 | 2791.48 | 1927 | 1847 | 548.6 |
| D | 2 | 120 | 563451 | 1023.64 | 1927 | 1847 | 548.6 |
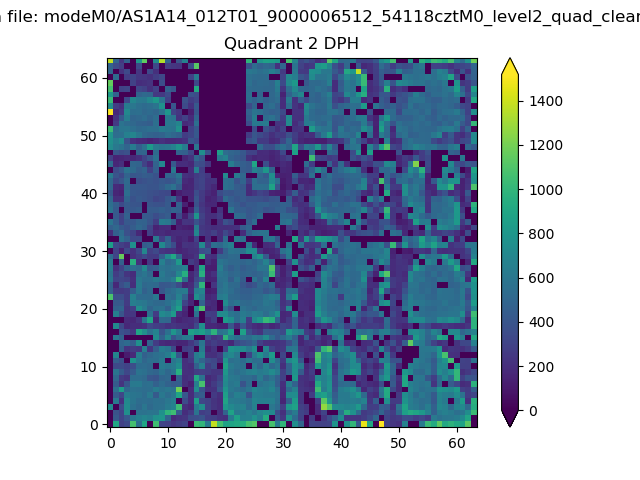
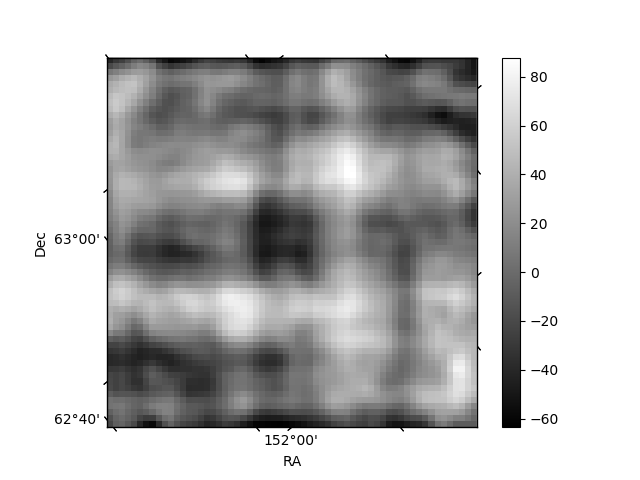
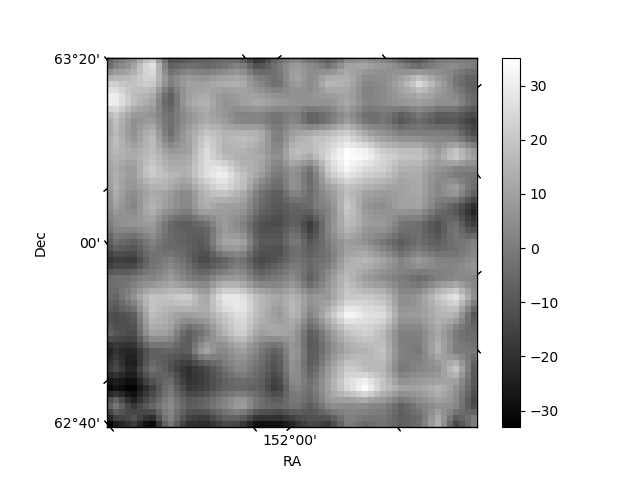
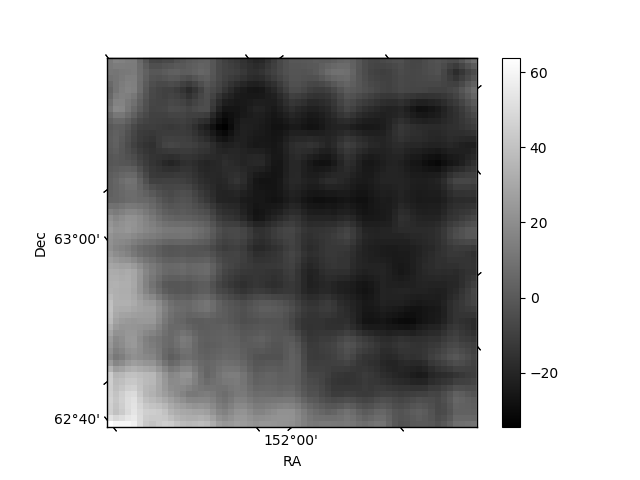
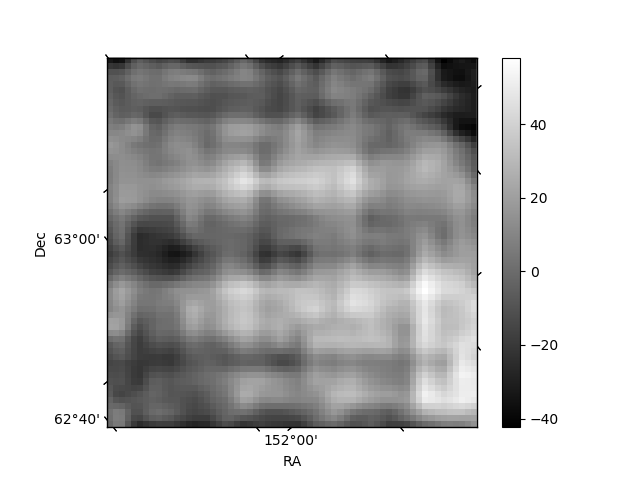
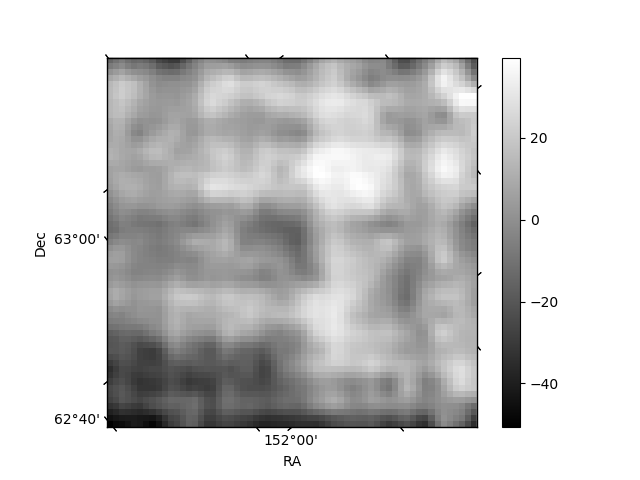
Histogram calculated using DETX and DETY for each event in the final _common_clean file
| Quadrant A | 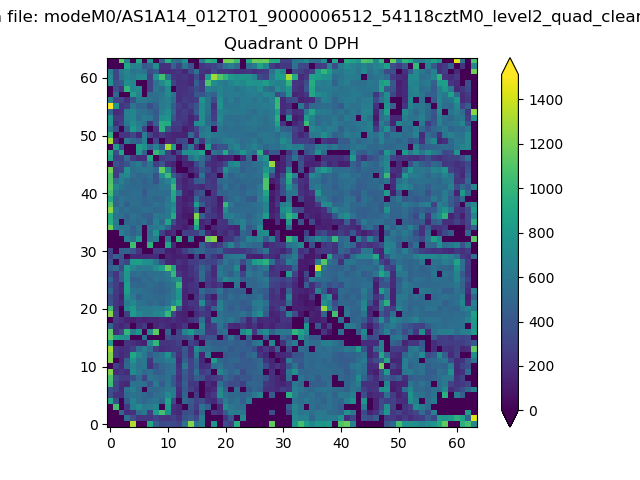 |
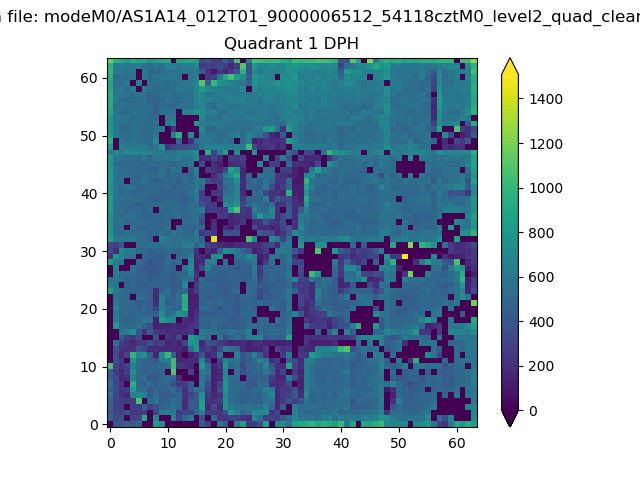 |
Quadrant B |
|---|---|---|---|
| Quadrant D | 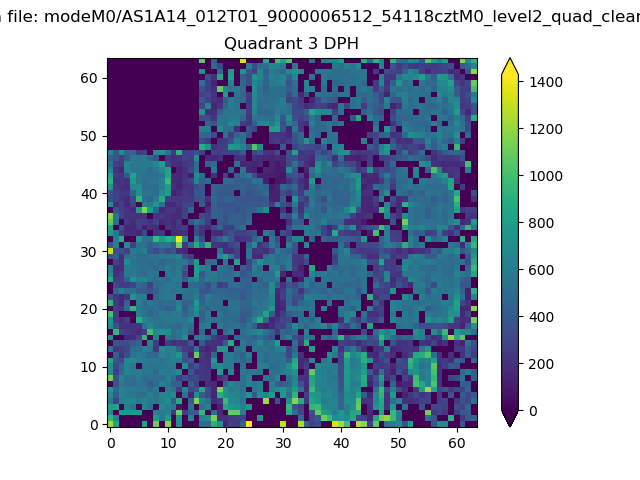 |
 |
Quadrant C |
| Plot type | Count rate plots | Images |
|---|---|---|
| Comparison with Poisson distribution Blue bars denote a histogram of data divided into 1 sec bins. Red curve is a Poisson curve with rate = median count rate of data. |
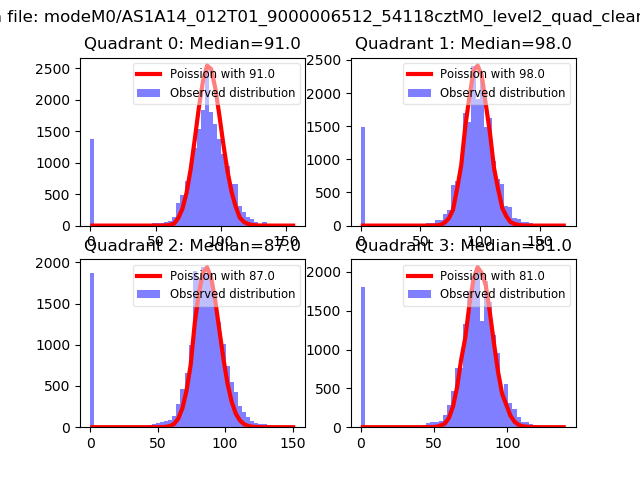 |
 |
| Quadrant-wise count rates Data is divided into 100 sec bins |
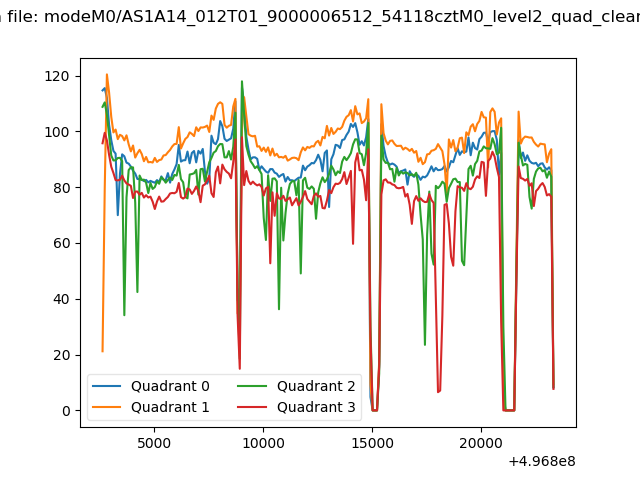 |
|
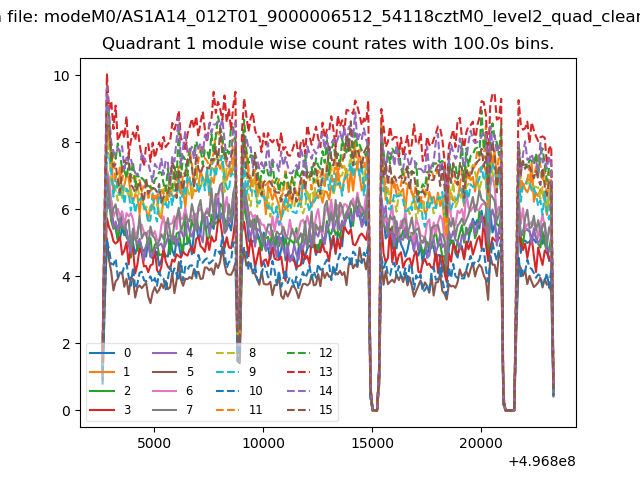
| Module-wise count rates for Quadrant A Data is divided into 100 sec bins |
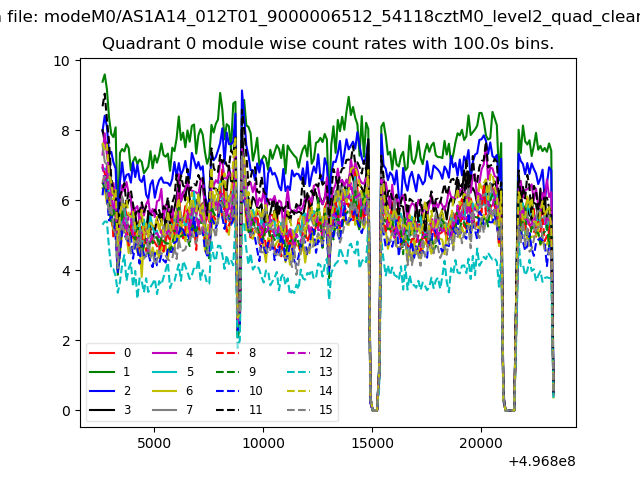 |
 |
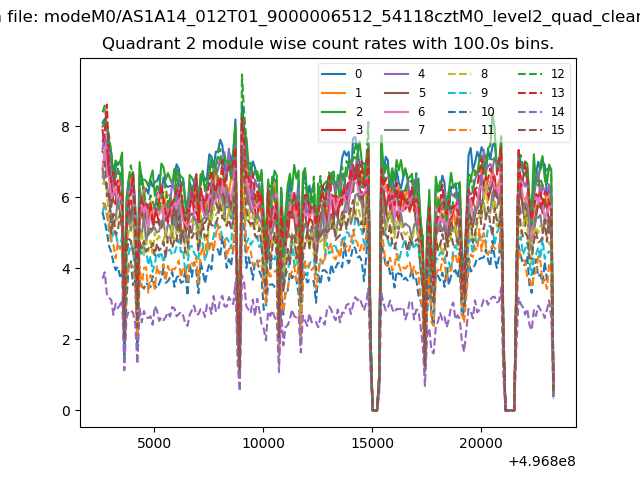
| Module-wise count rates for Quadrant B Data is divided into 100 sec bins |
 |
 |
| Module-wise count rates for Quadrant C Data is divided into 100 sec bins |
 |
 |
| Module-wise count rates for Quadrant D Data is divided into 100 sec bins |
 |
 |
| Parameter | Plot |
|---|---|
| CZT HV Monitor |  |
| D_VDD | 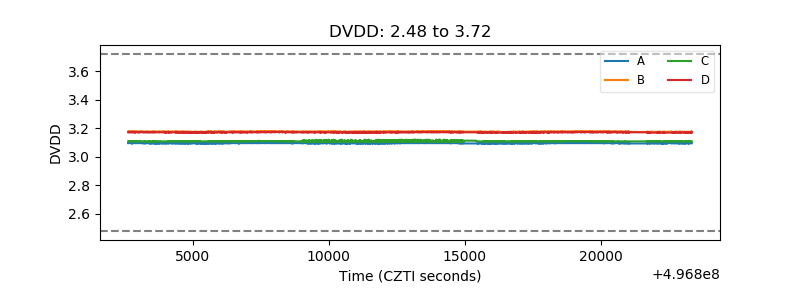 |
| Temperature 1 | 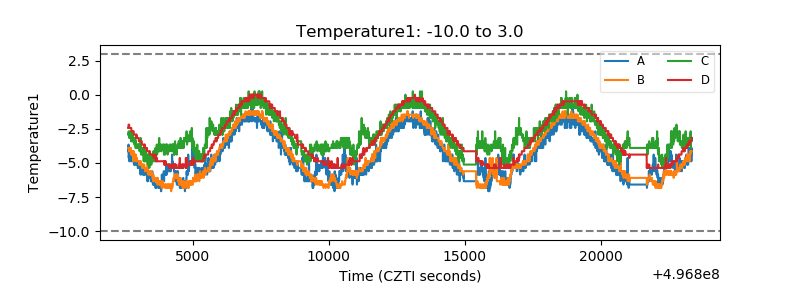 |
| Veto HV Monitor | 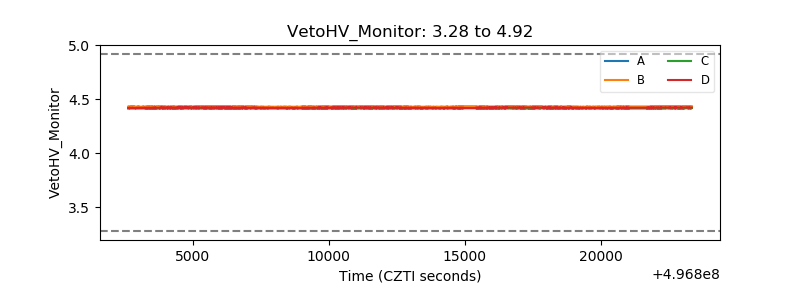 |
| Veto LLD | 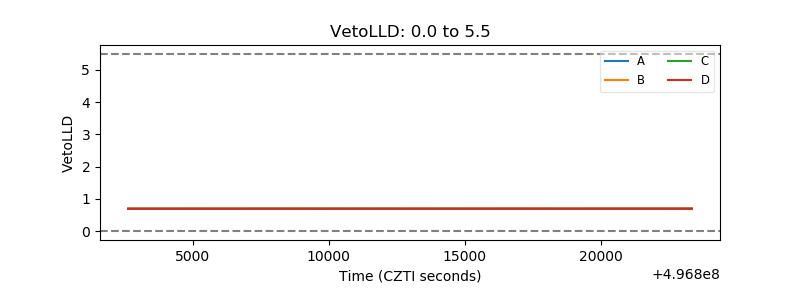 |
| Alpha Counter | 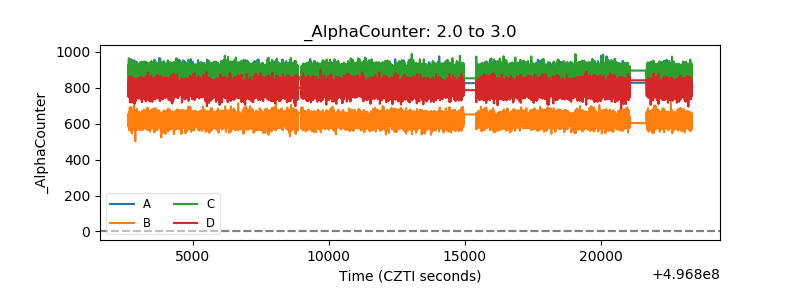 |
| _CPM_Rate | 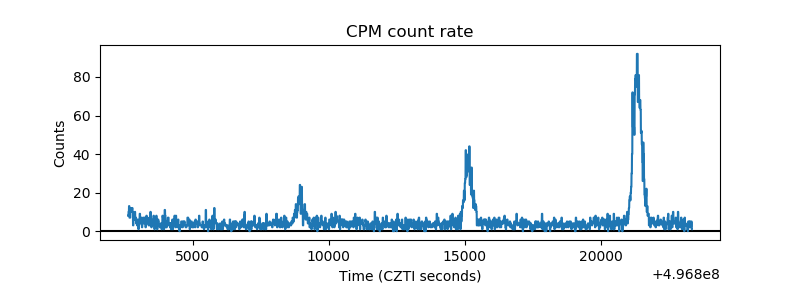 |
| CZT Counter | 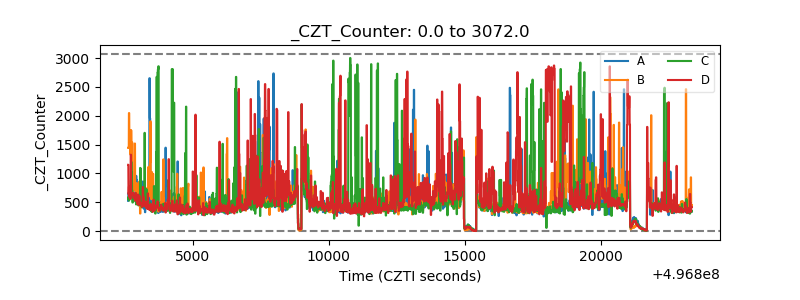 |
| +2.5 Volts monitor |  |
| +5 Volts monitor |  |
| _ROLL_ROT | 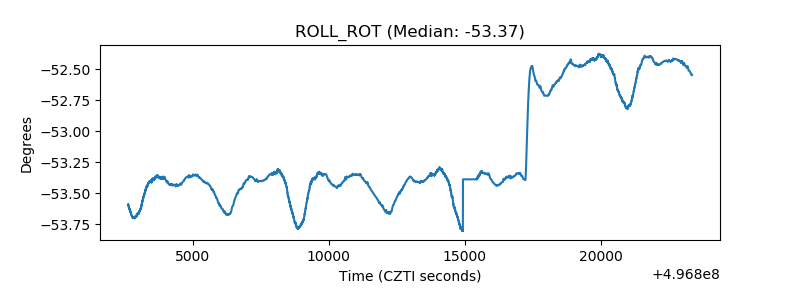 |
| _Roll_DEC | 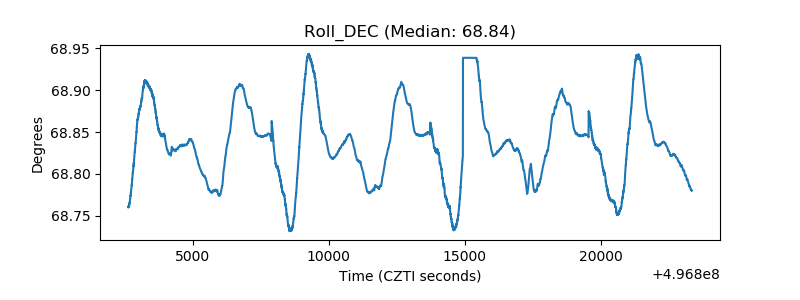 |
| _Roll_RA | 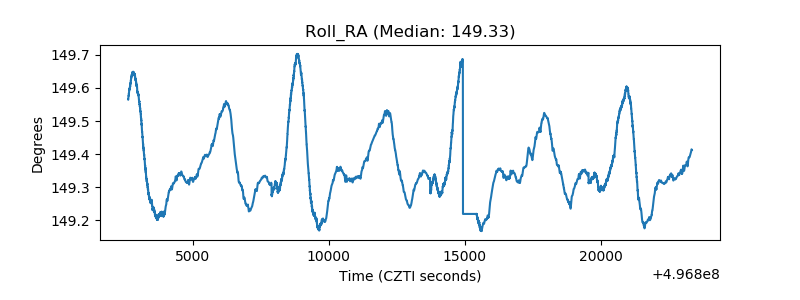 |
| Veto Counter | 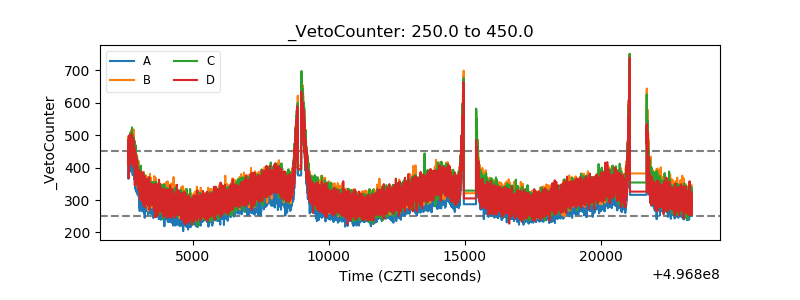 |