| Param | Original file | Final file |
|---|---|---|
| Filename | modeM0/AS1A14_012T01_9000006512_54119cztM0_level2.fits | modeM0/AS1A14_012T01_9000006512_54119cztM0_level2_quad_clean.evt |
| Size (bytes) | 409,066,560 | 89,130,240 |
| Size | 390.1 MB | 85.0 MB |
| Events in quadrant A | 3,195,753 | 577,176 |
| Events in quadrant B | 4,064,577 | 617,284 |
| Events in quadrant C | 2,692,017 | 563,924 |
| Events in quadrant D | 4,694,785 | 496,510 |
| Mode SS | |||
|---|---|---|---|
| Quadrant | BADHDUFLAG | Total packets | Discarded packets |
| A | 0 | 128 | 0 |
| B | 0 | 128 | 0 |
| C | 0 | 128 | 0 |
| D | 0 | 128 | 0 |
| Mode M0 | |||
|---|---|---|---|
| Quadrant | BADHDUFLAG | Total packets | Discarded packets |
| A | 0 | 14180 | 1 |
| B | 0 | 16598 | 1 |
| C | 0 | 13252 | 1 |
| D | 0 | 18698 | 1 |
| Mode M9 | |||
|---|---|---|---|
| Quadrant | BADHDUFLAG | Total packets | Discarded packets |
| A | 0 | 8 | 0 |
| B | 0 | 8 | 0 |
| C | 0 | 8 | 0 |
| D | 0 | 8 | 0 |
| Quadrant | Total seconds | Saturated seconds | Saturation percentage |
|---|---|---|---|
| A | 6362 | 142 | 2.232003% |
| B | 6362 | 267 | 4.196793% |
| C | 6362 | 54 | 0.848790% |
| D | 6362 | 427 | 6.711726% |
Noise dominated data is calculated using 1-second bins in cleaned event files. If a bin has >2000 counts, and if more than 50% of those come from <1% of pixels, then it is considered to be noise-dominated and hence unusable.
| Quadrant | # 1 sec bins | Bins with >0 counts | Bins with >2000 counts | High rate bins dominated by noise | Noise dominated (total time) | Noise dominated (detector-on time) | Marked lightcurve |
|---|---|---|---|---|---|---|---|
| A | 7177 | 6362 | 86 | 86 | 1.20% | 1.35% | 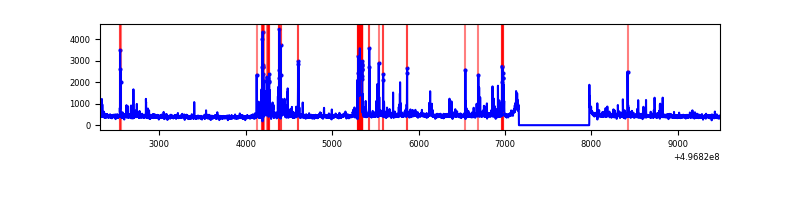 |
| B | 7177 | 6362 | 150 | 150 | 2.09% | 2.36% | 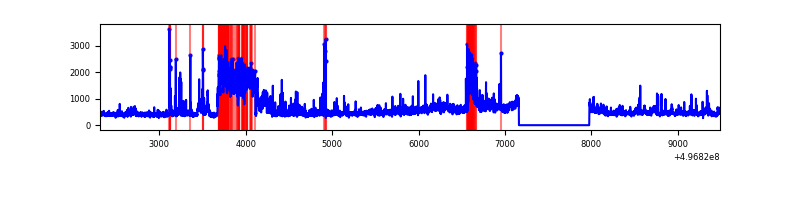 |
| C | 7177 | 6363 | 34 | 34 | 0.47% | 0.53% |  |
| D | 7177 | 6362 | 411 | 411 | 5.73% | 6.46% | 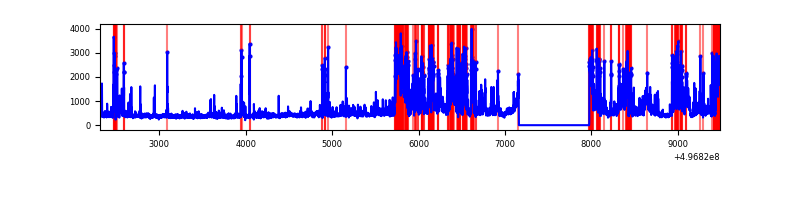 |
Top three noisy pixels from each quadrant. If the there are fewer than three noisy pixels in the level2.evt file, extra rows are filled as -1
| Pixel properties | Quadrant properties | ||||||
|---|---|---|---|---|---|---|---|
| Quadrant | DetID | PixID | Counts | Sigma | Mean | Median | Sigma |
| A | 15 | 174 | 180497 | 1123.16 | 649 | 633 | 160.1 |
| A | 0 | 8 | 142030 | 882.96 | 649 | 633 | 160.1 |
| A | 3 | 130 | 75421 | 467.01 | 649 | 633 | 160.1 |
| B | 4 | 81 | 678990 | 4908.06 | 641 | 618 | 138.2 |
| B | 14 | 167 | 236172 | 1704.25 | 641 | 618 | 138.2 |
| B | 5 | 236 | 148710 | 1071.45 | 641 | 618 | 138.2 |
| C | 13 | 3 | 115938 | 654.28 | 631 | 624 | 176.2 |
| C | 12 | 252 | 27075 | 150.08 | 631 | 624 | 176.2 |
| C | 14 | 254 | 18933 | 103.88 | 631 | 624 | 176.2 |
| D | 7 | 70 | 1025958 | 5855.95 | 612 | 584 | 175.1 |
| D | 2 | 165 | 560829 | 3199.58 | 612 | 584 | 175.1 |
| D | 2 | 120 | 110340 | 626.82 | 612 | 584 | 175.1 |
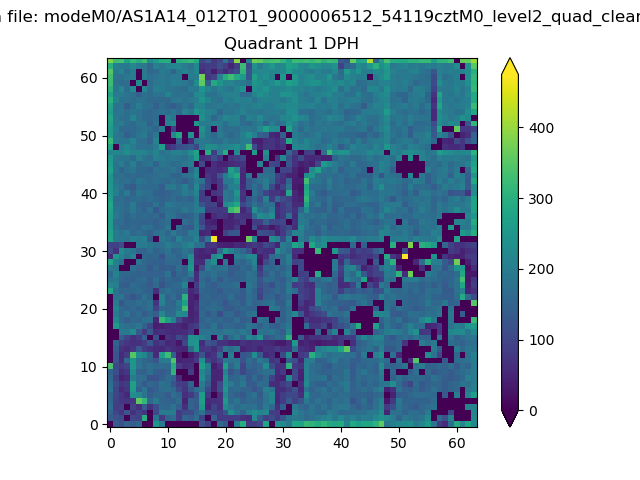
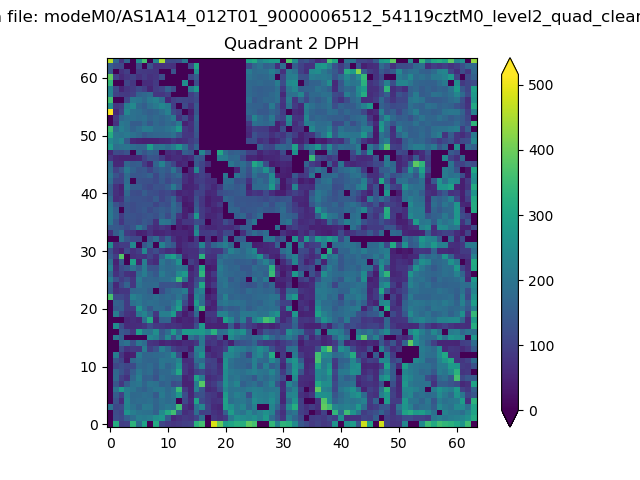
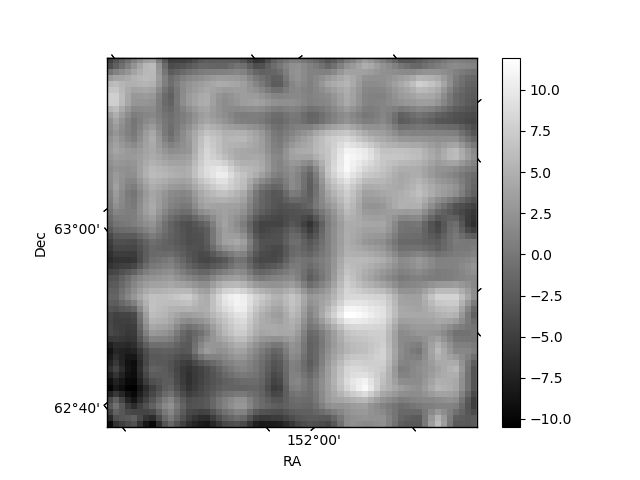
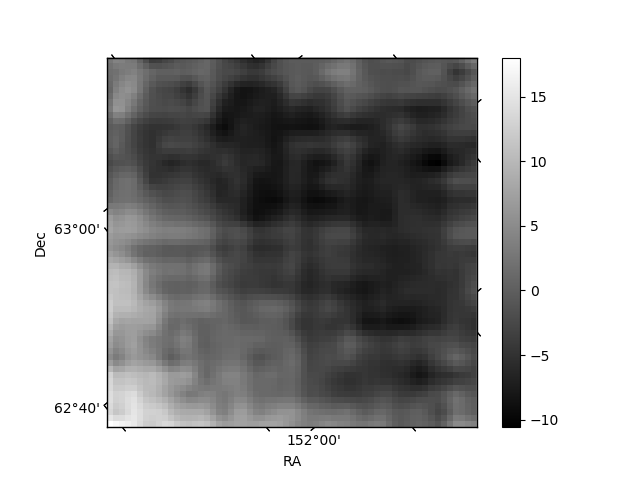
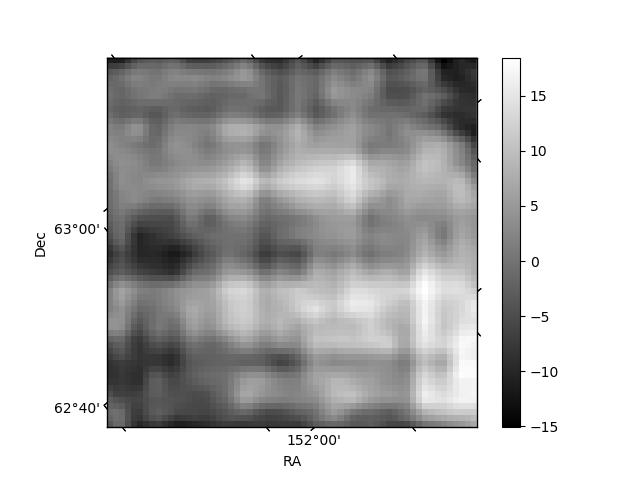
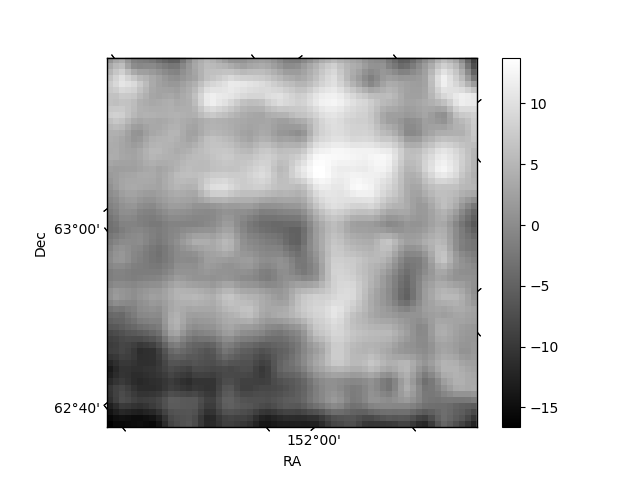
Histogram calculated using DETX and DETY for each event in the final _common_clean file
| Quadrant A | 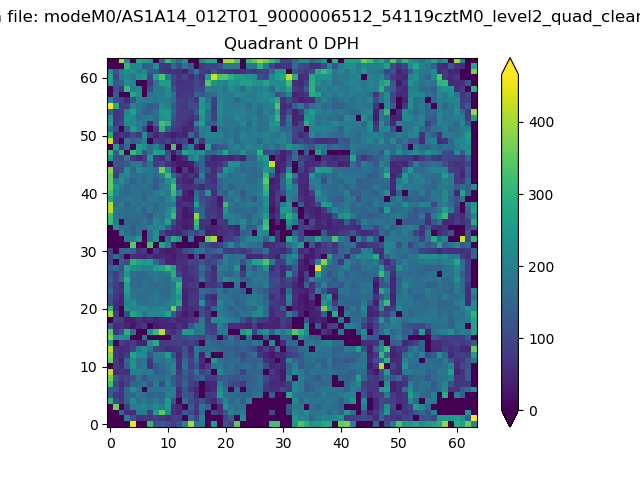 |
 |
Quadrant B |
|---|---|---|---|
| Quadrant D | 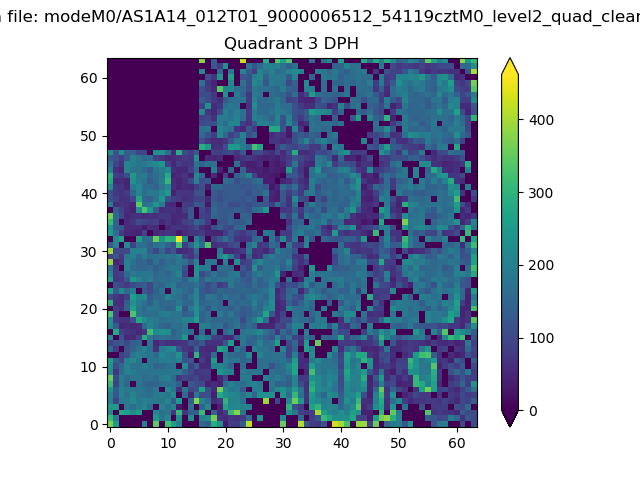 |
 |
Quadrant C |
| Plot type | Count rate plots | Images |
|---|---|---|
| Comparison with Poisson distribution Blue bars denote a histogram of data divided into 1 sec bins. Red curve is a Poisson curve with rate = median count rate of data. |
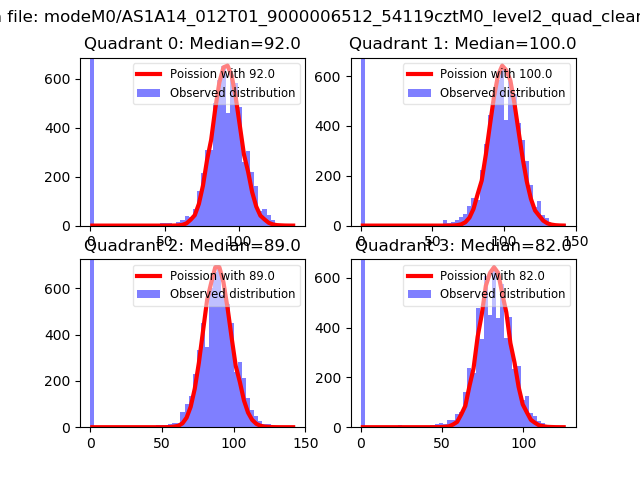 |
 |
| Quadrant-wise count rates Data is divided into 100 sec bins |
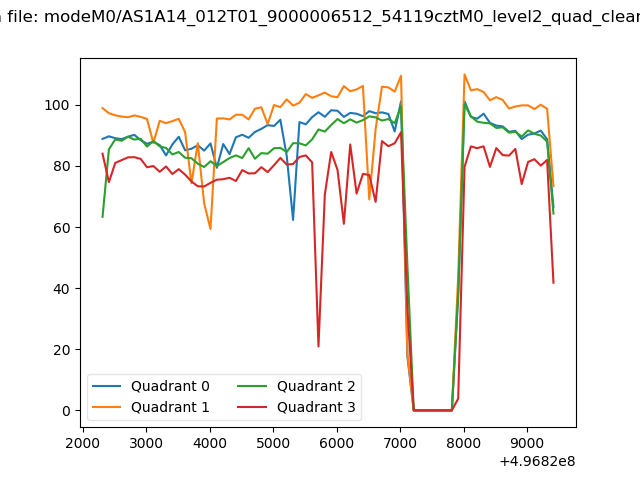 |
|
| Module-wise count rates for Quadrant A Data is divided into 100 sec bins |
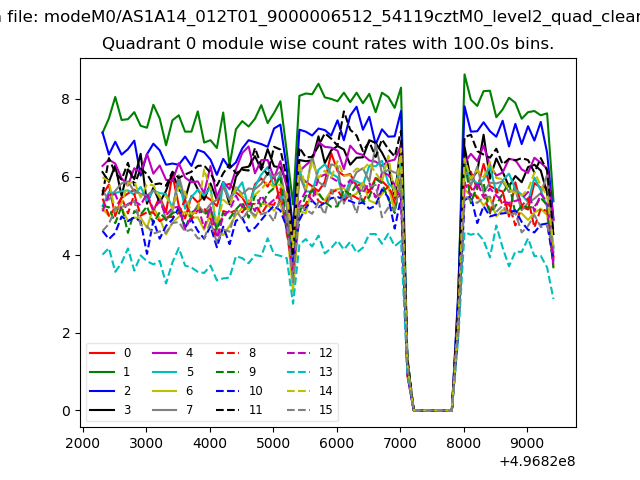 |
 |
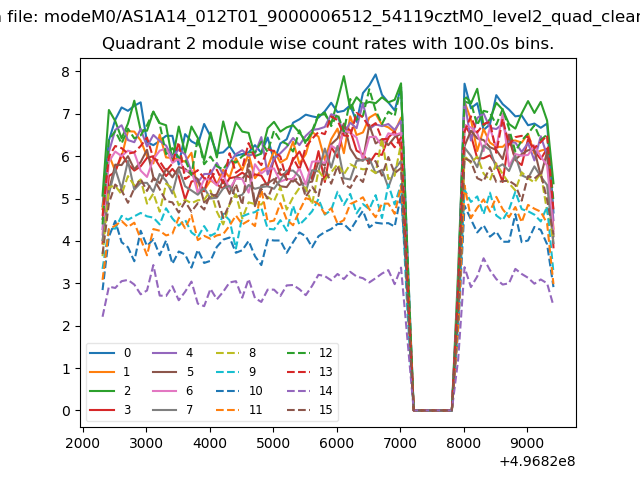
| Module-wise count rates for Quadrant B Data is divided into 100 sec bins |
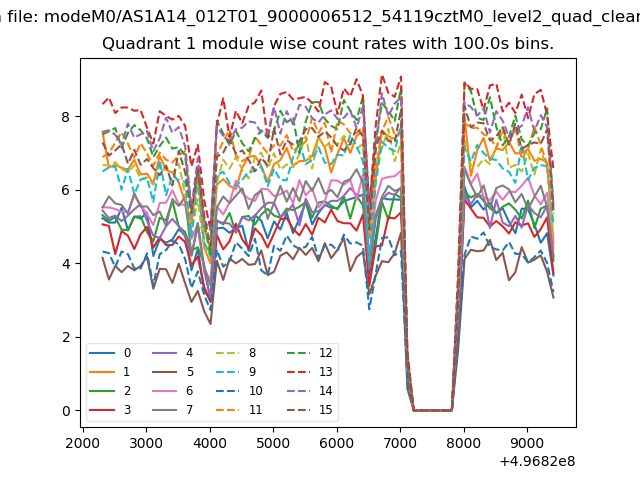 |
 |
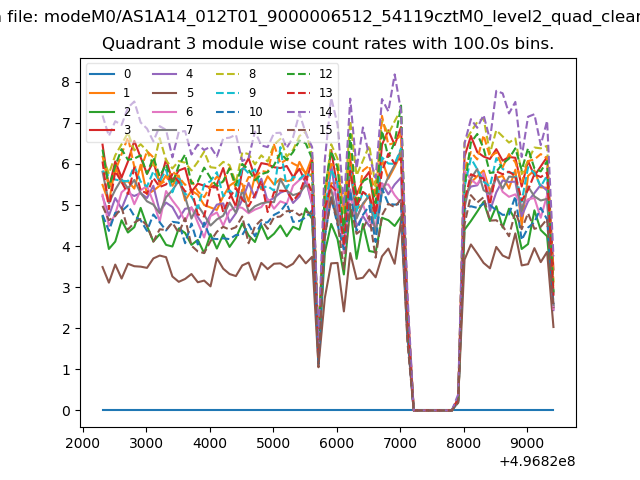
| Module-wise count rates for Quadrant C Data is divided into 100 sec bins |
 |
 |
| Module-wise count rates for Quadrant D Data is divided into 100 sec bins |
 |
 |
| Parameter | Plot |
|---|---|
| CZT HV Monitor | 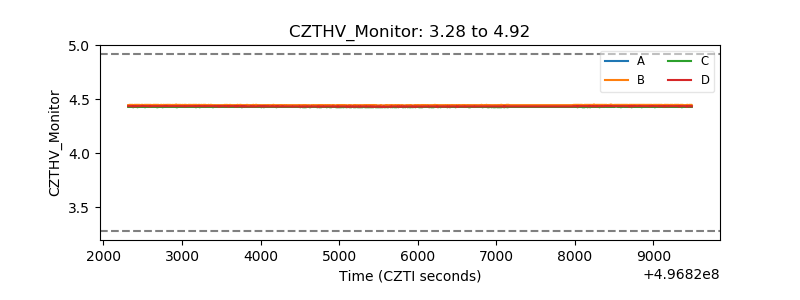 |
| D_VDD | 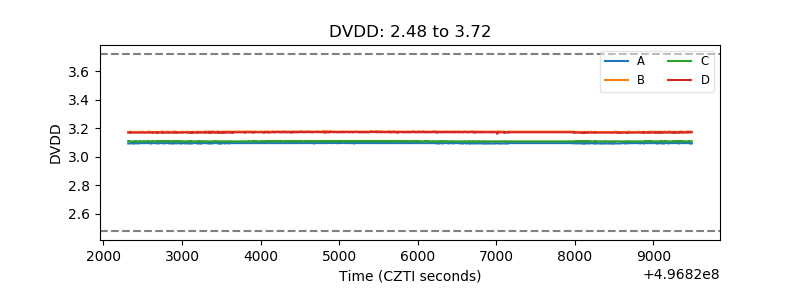 |
| Temperature 1 | 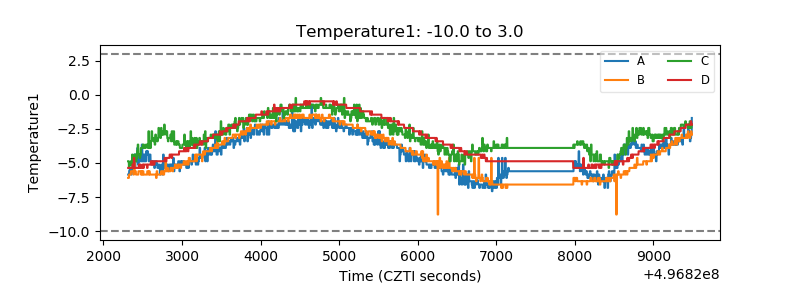 |
| Veto HV Monitor | 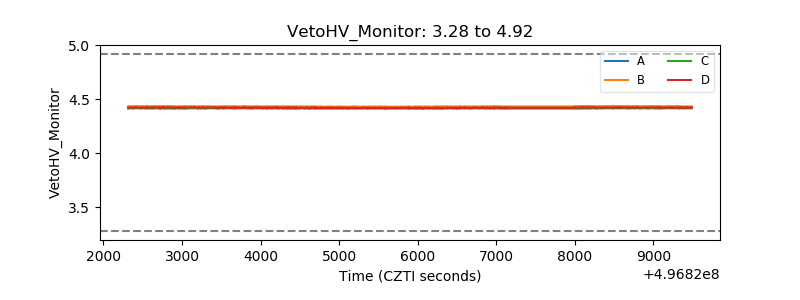 |
| Veto LLD | 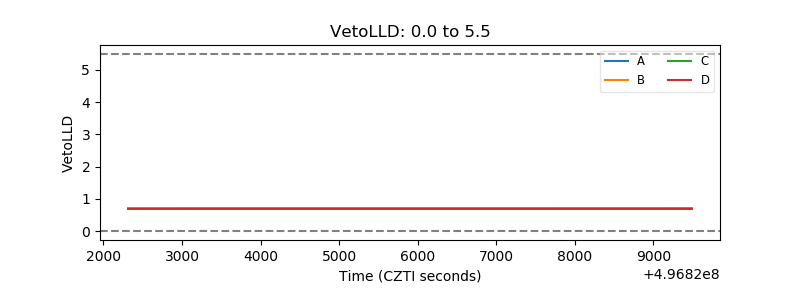 |
| Alpha Counter | 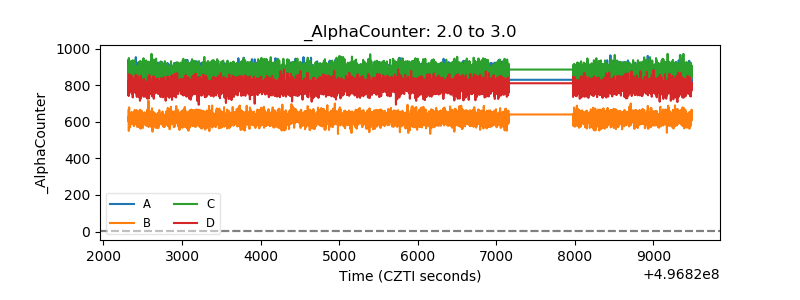 |
| _CPM_Rate | 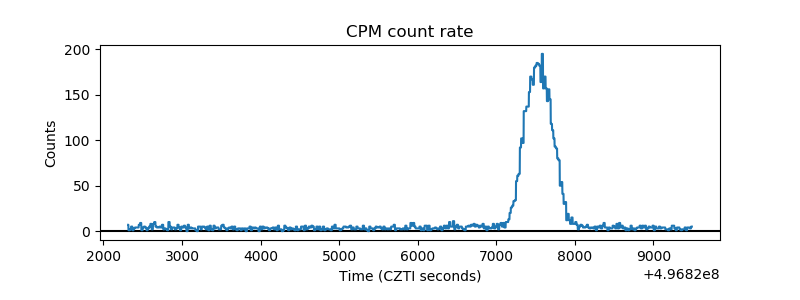 |
| CZT Counter | 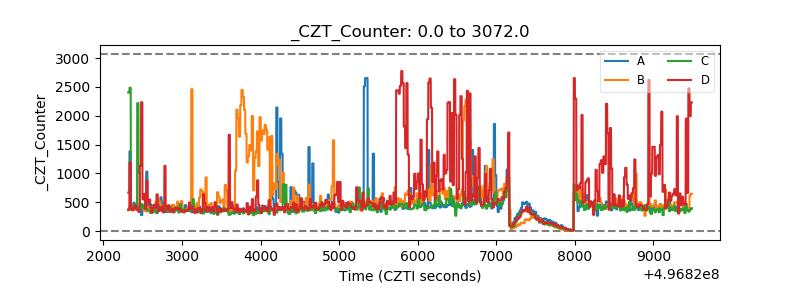 |
| +2.5 Volts monitor | 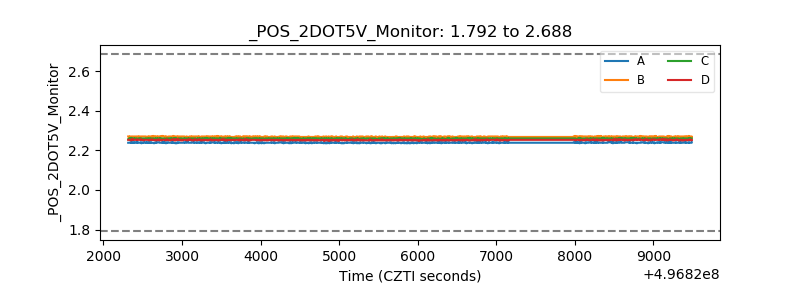 |
| +5 Volts monitor | 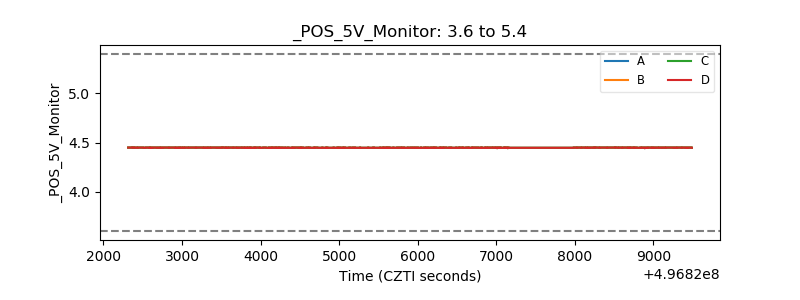 |
| _ROLL_ROT | 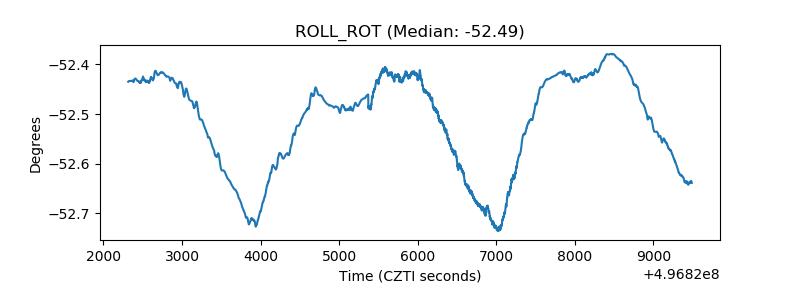 |
| _Roll_DEC | 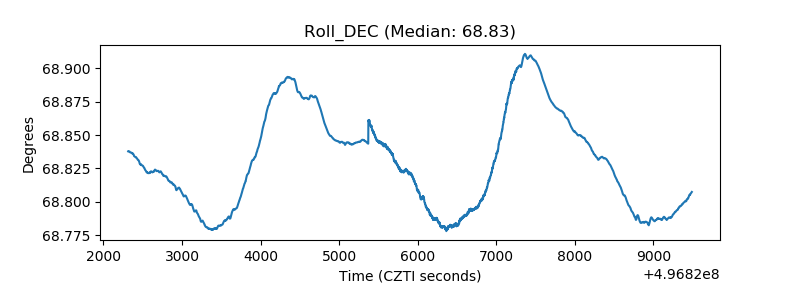 |
| _Roll_RA | 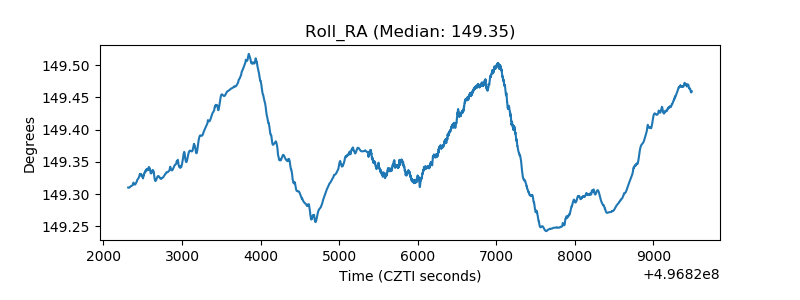 |
| Veto Counter | 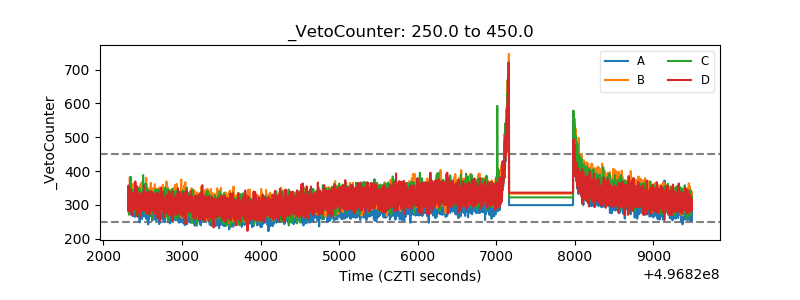 |