| Param | Original file | Final file |
|---|---|---|
| Filename | modeM0/AS1A14_012T01_9000006512_54121cztM0_level2.fits | modeM0/AS1A14_012T01_9000006512_54121cztM0_level2_quad_clean.evt |
| Size (bytes) | 454,394,880 | 88,738,560 |
| Size | 433.3 MB | 84.6 MB |
| Events in quadrant A | 3,103,539 | 585,751 |
| Events in quadrant B | 4,005,065 | 631,742 |
| Events in quadrant C | 2,827,447 | 568,548 |
| Events in quadrant D | 6,394,544 | 461,295 |
| Mode SS | |||
|---|---|---|---|
| Quadrant | BADHDUFLAG | Total packets | Discarded packets |
| A | 0 | 128 | 0 |
| B | 0 | 128 | 0 |
| C | 0 | 128 | 0 |
| D | 0 | 128 | 0 |
| Mode M0 | |||
|---|---|---|---|
| Quadrant | BADHDUFLAG | Total packets | Discarded packets |
| A | 0 | 13889 | 1 |
| B | 0 | 16217 | 1 |
| C | 0 | 13438 | 1 |
| D | 0 | 23385 | 1 |
| Mode M9 | |||
|---|---|---|---|
| Quadrant | BADHDUFLAG | Total packets | Discarded packets |
| A | 0 | 9 | 0 |
| B | 0 | 9 | 0 |
| C | 0 | 9 | 0 |
| D | 0 | 9 | 0 |
| Quadrant | Total seconds | Saturated seconds | Saturation percentage |
|---|---|---|---|
| A | 6296 | 123 | 1.953621% |
| B | 6296 | 143 | 2.271283% |
| C | 6297 | 57 | 0.905193% |
| D | 6297 | 1020 | 16.198190% |
Noise dominated data is calculated using 1-second bins in cleaned event files. If a bin has >2000 counts, and if more than 50% of those come from <1% of pixels, then it is considered to be noise-dominated and hence unusable.
| Quadrant | # 1 sec bins | Bins with >0 counts | Bins with >2000 counts | High rate bins dominated by noise | Noise dominated (total time) | Noise dominated (detector-on time) | Marked lightcurve |
|---|---|---|---|---|---|---|---|
| A | 7191 | 6296 | 45 | 45 | 0.63% | 0.71% | 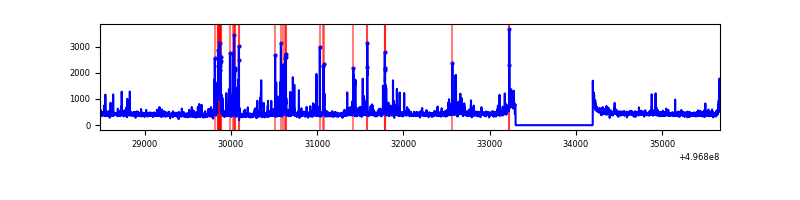 |
| B | 7191 | 6296 | 65 | 65 | 0.90% | 1.03% | 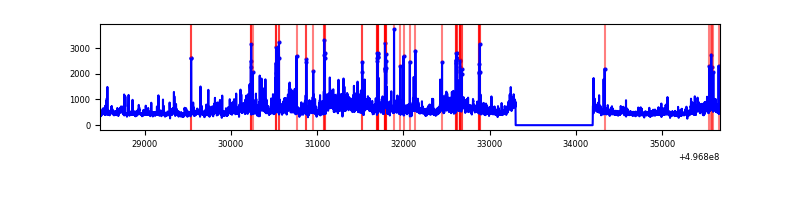 |
| C | 7192 | 6298 | 28 | 28 | 0.39% | 0.44% | 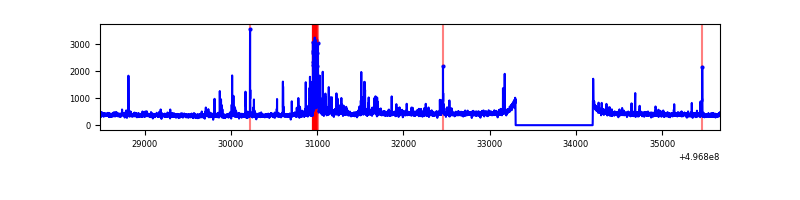 |
| D | 7192 | 6298 | 911 | 911 | 12.67% | 14.46% | 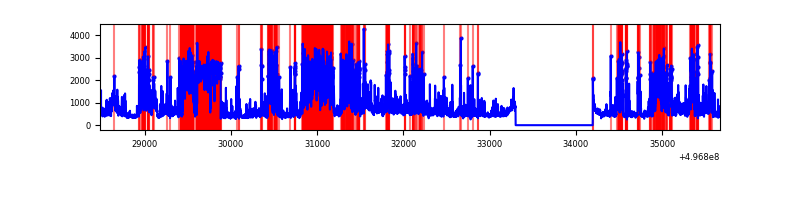 |
Top three noisy pixels from each quadrant. If the there are fewer than three noisy pixels in the level2.evt file, extra rows are filled as -1
| Pixel properties | Quadrant properties | ||||||
|---|---|---|---|---|---|---|---|
| Quadrant | DetID | PixID | Counts | Sigma | Mean | Median | Sigma |
| A | 15 | 174 | 326369 | 2009.47 | 655 | 639 | 162.1 |
| A | 8 | 6 | 50358 | 306.72 | 655 | 639 | 162.1 |
| A | 3 | 14 | 46312 | 281.76 | 655 | 639 | 162.1 |
| B | 7 | 0 | 422897 | 3043.67 | 646 | 625 | 138.7 |
| B | 15 | 20 | 288870 | 2077.63 | 646 | 625 | 138.7 |
| B | 14 | 167 | 161417 | 1158.96 | 646 | 625 | 138.7 |
| C | 15 | 147 | 211235 | 1200.04 | 634 | 625 | 175.5 |
| C | 14 | 254 | 36559 | 204.75 | 634 | 625 | 175.5 |
| C | 12 | 252 | 25302 | 140.61 | 634 | 625 | 175.5 |
| D | 7 | 70 | 1319596 | 7779.46 | 593 | 565 | 169.6 |
| D | 8 | 176 | 809287 | 4769.73 | 593 | 565 | 169.6 |
| D | 2 | 165 | 748824 | 4413.12 | 593 | 565 | 169.6 |
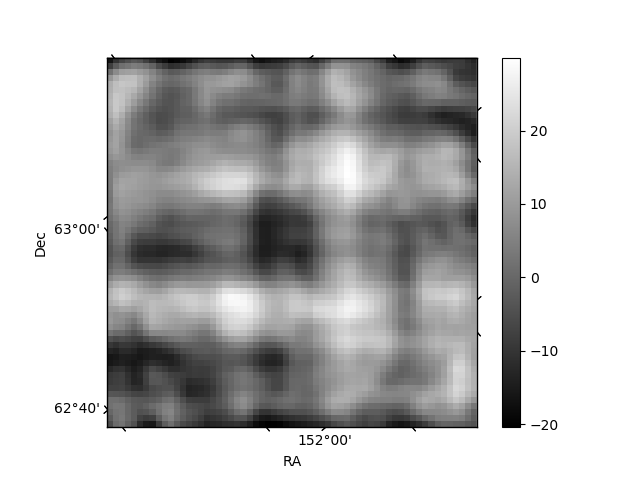
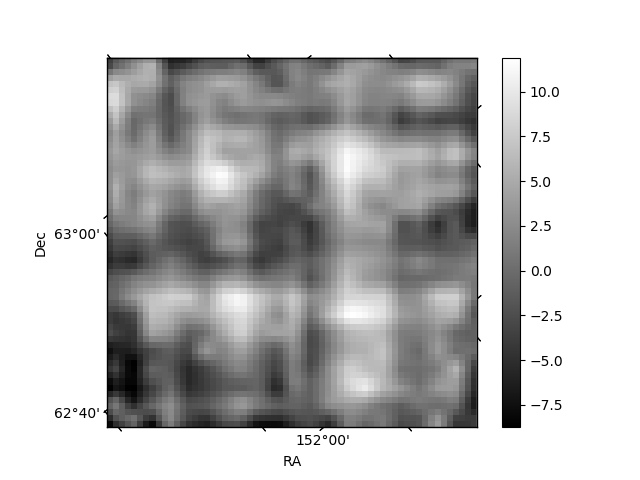
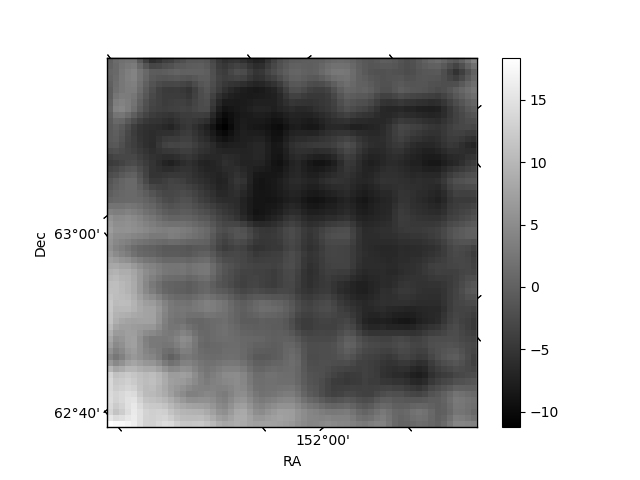
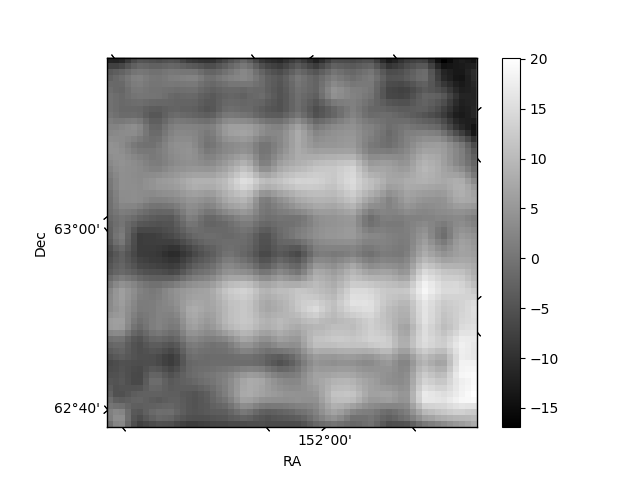
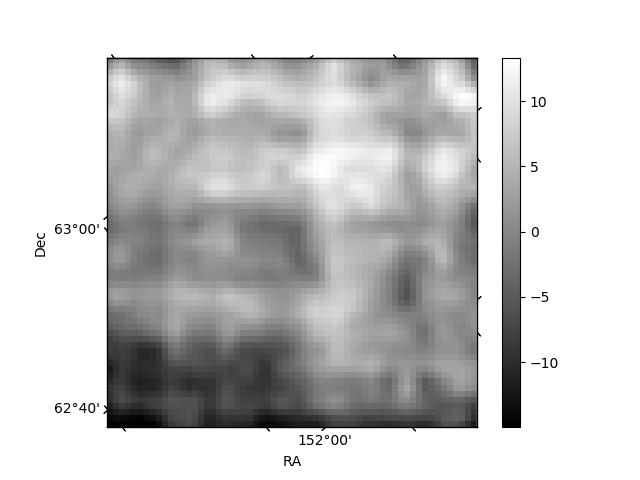
Histogram calculated using DETX and DETY for each event in the final _common_clean file
| Quadrant A | 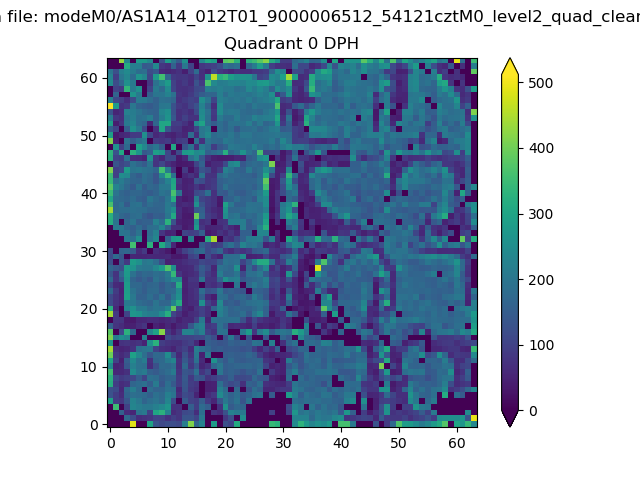 |
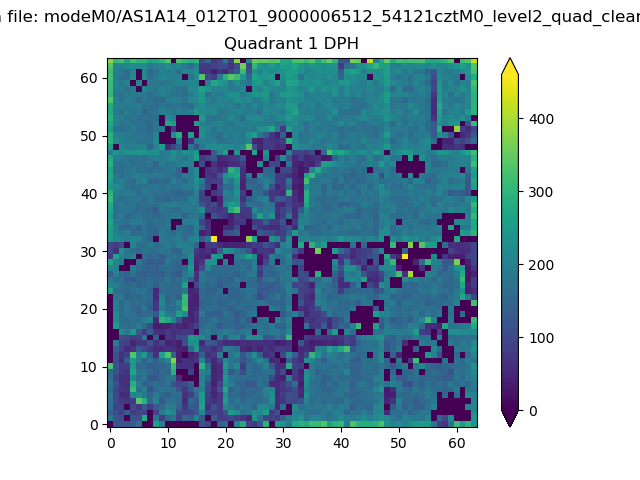 |
Quadrant B |
|---|---|---|---|
| Quadrant D | 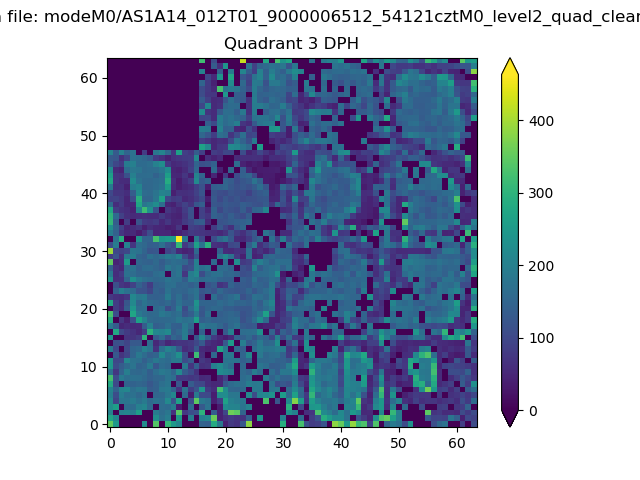 |
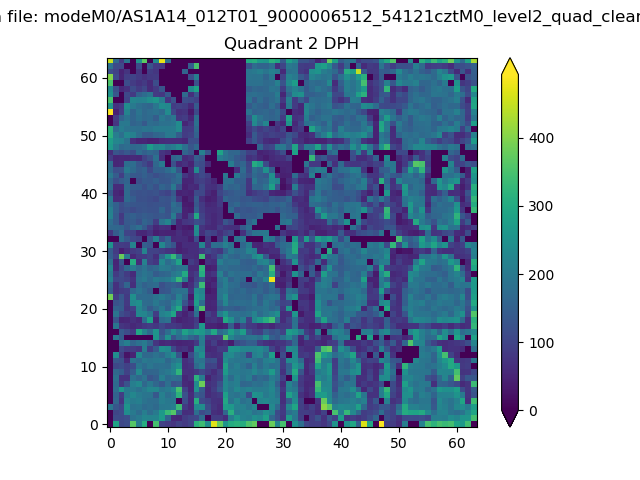 |
Quadrant C |
| Plot type | Count rate plots | Images |
|---|---|---|
| Comparison with Poisson distribution Blue bars denote a histogram of data divided into 1 sec bins. Red curve is a Poisson curve with rate = median count rate of data. |
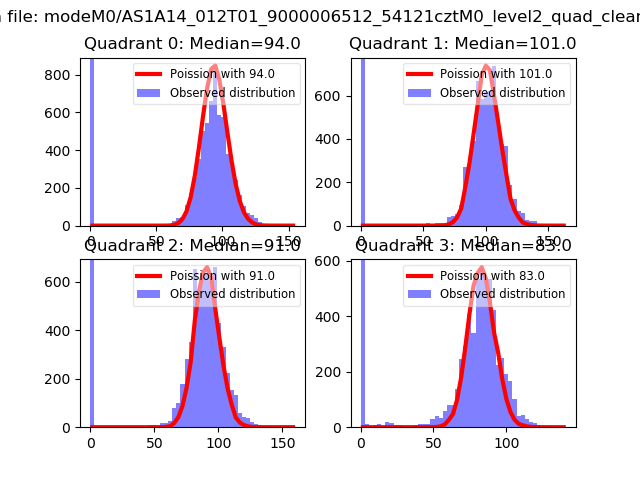 |
 |
| Quadrant-wise count rates Data is divided into 100 sec bins |
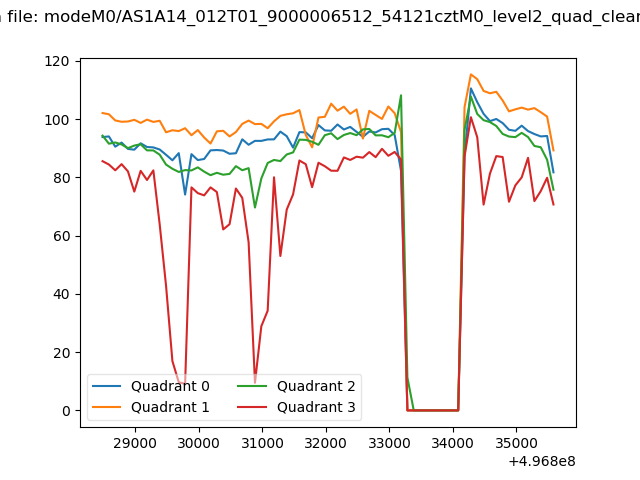 |
|
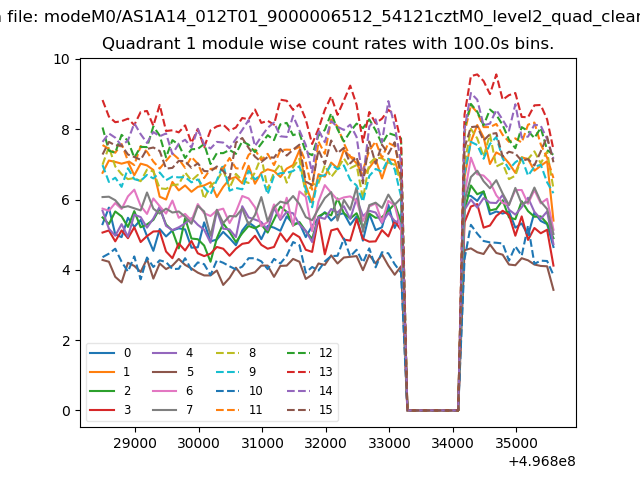
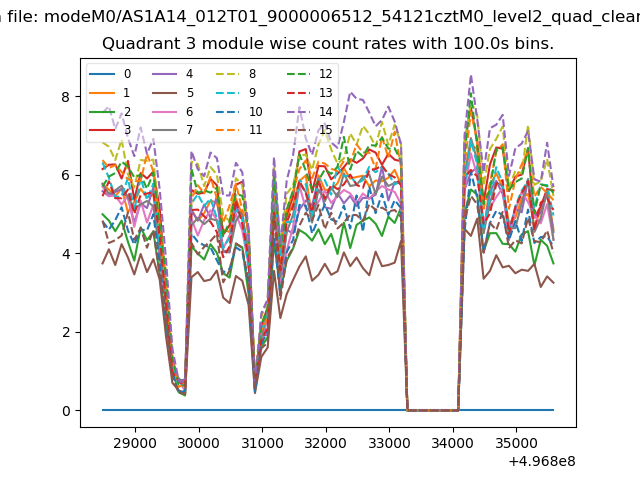
| Module-wise count rates for Quadrant A Data is divided into 100 sec bins |
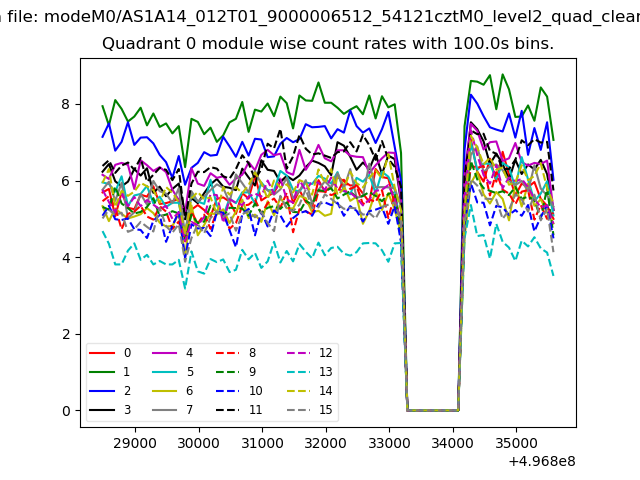 |
 |
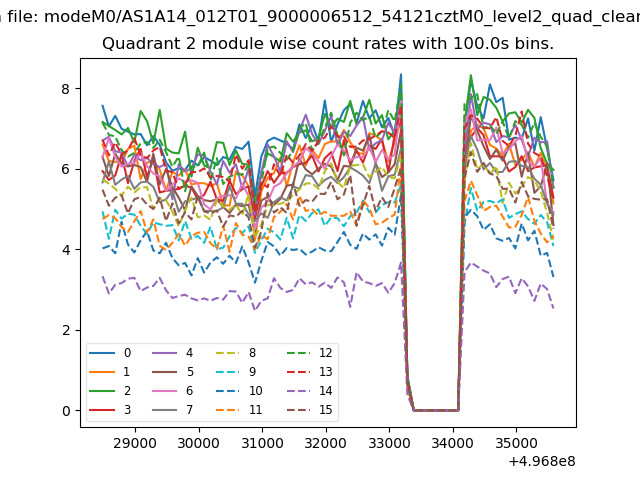
| Module-wise count rates for Quadrant B Data is divided into 100 sec bins |
 |
 |
| Module-wise count rates for Quadrant C Data is divided into 100 sec bins |
 |
 |
| Module-wise count rates for Quadrant D Data is divided into 100 sec bins |
 |
 |
| Parameter | Plot |
|---|---|
| CZT HV Monitor |  |
| D_VDD | 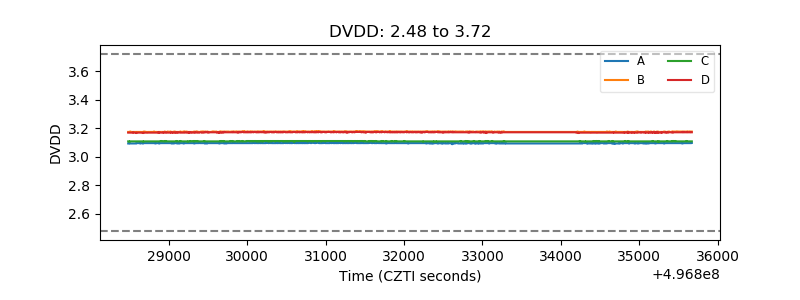 |
| Temperature 1 | 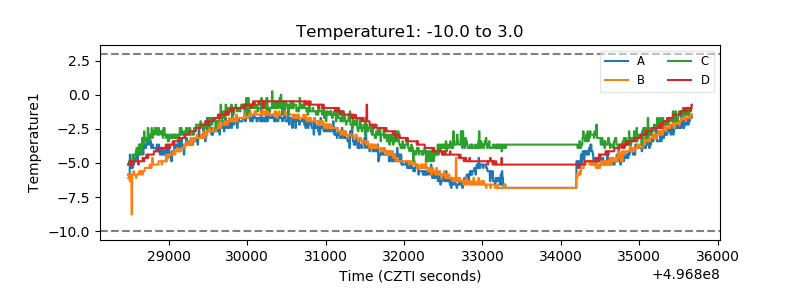 |
| Veto HV Monitor | 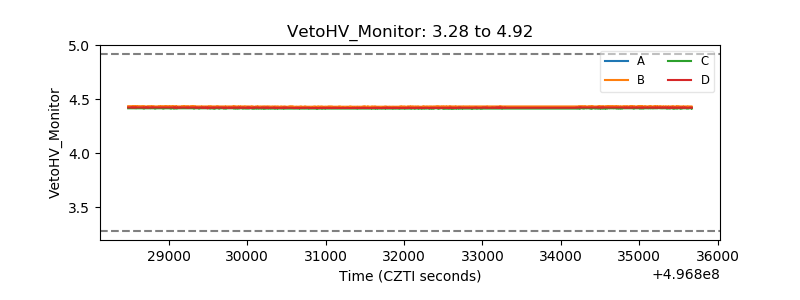 |
| Veto LLD | 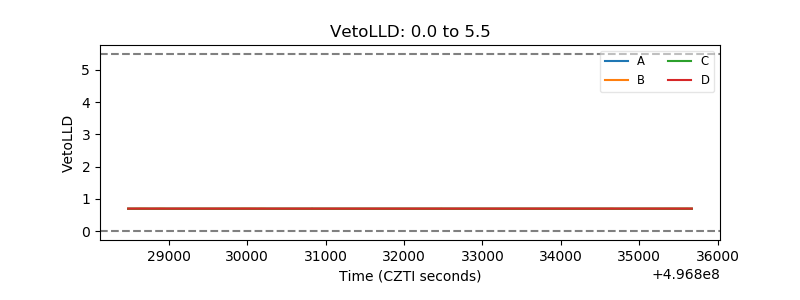 |
| Alpha Counter | 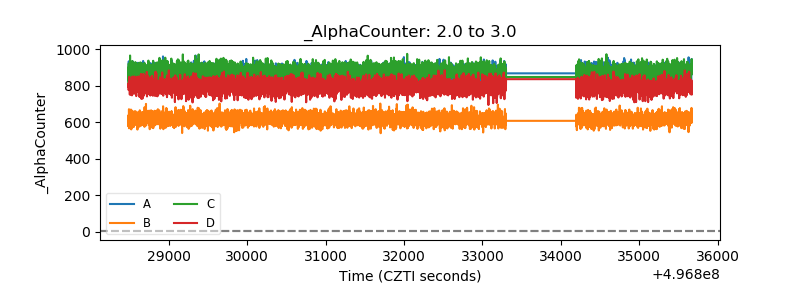 |
| _CPM_Rate | 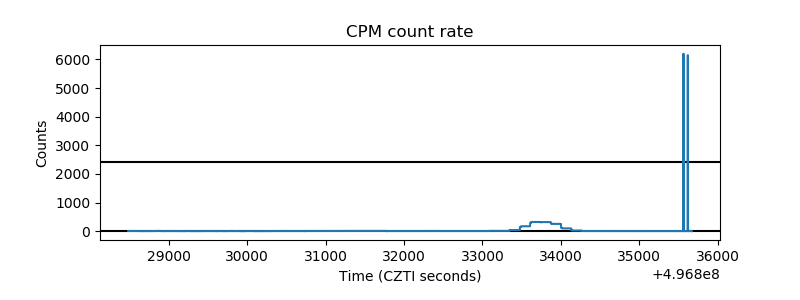 |
| CZT Counter | 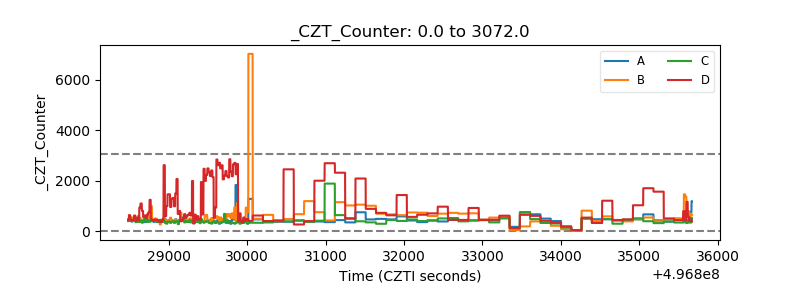 |
| +2.5 Volts monitor | 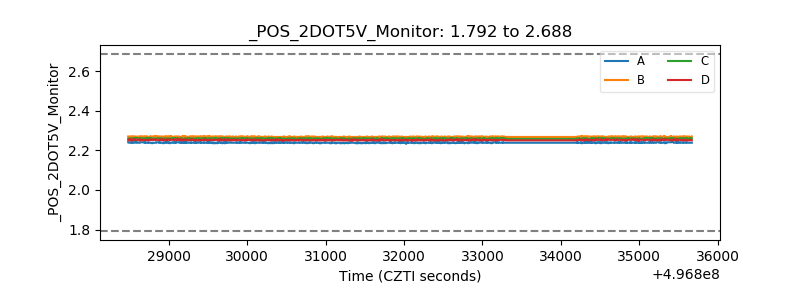 |
| +5 Volts monitor | 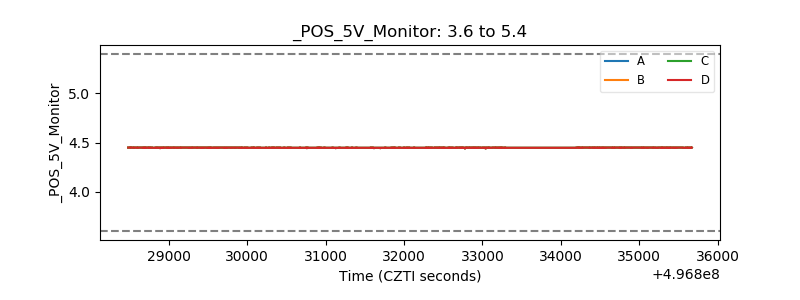 |
| _ROLL_ROT | 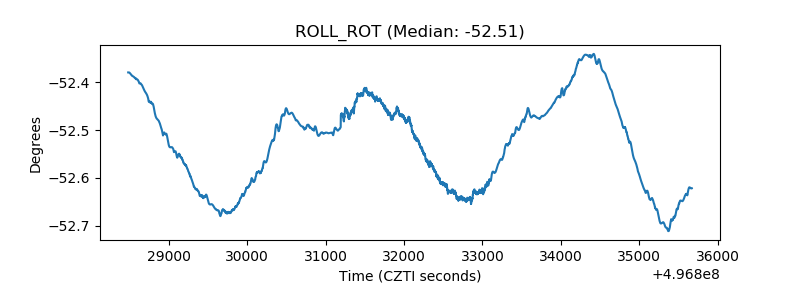 |
| _Roll_DEC | 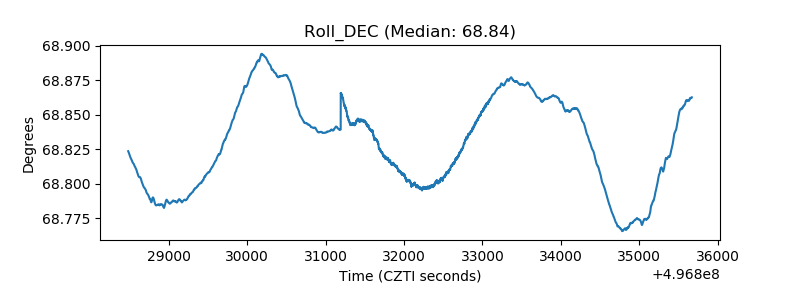 |
| _Roll_RA | 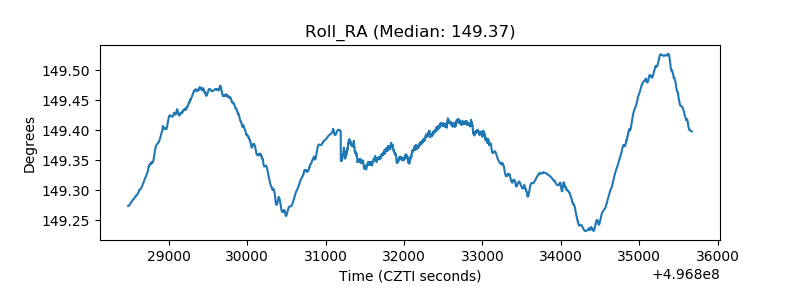 |
| Veto Counter | 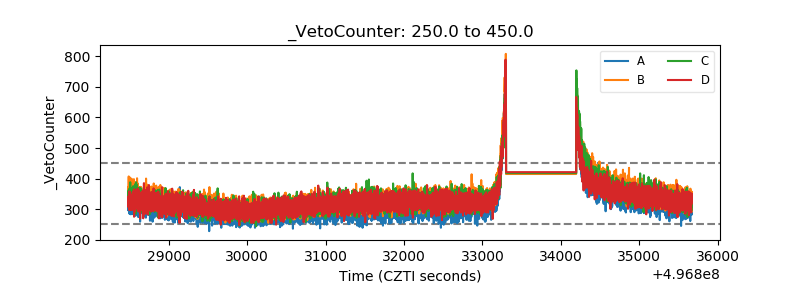 |