| Param | Original file | Final file |
|---|---|---|
| Filename | modeM0/AS1A14_012T01_9000006512_54122cztM0_level2.fits | modeM0/AS1A14_012T01_9000006512_54122cztM0_level2_quad_clean.evt |
| Size (bytes) | 406,684,800 | 91,379,520 |
| Size | 387.8 MB | 87.1 MB |
| Events in quadrant A | 3,047,746 | 600,449 |
| Events in quadrant B | 4,329,270 | 629,456 |
| Events in quadrant C | 2,644,110 | 576,581 |
| Events in quadrant D | 4,546,546 | 523,452 |
| Mode SS | |||
|---|---|---|---|
| Quadrant | BADHDUFLAG | Total packets | Discarded packets |
| A | 0 | 128 | 0 |
| B | 0 | 128 | 0 |
| C | 0 | 128 | 0 |
| D | 0 | 128 | 0 |
| Mode M0 | |||
|---|---|---|---|
| Quadrant | BADHDUFLAG | Total packets | Discarded packets |
| A | 0 | 13601 | 1 |
| B | 0 | 17154 | 1 |
| C | 0 | 12862 | 4 |
| D | 0 | 17715 | 1 |
| Mode M9 | |||
|---|---|---|---|
| Quadrant | BADHDUFLAG | Total packets | Discarded packets |
| A | 0 | 10 | 0 |
| B | 0 | 10 | 0 |
| C | 0 | 10 | 0 |
| D | 0 | 10 | 0 |
| Quadrant | Total seconds | Saturated seconds | Saturation percentage |
|---|---|---|---|
| A | 6257 | 79 | 1.262586% |
| B | 6257 | 250 | 3.995525% |
| C | 6255 | 24 | 0.383693% |
| D | 6257 | 264 | 4.219274% |
Noise dominated data is calculated using 1-second bins in cleaned event files. If a bin has >2000 counts, and if more than 50% of those come from <1% of pixels, then it is considered to be noise-dominated and hence unusable.
| Quadrant | # 1 sec bins | Bins with >0 counts | Bins with >2000 counts | High rate bins dominated by noise | Noise dominated (total time) | Noise dominated (detector-on time) | Marked lightcurve |
|---|---|---|---|---|---|---|---|
| A | 7266 | 6257 | 35 | 35 | 0.48% | 0.56% | 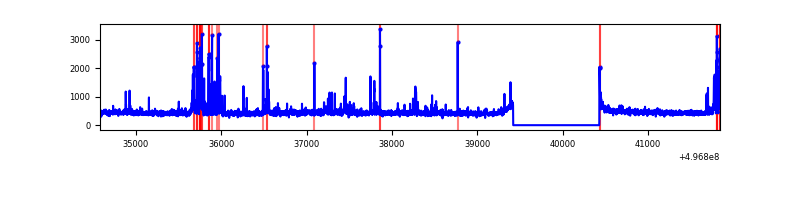 |
| B | 7267 | 6258 | 160 | 160 | 2.20% | 2.56% | 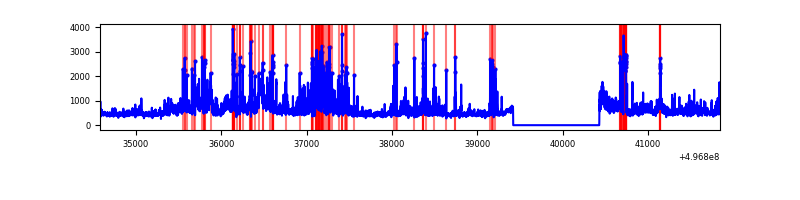 |
| C | 7267 | 6257 | 5 | 5 | 0.07% | 0.08% | 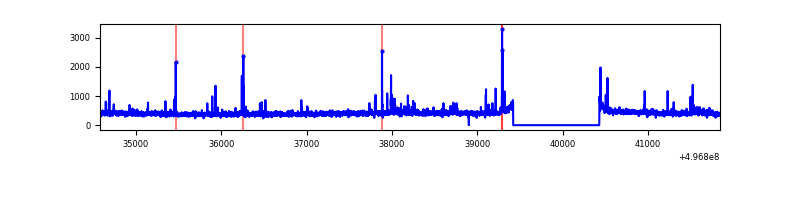 |
| D | 7267 | 6258 | 227 | 227 | 3.12% | 3.63% | 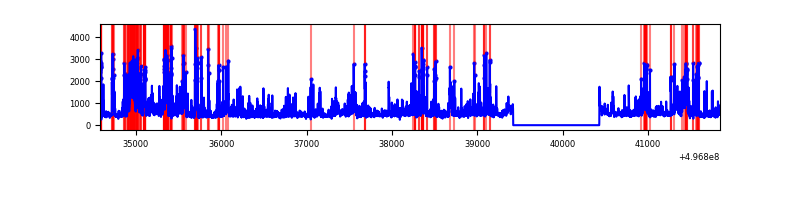 |
Top three noisy pixels from each quadrant. If the there are fewer than three noisy pixels in the level2.evt file, extra rows are filled as -1
| Pixel properties | Quadrant properties | ||||||
|---|---|---|---|---|---|---|---|
| Quadrant | DetID | PixID | Counts | Sigma | Mean | Median | Sigma |
| A | 15 | 174 | 258656 | 1572.46 | 661 | 645 | 164.1 |
| A | 3 | 14 | 80527 | 486.85 | 661 | 645 | 164.1 |
| A | 2 | 143 | 42397 | 254.46 | 661 | 645 | 164.1 |
| B | 15 | 20 | 429600 | 3166.56 | 642 | 621 | 135.5 |
| B | 5 | 236 | 223174 | 1642.8 | 642 | 621 | 135.5 |
| B | 5 | 248 | 147538 | 1084.49 | 642 | 621 | 135.5 |
| C | 12 | 252 | 57348 | 320.07 | 639 | 630 | 177.2 |
| C | 14 | 254 | 40693 | 226.08 | 639 | 630 | 177.2 |
| C | 9 | 38 | 16720 | 90.8 | 639 | 630 | 177.2 |
| D | 7 | 70 | 474959 | 2623.4 | 632 | 603 | 180.8 |
| D | 2 | 165 | 456636 | 2522.06 | 632 | 603 | 180.8 |
| D | 3 | 12 | 246923 | 1362.26 | 632 | 603 | 180.8 |
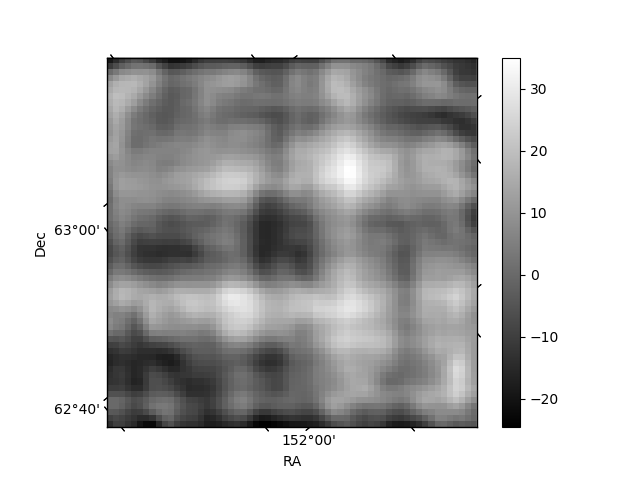
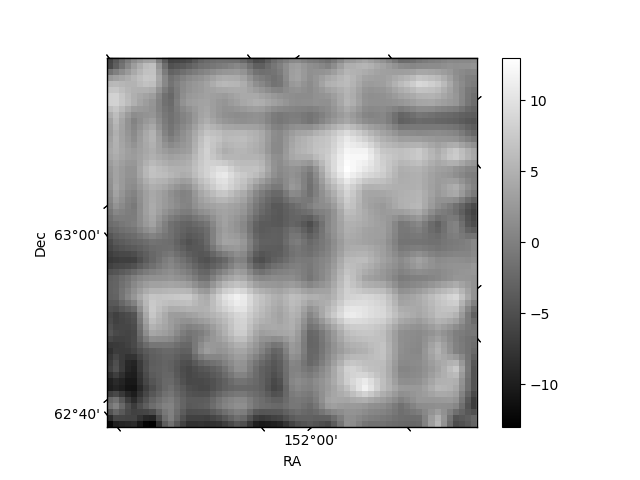
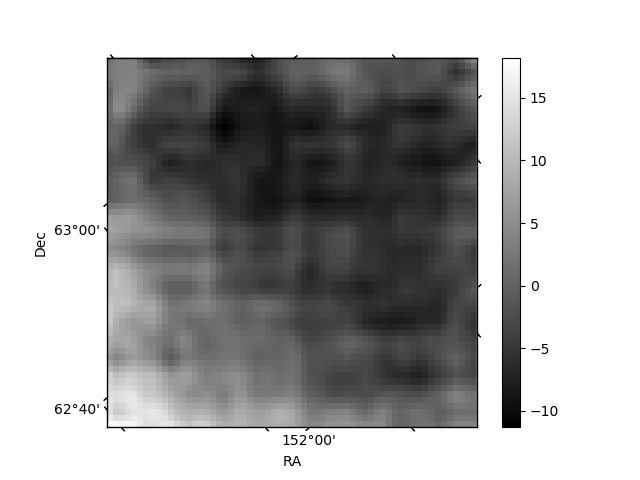
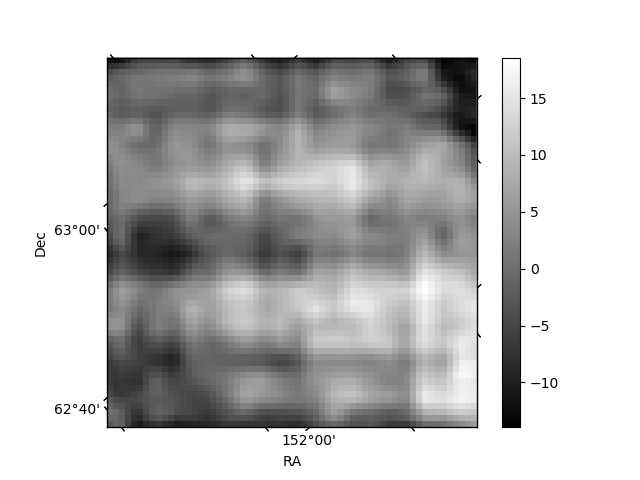
Histogram calculated using DETX and DETY for each event in the final _common_clean file
| Quadrant A | 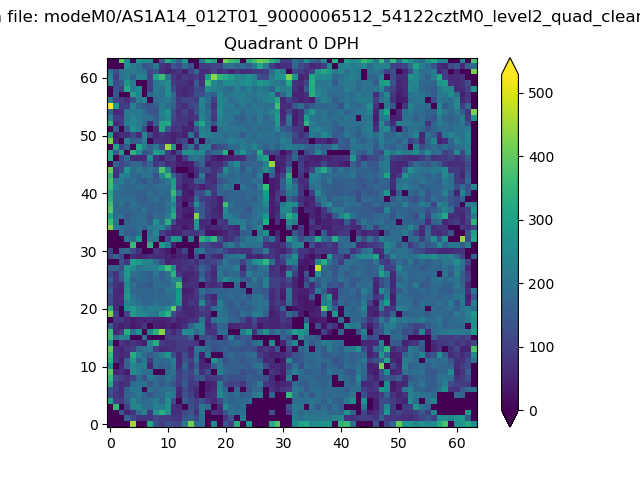 |
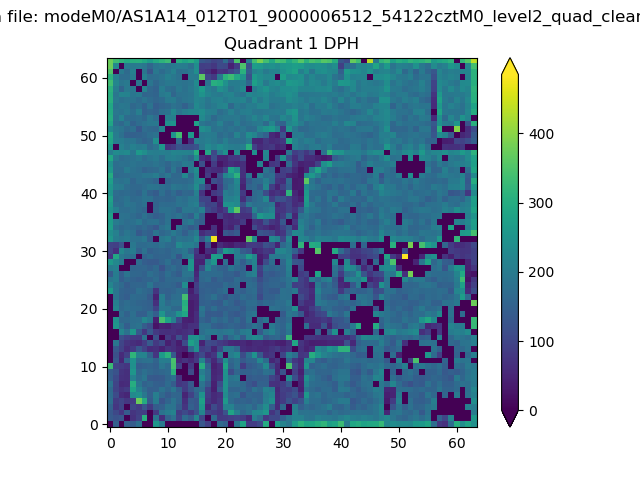 |
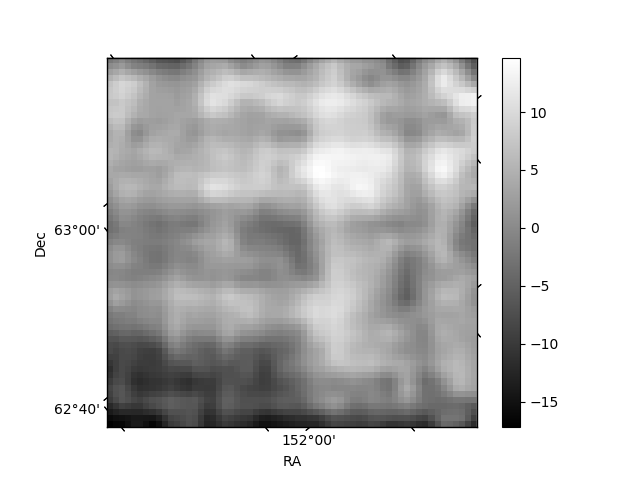
Quadrant B |
|---|---|---|---|
| Quadrant D | 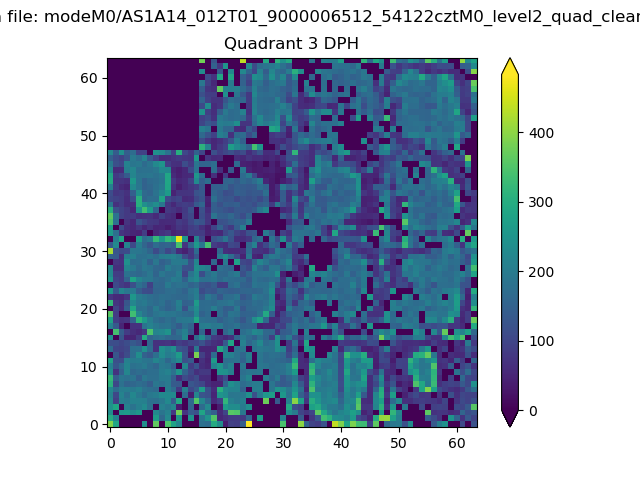 |
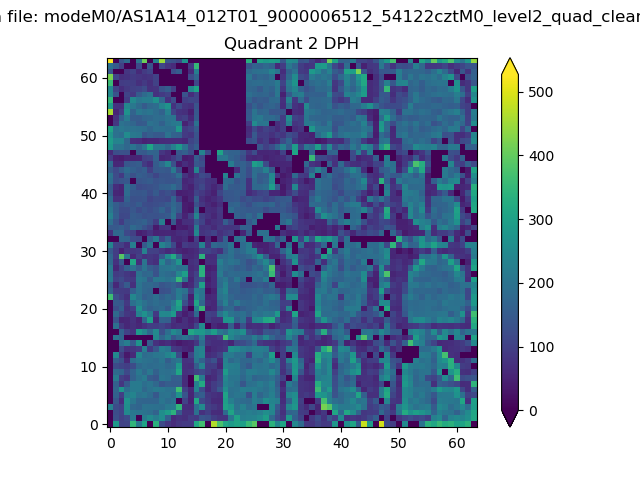 |
Quadrant C |
| Plot type | Count rate plots | Images |
|---|---|---|
| Comparison with Poisson distribution Blue bars denote a histogram of data divided into 1 sec bins. Red curve is a Poisson curve with rate = median count rate of data. |
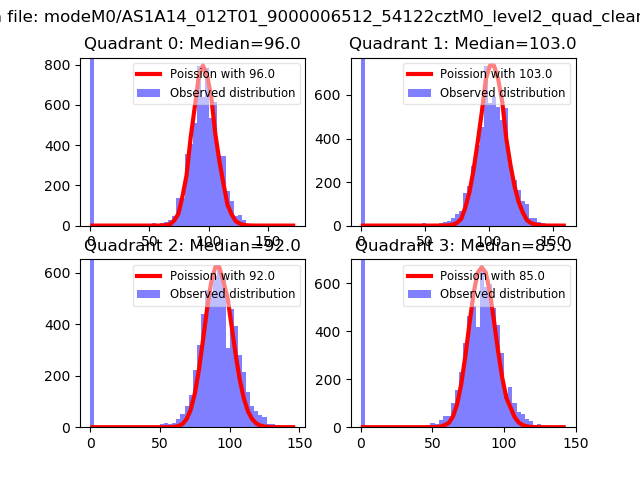 |
 |
| Quadrant-wise count rates Data is divided into 100 sec bins |
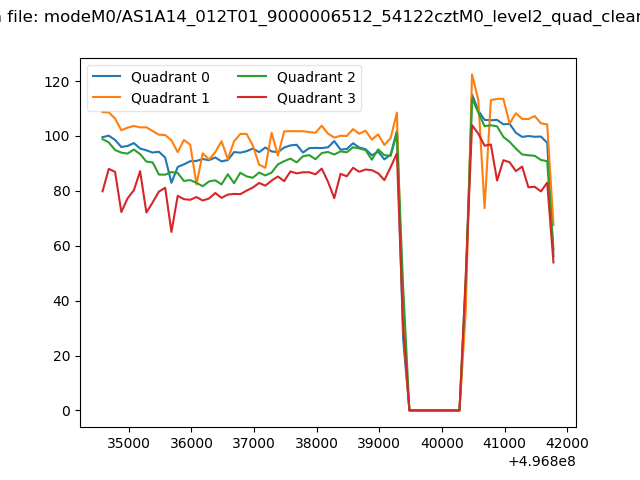 |
|
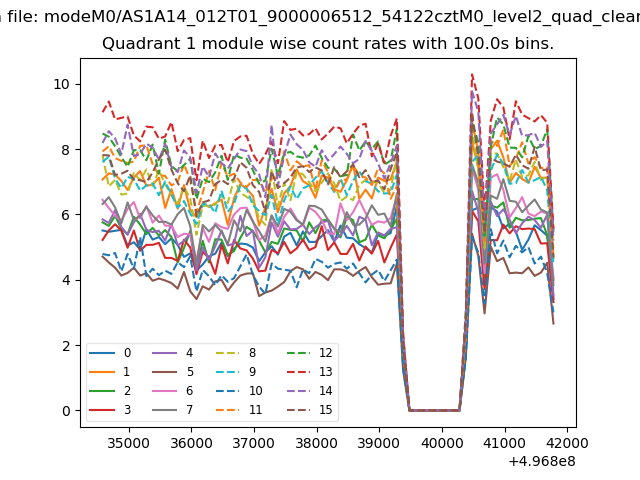
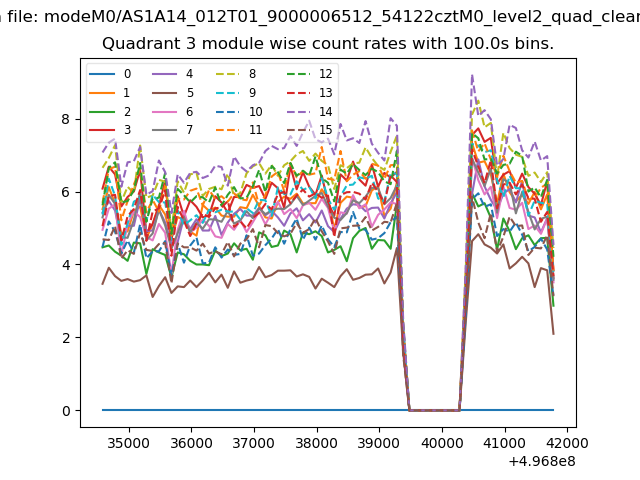
| Module-wise count rates for Quadrant A Data is divided into 100 sec bins |
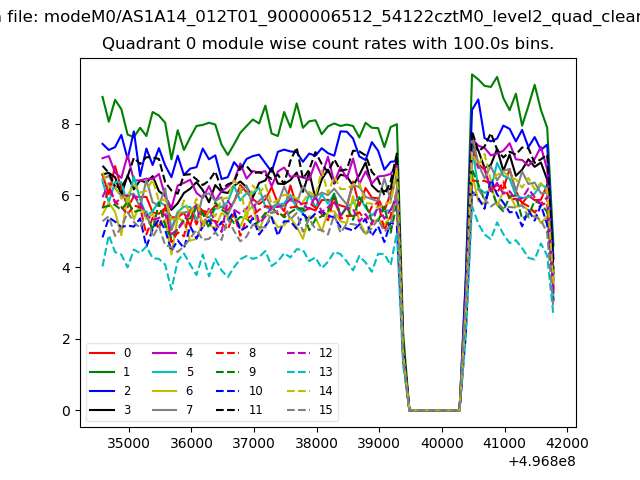 |
 |
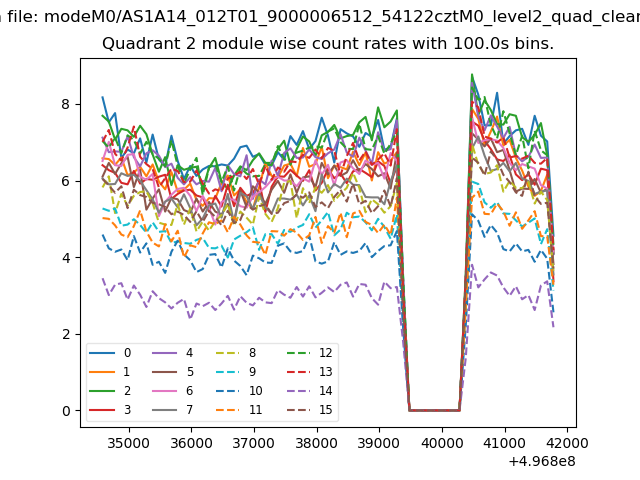
| Module-wise count rates for Quadrant B Data is divided into 100 sec bins |
 |
 |
| Module-wise count rates for Quadrant C Data is divided into 100 sec bins |
 |
 |
| Module-wise count rates for Quadrant D Data is divided into 100 sec bins |
 |
 |
| Parameter | Plot |
|---|---|
| CZT HV Monitor | 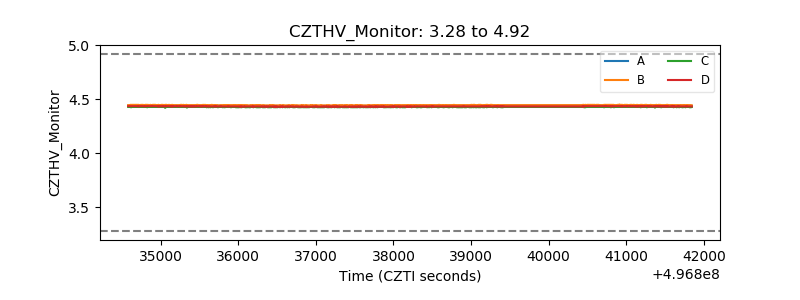 |
| D_VDD | 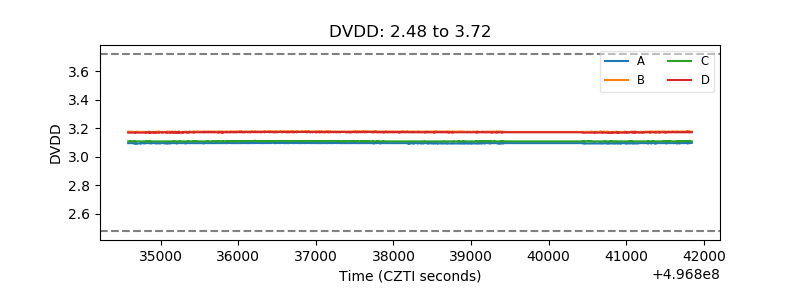 |
| Temperature 1 | 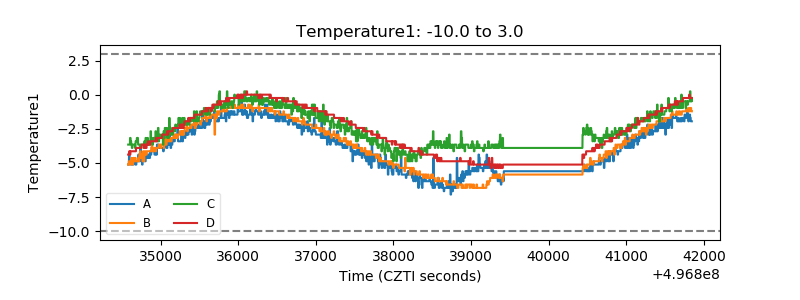 |
| Veto HV Monitor | 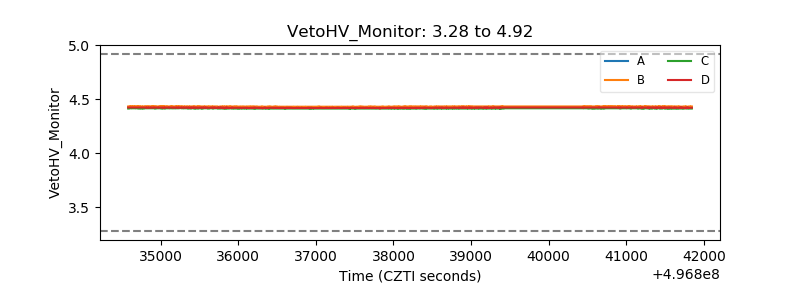 |
| Veto LLD | 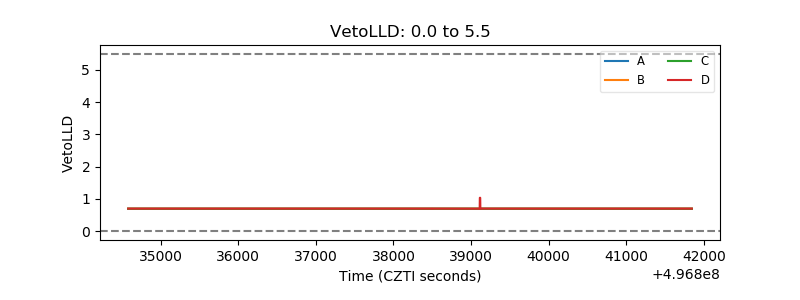 |
| Alpha Counter |  |
| _CPM_Rate | 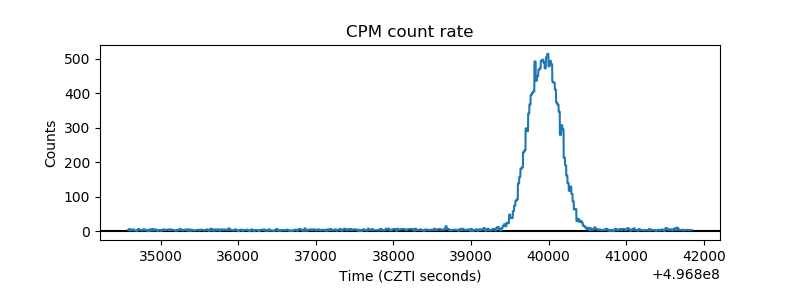 |
| CZT Counter | 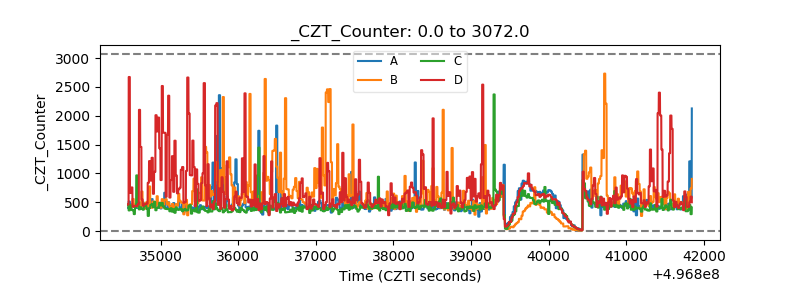 |
| +2.5 Volts monitor |  |
| +5 Volts monitor |  |
| _ROLL_ROT | 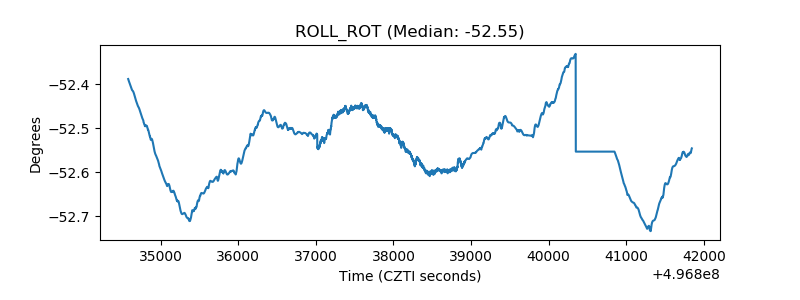 |
| _Roll_DEC | 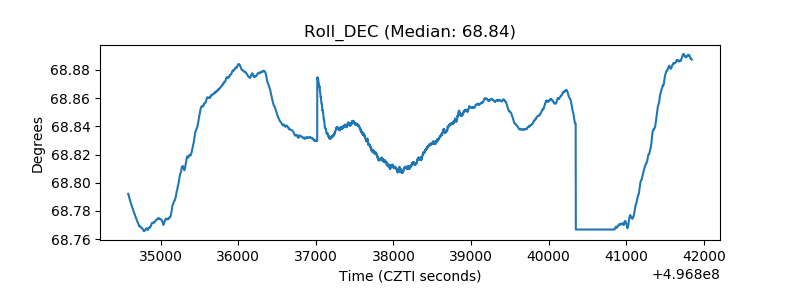 |
| _Roll_RA | 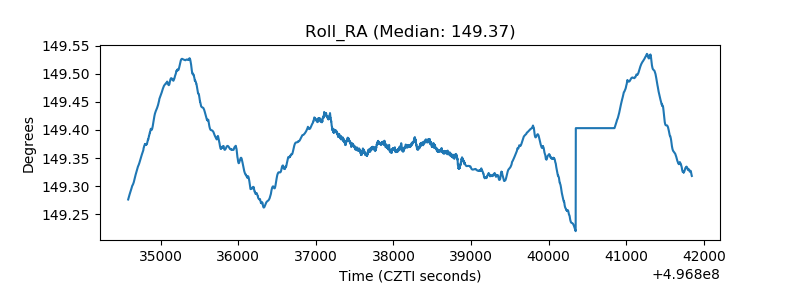 |
| Veto Counter | 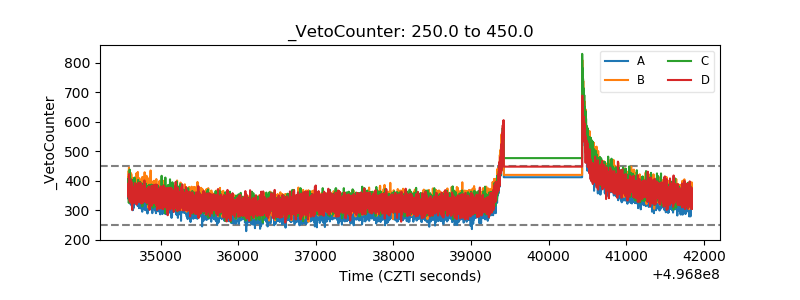 |